www.nature.com/scientificreports
OPEN
Received: 1 February 2018 Accepted: 10 May 2018 Published: xx xx xxxx
Voting Simulation based Agglomerative Hierarchical Method for Network Community Detection Jianjun Cheng1,2, Xinhong Yin1, Qi Li1, Haijuan Yang3, Longjie Li1, Mingwei Leng4 & Xiaoyun Chen1 Community detection has been paid much attention in many fields in recent years, and a great deal of community-detection methods have been proposed. But the time consumption of some of them is heavy, limiting them from being applied to large-scale networks. On the contrary, there exist some lower-time-complexity methods. But most of them are non-deterministic, meaning that running the same method many times may yield different results from the same network, which reduces their practical utility greatly in real-world applications. To solve these problems, we propose a communitydetection method in this paper, which takes both the quality of the results and the efficiency of the detecting procedure into account. Moreover, it is a deterministic method which can extract definite community structures from networks. The proposed method is inspired by the voting behaviours in election activities in the social society, in which we first simulate the voting procedure on the network. Every vertex votes for the nominated candidates following the proposed voting principles, densely connected groups of vertices can quickly reach a consensus on their candidates. At the end of this procedure, candidates and their own voters form a group of clusters. Then, we take the clusters as initial communities, and agglomerate some of them into larger ones with high efficiency to obtain the resulting community structures. We conducted extensive experiments on some artificial networks and real-world networks, the experimental results show that our proposed method can efficiently extract high-quality community structures from networks, and outperform the comparison algorithms significantly. Community structure is a significant structural characteristic of many complex networks, in which communities are always closely related to real functional modules in real-world systems, e.g., groups of Web pages1 or scientific articles2 sharing same topics, pathways in metabolic networks or complexes in protein-protein interaction networks3–7, the real social groupings in social networks, such as scientist groups working on specific research fields8,9, Jazz musician groups divided according to the locations and race10, and affiliations of gang members in the policing area of Hollenbeck, Los Angeles11. Therefore, detecting communities from complex networks can help us understand the structural characteristics of networks, and predict further the functional properties according to the structure. Besides this, the existence of community structures in networks can have considerable influences on such dynamic processes as information dispersions12,13 and synchronisations14 as .l. Therefore, community detection has received much attention, and a great deal of detection methods have been proposed. For instance, hierarchical methods either repeatedly divide networks into subnetworks8,9, or iteratively agglomerate small vertex groups into larger ones15,16, or combine both the divisive and agglomerative strategies17 to get the resulting community structures. Modularity-optimisation based methods12,15,16,18,19 utilise the intention of modularity9 – the larger the modularity, the better the corresponding community structure, to extract better results from networks via optimising the modularity as the objective to obtain a higher value. LPA20 and variants21–23 exploit information-propagation mechanism to detect community structures, they propagate labels in the network, and densely connected vertices in a network can quickly reach a consensus on a unique label, thus form a community. Network dynamics-based methods make use of dynamic processes in networks such as random walk24–26, information diffusion27, and distance dynamics28–30 to explore community structures. 1
Lanzhou University, School of Information Science and Engineering, Lanzhou, 730000, China. 2Gansu Resources and Environmental Science Data Engineering Technology Research Center, Lanzhou, 730000, China. 3Lanzhou Vocational Technical College, Department of Electronic Information Engineering, Lanzhou, 730070, China. 4Northwest Minzu University, School of Education Science and Technology, Lanzhou, 730030, China. Correspondence and requests for materials should be addressed to J.C. (email:
[email protected]) or X.C. (email:
[email protected]) ScieNtific ReporTS | (2018) 8:8064 | DOI:10.1038/s41598-018-26415-3
1
www.nature.com/scientificreports/ Spectral methods engage the eigen-spectra of various of matrices associated with networks, such as the adjacency matrix31,32, Laplacian matrix7,33–35, transition matrix11,36,37, and nonbacktracking matrix38–40 to reveal community structures. And density base methods23,41,42 use information of shared neighbours between vertices to define the concept of density of vertex or partition, then make utilisation of the concept to reveal community structures from networks.
Motivation
Many of those methods suffer from high-time consumption, so that they cannot be applied to large-scale networks. However, networks originated from real-world systems become larger and larger nowadays, the detecting efficiency is critical for some applications. To be frank, there already exist some methods, e.g., FastQ15,16, LPA20, and PPC26, can detect communities from networks with a relatively lower-time consumption. FastQ identifies communities from the network by repeatedly joining pairs of communities whose merge can lead to the largest modularity increment. The hierarchy corresponding to the largest modularity in the output dendrogram is the resulting community structure. The time complexity of FastQ is O(mh log n), or O(n log2 n) for sparse networks, where m, n are numbers of edges and vertices in the network, respectively; h is the height of the dendrogram. For LPA, each vertex in the network is assigned a unique label initially, then each vertex updates its label with the most frequent label in its neighbours. Updating continues until every vertex has a label which occurs most frequently among its neighbours. LPA can obtain the community structures in O(m + n) time consumption, the authors claimed that 95% of vertices or more can be classified correctly by the end of the 5th round of label update, irrespective of size of the network. Owing to its simplicity and efficiency, a series of variants have been derived from LPA. Barber et al.21 produced a variety of algorithms that propagate labels under constraints. LPAm is one of particular interest, which maximises the modularity corresponding to the final community structure. Chin et al.22 made use of the number of mutual neighbouring vertices to form the main communities first, then they proposed some independent conditions as constraints of LPA, and utilised the constrained LPA to add the remainder vertices into communities. Finally, they used a vertex-moving strategy to refine the quality of the resulting community structure. Ding et al.23 introduced a modified label propagation algorithm, DCN, which employs the idea of Fdp algorithm43 and Chebyshev inequality to select community centres from the network first, then assigns their labels to their neighbours to form some seed regions, and updates the labels of the other vertices with the ones occurs most frequently in their own neighbours finally. For PPC, it combines the dynamic procedure – random walk in networks, and modularity-optimisation process together to divide networks into sub-networks iteratively. The authors stated that PPC can extract community structures from networks efficiently in approximately linear time complexity. Nevertheless, these lower-time-complexity algorithms have some deficiencies. For FastQ, it intends to optimise modularity though, its results are always trapped in suboptimal rather than optimal. For LPA series and PPC, almost all of them are non-deterministic algorithms, meaning that running each of them on the same network many times, the uncovered community structures might be different. These shortcomings reduce their practical utilities and limit them from being applied to some real-world applications. To sum up the above arguments, to extract high-quality and definite community structures quickly from networks is still a challenging problem. To put it in another way, we need community-detection methods do not consider the problem from the single perspective of either detecting efficiency or quality of the results only. To solve this problem, we propose a community detection method that takes both of the two factors into account. The most of significance of the present method is that it is a fast and deterministic method, which can reveal high-quality and definite community structures from networks with a complexity comparable with that of LPA or PPC. By analysing community structures carefully extracted from many networks, we observed that each vertex and most of its neighbours always belong to the same community, and that vertex and its neighbours in the same community form a small ‘cluster’, each community is composed of several small clusters. In each cluster, there always some vertex who has relative-larger degree than others, the cluster is a group of vertices associated with that vertex with relative-larger degree. This phenomenon is analogous to the voting behaviour in social systems. In the networks abstracted from social systems, there are always some influential individuals in local area, which might be leaders of departments, authorities in some fields, and so forth. If those individuals participate an election which allows nominating freely, every voter will vote for someone having larger influence around himself, with ties broken by selecting the closest one with himself. This procedure will result in many small clusters which is a vertex group surrounding the influential vertex with others. Motivated by this observation, we propose a method simulating the voting procedure to detect community structures from networks. In the presented method, we make some principles as voting rules, use the degree to reflect the influence of each vertex, and use the similarities between vertices to represent the closeness of them. That is to say, each vertex votes for one of its neighbours whose degree is larger than that of itself. If there are more than one larger-degree vertices having the same influence among its neighbours, the voter vertex votes for the one with the largest similarity with itself. In this way, each vertex votes quickly, and we will obtain many small vertex clusters at the end of voting procedure. According to the above analysis, each community consists of several clusters. Therefore, we take the clusters as initial communities, and merge some of them to construct the resulting community structure finally.
Results
We have tested the performance of our method on 9 networks, including 2 artificial networks synthesised using LFR benchmark network generator software44 and 7 real-world networks. The size of these networks spans from tens to hundreds of thousands of vertices, the statistical information of them are listed in Table 1. These networks can be divided into two categories, one is the two artificial networks and the first three real-world networks in ScieNtific ReporTS | (2018) 8:8064 | DOI:10.1038/s41598-018-26415-3
2
www.nature.com/scientificreports/ Network
Vertices
Edges
Communities
Reference
LFR_1000
1000
15135
16
—
LFR_5000
5000
47368
57
—
Dolphin
62
159
4
45
Risk map
42
83
6
48
Scientists collaboration
118
197
6
8
Email
1133
5451
—
49
PGP
10680
24316
—
50
DBLP
317080
1049866
—
51
Amazon
334863
925872
—
51
Table 1. The statistical information of the networks involved in the experiments.
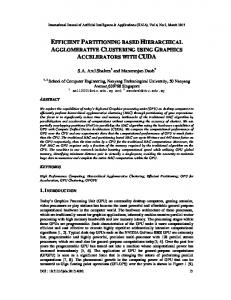
Figure 1. The artificial networks. (a) The community structure extracted from the synthetic network containing 1000 vertices, which is generated by setting the key parameter μ = 0.5 in the LFR benchmark network generator software. (a) The result uncovered from the artificial network containing 5000 vertices, which is synthesised using the same software with μ = 0.6.
Table 1, in which the ground-truth community structures are already known. The other is the last four ones in Table 1, which are also real-world networks however have no acknowledged ground-truth community structures. Below, we analyse in detail each of the community structures extracted from the first category of networks individually, and compared the results extracted by our proposal from all 9 networks with those of some popular algorithms.
Synthetic networks. The two artificial networks are both synthesised using LFR benchmark network generator software44, which works with some parameters tuning the properties of generated networks. For the first artificial network, the parameters are set as follows: the vertex number are 1000; the average and maximum degree of vertices are 30 and 50, respectively; both the vertex degree and the community size distributions obey power laws, and the exponent of them are −2 and −1, respectively; the minimum and maximum community sizes are 30 and 100, individually; the mixing parameter μ is 0.5. For the second artificial network, it contains 5000 vertices, the average and maximum degree of vertices are 20 and 100, respectively; the power-law-distribution exponents are also −2 and −1, respectively; the minimum and the maximum community contain 50 and 150 vertices, respectively; and μ is 0.6. For this software, μ is a key parameter, which controls for each vertex the fraction of edges connected to vertices located in other communities. These parameter settings yield the two artificial networks in which the communities are not well-separated one another, so that they can serve well as benchmarks to test the detecting ability of our proposed method. The resulting community structures identified from them by our proposed method are illustrated in Fig. 1, in which each pixel represents an edge, the rectangle areas along the diagonal are corresponding to detected communities. Obviously, the edges inside each of the rectangles are much denser than others, which is consistent with the characteristic of communities. Real-world networks. The dolphins social network was compiled by David Lusseau et al.45, who observed
and studied the behaviour of 62 bottlenose dolphins living in Doubtful Sound, New Zealand for 7 years. The vertices in this network represent the dolphins, and edges associate dolphin pairs being observed co-occurring frequently. The 62 vertices and 159 edges can be partitioned into 4 groups as the ground-truth community structure, as shown in Fig. 2(a). Taken this network as the input, the proposed algorithm extracted the result as shown in Fig. 2(b). Although, some of the vertices are misclassified, the presented method distilled the mainframe of community structure, 4 communities are identified from the network, and the majority of the vertices are classified into the communities correctly. ScieNtific ReporTS | (2018) 8:8064 | DOI:10.1038/s41598-018-26415-3
3
www.nature.com/scientificreports/
Figure 2. The dolphin social network. (a) The ground-truth community structure. (b) The community structure detected by our proposed method. The different vertex shapes and colours indicate different communities, the intra-community edges are plotted as black lines, and the inter-community ones are in grey. This illustration style also applies to the next figures.
Figure 3. The network corresponding to a map of game Risk. (a) The ground-truth community structure. (b) The community structure extracted by the proposed method.
The Risk map network is a map loaded in the popular game Risk. It is a map of the Earth, involving 42 territories as vertices, and 83 edges connecting territories which are adjacent. The vertices are naturally partitioned into six communities, corresponding to the six continents in the Earth, which is illustrated in Fig. 3(a). The community structure extracted by the proposed method is as presented in Fig. 3(b). Although, this is a small network, it contains some special vertices, e.g., vertices labelled as ‘12’, ‘16’, ‘26’, the edges associated to them are incident to different communities almost equally, which increases the difficulty of classifying those vertices correctly. Therefore, several community-detection methods can not deal with them well, and tend to introduce misclassification around them36. However, our proposed method classified these special vertices correctly, and identified 7 communities from the network. Compared to the ground truth in Fig. 3(a), the two communities located at the right top of the panel in Fig. 3(b) are not merged into one due to the larger value of modularity of the extracted result. This can be verified by Table 2, the modularity of the ground-truth community structure is 0.621, and the modularity corresponding to the extracted result is 0.634, the latter is larger than the former, and the latter is also the largest value among the competitors. The scientists collaboration network is the largest component of a network depicted the co-author relationship among scientists working at the Santa Fe Institute, New Mexico, it contains 118 vertices and 197 edges. According to the speciality of the scientists involved, the vertices can be classified into 6 groups. Therefore, this network contains 6 communities naturally, which is shown in Fig. 4(a). The community structure revealed by the proposed method is as exhibited in Fig. 4(b), from which we can see that our proposed method detected community structure from this network with a high degree of success as well, only 2 vertices were misclassified in the incorrect community, it approaches the ground truth mostly.
ScieNtific ReporTS | (2018) 8:8064 | DOI:10.1038/s41598-018-26415-3
4
www.nature.com/scientificreports/ network LFR_1000 LFR_5000 Dolphin Risk map Scientists collaboration
measure
ground truth FastQ
LPA
LPAm
PPC
Attractor
IsoFdp
proposal
Q
0.43
0.326
0.385
0.404
0.356
0.36
0.41
0.356
NMI
1.00
0.671
0.752
0.89
0.924
0.902
0.941
0.925
Q
0.38
0.275
0.122
0.149
0.271
0.197
0.308
0.342
NMI
1.00
0.345
0.304
0.368
0.501
0.536
0.649
0.776
Q
0.519
0.491
0.503
0.497
0.519
0.495
0.466
0.522
NMI
1.00
0.733
0.837
0.744
0.812
0.691
0.629
0.783
Q
0.621
0.625
0.624
0.567
0.621
0.623
0.519
0.634 0.945
NMI
1.00
0.894
0.848
0.888
0.803
0.834
0.714
Q
0.739
0.749
0.681
0.587
0.751
0.707
0.62
0.739
NMI
1.00
0.867
0.799
0.704
0.877
0.857
0.775
0.968
Table 2. The experimental results on the first category of networks, the quality of the extracted community structures are measured in terms of modularity (Q) and normalised mutual information (NMI). The largest values are typed in bold.
Figure 4. The collaboration network of scientists working at the Santa Fe Institute (Colour on-line). (a) The ground-truth community structure. (b) The community structure identified by the proposed method.
Comparison with other methods. To test the performance of our proposed method, we ran it on the 9
networks, and compared the results to those of 6 popular algorithms, namely FastQ15,16, LPA20, LPAm21, PPC26, Attractor28 and IsoFdp41. The first four of them have been discussed previously, which motivated the proposed method to some extent. Attractor is a community detection method utilising distance dynamics. It takes the network as an adaptive dynamical system, in which vertices interact one another. The interaction might make a change on distances among vertices, and the change of distance will affect the interaction in reverse. Such interplay will make vertices belonging to the same community move together step by step, and vertices in different communities depart farther away from each other gradually. IsoFdp is a community detection method based on manifold learning and density-based clustering, which exploits IsoMap46 to map the network data into a lower dimensional manifold first, and then extracts communities by clustering the mapped vertices using Fdp algorithm43. For the first category of networks, we measure the quality of extracted community structures in terms of modularity (Q)9 and normalised mutual information (NMI)47. And for the second categories, we use the modularity as the measure only due to the absence of acknowledged ground-truth community structures. The comparison results on the two categories of networks are recorded in Tables 2 and 3, respectively. To illustrate the results more intuitively, we also plot the metric values as the bar charts in Figs 5 and 6, respectively. We can see that on the first category of networks, either Q or NMI or both of them obtained by the proposal are the largest. When measured using Q, our proposed method ranked the first on four of the networks, except on the scientists collaboration network only. When considering from the perspective of NMI, the proposed method achieved the largest value from three of the networks. On the other two networks, it still acquired the second and third largest NMI values, respectively. Other algorithms obtained better value of Q or NMI occasionally, i.e. Q of PPC from the scientists collaboration network, NMI’s of IsoFdp from the LFR_1000 network and LPA from the dolphin social network. On the second category of networks, all of the values of Q acquired by our method are the largest. PPC and FastQ can also get the relative larger value of modularity from these networks, because they are both originated from modularity optimisation. LPAm and IsoFdp cannot manage to get a result from DBLP network and Amazon network, due to the larger size of the two networks; and LPAm cannot obtain a result even from the PGP network, which is only in ten-thousands-scale of vertices. It is mainly because that LPAm needs to calculate the modularity for each update of the vertex label in each iteration, which is a time-consuming work. For Attractor, it can get the definite results from all of these networks, but the obtained modularities are not so satisfactory. These results demonstrate that the proposed method can steadily extract high-quality community structures effectively from networks, and outperforms the comparison algorithms significantly. ScieNtific ReporTS | (2018) 8:8064 | DOI:10.1038/s41598-018-26415-3
5
www.nature.com/scientificreports/ network
FastQ
LPA
LPAm
PPC
Attractor
IsoFdp
proposal
Email
0.507
0.283
0.366
0.546
0.48
0.531
0.547
PGP
0.852
0.804
—
0.869
0.771
0.745
0.878
DBLP
0.728
0.683
—
0.796
0.633
—
0.8
Amazon
0.879
0.785
—
0.901
0.78
—
0.926
Table 3. The experimental results on the second category of networks, the quality of the obtained results are measured using the modularity (Q). The largest value are typed in bold.
Figure 5. The metric values obtained from the first category of networks by the proposal and comparison algorithms. (a) The bar chart of the modularity (Q). (b) The bar chart of NMI.
Figure 6. The bar chart of the modularity (Q) metrics obtained from the second category of networks.
Discussions
The network involved in this paper is the undirected and unweighted graph, which can be denoted as G = (V, E), where V and E are vertex set and edge set, respectively. The proposed method detects communities mainly from networks by simulating the voting behaviours in elections allowing nominating freely, the voting rules are of great importance to the detecting procedure. In the detecting procedure, each vertex u ∈ V votes following the rules below: 1. If vertex u has been nominated as a candidate, or u has the largest degree among its neighbours, then u votes for itself. 2. Otherwise, we pick out the vertex whose degree is larger than that of u from the neighbours of u and denote it as v. If there are more than one such vertices, the one which is the most similar to u is selected and denoted as v. We denote the similarity between u and v as sim(u, v). If sim(u, v) = 0, then u nominates itself as a candidate and votes for itself. 3. Otherwise, if v has not voted for other vertices, then u nominates vertex v as a candidate and votes for v. 4. If vertex v has voted for another vertex w, that is to say v gives up its privilege being nominated as a candidate, then vertex u votes for w as well.
ScieNtific ReporTS | (2018) 8:8064 | DOI:10.1038/s41598-018-26415-3
6
www.nature.com/scientificreports/ According to the above voting rules, the voting order of vertices can have influence on the order of vertices being nominated as candidates, so that different voting orders may lead to different results. In the presented method, we calculate the clustering coefficient for each vertex in the network, and have the vertices voted in the ascending order of their clustering coefficients. For any vertex v ∈ V , its clustering coefficient is defined as the ratio of the number of existed edges to the number of all possible edges in the neighbourhood of v, and can be calculated as cc(v ) =
|{(u , w )|u ∈ N (v ), w ∈ N (v ), (u , w ) ∈ E}| , |N (v )| ⋅ (|N (v )| − 1)
(1)
where, N (v ) = {u|(u , v ) ∈ E, u ∈ V } is the neighbour set of vertex v. For a given vertex v, the larger the number of existed edges among its neighbours, the larger the clustering coefficient of v. If the sub-graph consisted of the neighbours of vertex v is a complete graph, cc(v) reaches its maximum, 1. However, it is unlikely that the neighbourhood sub-graph for any vertex in a sparse network is a complete graph, especially for vertices with larger degrees. In another word, the clustering coefficient for a vertex with larger degrees is always small. Therefore, voting in the ascending order of clustering coefficients of vertices can nominate the vertices with larger degrees as candidates earlier, then surround them with their neighbours to construct clusters. According to the voting rule 2, if there are more than one vertex whose degree is larger than that of vertex u in the neighbourhood of vertex u, we use the similarity between those vertices and u to determine which one should be voted for by u. Therefore, the similarity between vertices plays an important role in the voting procedure as well. In the proposed method, we calculate the similarity between vertex u and v as follows, sim(u , v ) =
| N (u ) ∩ N (v )| . | N (u ) ∪ N (v )| − 2
(2)
Because vertices u and v may be contained in N (u) ∪ N (v ), but not in N (u) ∩ N (v ), we subtract 2 in the denominator, so that sim(u, v) falls in the range of [0,1]. After voting, we can get a series of small clusters. However, these clusters are not the resulting communities. We know from the aforementioned observations that a final community can include several such clusters. Therefore, we take these clusters as initial communities, and consider to merge some of them to erect the resulting communities. In pursuit of high quality of the result, we only consider the pairs of communities whose similarity is larger than 0. In the experiments, we calculate the similarity between a pair of communities, Ci and Cj, as follows,
(
) u∑C v∑C sim(u, v).
SIM Ci , Cj =
∈
i
∈
j
(3)
Methods
The proposed method consists of two phases in logical. The first phase is the voting procedure which yields several small clusters, and the second is the merging phase to take the small clusters as initial communities, and merge some of them into larger ones to erect the resulting community structure. The framework of the method is listed as Algorithm 1. Algorithm 1. Voting Simulation based Agglomerative Hierarchical community detection method.
The function ‘voting()’ is corresponding to the voting procedure, in which each vertex in the network votes for the vertex with larger influential in its neighbourhood following the voting rules described in section ‘Discussions’, the logic is presented as the pseudo-code listed in Algorithm 2, and its output is some small clusters. These small clusters are not the final communities, on the contrary, one community can be comprised of several such clusters. Therefore, we take the small clusters as initial communities, and function ‘merge()’ is responsible for merging some of the communities to construct the resulting community structure. In pursuit of efficiency, we borrowed the idea from FastQ15 algorithm, and employed the similar strategy to join a pair of communities whose merge can lead to the largest modularity increment in each iteration when we implemented the function. According to ref.15, the increment of modularity by joining communities Ci and Cj is ∆Qij = 2(eij − ai aj ), where eij is the proportion of inter-edges between Ci and Cj to total edges in the network, ai and aj are the ratio of edges incident to vertices located in Ci and Cj to total edges in the network, respectively, i.e., the modularity increment can be calculated quickly. The pseudo-code of the merge procedure is listed in Algorithm 3. And this function outperforms FastQ in some ways. This merge process gets started from the status that each small cluster is taken as an initial community, rather than from the status of each vertex being a community,
ScieNtific ReporTS | (2018) 8:8064 | DOI:10.1038/s41598-018-26415-3
7
www.nature.com/scientificreports/ which means that the joining times needed here is far less than that of FastQ. In addition, because merging the dissimilar communities may undermine the quality of resulting community structure, we add the consideration of only merging the two communities whose similarity is larger than 0 in each iteration, and the calculation of similarity between two communities is defined as equation (3) in section ‘Discussions’. And moreover, we can terminate the joining procedure earlier when there is no similarity between any pair of communities larger than 0, rather than repeat the joining operation until all vertices are in the same community. In this way, the merge process here works with a high efficiency.
Complexity Analysis. For an algorithm, it is advantageous if it has a lower time complexity, so that it can be
applied to large-scale networks, which are ubiquitous in the big-data era, now. Our proposed method consists of two phases, the first phase is to obtain the initial communities by simulating the voting procedure. This task can be accomplished in O(md + n log n), where n and m are the number of vertices and edges in the network, respectively; d is the average degree of vertices. The second phase is to acquire the final communities by merging some of the initial communities, and has a cost time complexity O(mk), where k is the merging-iteration times, and k n, Algorithm 2. The logic of function voting (G).
ScieNtific ReporTS | (2018) 8:8064 | DOI:10.1038/s41598-018-26415-3
8
www.nature.com/scientificreports/ Algorithm 3. The logic of function merge (G, CS_init).
d < k in general cases. Therefore, the total time consumption of our method is O(md + n log n + mk) ∼ O(mk), or O(nk) in sparse networks. As a result, the proposed method can be efficiently applied to large-scale networks, which can be manifested to some extent by the experimental results.
References
1. Kleinberg, J. & Lawrence, S. The structure of the web. SCIENCE 294, 1849–1850 (2001). 2. Chen, P. & Redner, S. Community structure of the physical review citation network. Journal of Informetrics 4, 278–290, http://www. sciencedirect.com/science/article/pii/S1751157710000027, https://doi.org/10.1016/j.joi.2010.01.001 (2010). 3. Guimerà, R. & Amaral, L. A. N. Functional cartography of complex metabolic networks. Nature 433, 895–900 (2005). 4. Ravasz, E., Somera, A. L., Mongru, D. A., Oltvai, Z. N. & Barabási, A.-L. Hierarchical organization of modularity in metabolic networks. Science 297, 1551–1555 (2002). 5. Lewis, A., Jones, N., Porter, M. & Deane, C. The function of communities in protein interaction networks at multiple scales. BMC Systems Biology 4, 100 (2010). 6. Satuluri, V., Parthasarathy, S. & Ruan, Y. Local graph sparsification for scalable clustering. In Proceedings of the 2011 ACM SIGMOD International Conference on Management of Data, SIGMOD 11, 721–732 (ACM, New York, NY, USA, 2011). 7. de Lange, S., de Reus, M. & Van Den Heuvel, M. The laplacian spectrum of neural networks. Frontiers in Computational Neuroscience 7 (2014). 8. Girvan, M. & Newman, M. E. J. Community structure in social and biological networks. Proceedings of the National Academy of Sciences 99, 7821–7826 (2002). 9. Newman, M. E. J. & Girvan, M. Finding and evaluating community structure in networks. Phys. Rev. E 69, 026113 (2004). 10. Gleiser, P. M. & Danon, L. Community Structure In Jazz. Advances in Complex Systems (ACS) 6, 565–573 http://ideas.repec.org/a/ wsi/acsxxx/v06y2003i04p565-573.html, (2003). 11. van Gennip, Y. et al. Community detection using spectral clustering on sparse geosocial data. SIAM Journal of Applied Mathematics 73, 67–83 (2013). 12. Nematzadeh, A., Ferrara, E., Flammini, A. & Ahn, Y.-Y. Optimal network modularity for information diffusion. Phys. Rev. Lett. 113, 088701, https://doi.org/10.1103/PhysRevLett.113.088701 (2014). 13. Ren, G. & Wang, X. Epidemic spreading in time-varying community networks. Chaos: An Interdisciplinary Journal of Nonlinear Science 24, 023116, https://doi.org/10.1063/1.4876436 (2014). 14. Zhou, T., Zhao, M., Chen, G., Yan, G. & Wang, B.-H. Phase synchronization on scale-free networks with community structure. Physics Letters A 368, 431–434, http://www.sciencedirect.com/science/article/pii/S0375960107005981. https://doi.org/10.1016/j. physleta.2007.04.083 (2007). 15. Newman, M. E. J. Fast algorithm for detecting community structure in networks. Phys. Rev. E 69, 066133 (2004). 16. Clauset, A., Newman, M. E. J. & Moore, C. Finding community structure in very large networks. Phys. Rev. E 70, 066111 (2004). 17. Zarandi, F. D. & Rafsanjani, M. K. Community detection in complex networks using structural similarity. Physica A: Statistical Mechanics and its Applications 503, 882–891 http://www.sciencedirect.com/science/article/pii/S0378437118303066. https://doi. org/10.1016/j.physa.2018.02.212 (2018). 18. De Meo, P., Ferrara, E., Fiumara, G. & Provetti, A. Generalized Louvain method for community detection in large networks. In ISDA ‘11: Proceedings of the 11th International Conference on Intelligent Systems Design and Applications http://www.emilio.ferrara.name/ wp-content/uploads/2011/07/isda2011-k-path.pdf (2011). 19. De Meo, P., Ferrara, E., Fiumara, G. & Provetti, A. Mixing local and global information for community detection in large networks. J. Comput. Syst. Sci. 80, 72–87, https://doi.org/10.1016/j.jcss.2013.03.012 (2014). 20. Raghavan, U. N., Albert, R. & Kumara, S. Near linear time algorithm to detect community structures in large-scale networks. Phys. Rev. E 76, 036106 (2007). 21. Barber, M. J. & Clark, J. W. Detecting network communities by propagating labels under constraints. Phys. Rev. E 80, 026129 (2009).
ScieNtific ReporTS | (2018) 8:8064 | DOI:10.1038/s41598-018-26415-3
9
www.nature.com/scientificreports/ 22. Chin, J. H. & Ratnavelu, K. Detecting community structure by using a constrained label propagation algorithm. PLOS ONE 11, 1–21, https://doi.org/10.1371/journal.pone.0155320 (2016). 23. Ding, J., He, X., Yuan, J., Chen, Y. & Jiang, B. Community detection by propagating the label of center. Physica A: Statistical Mechanics and its Applications 503, 675–686 http://www.sciencedirect.com/science/article/pii/S0378437118302632. https://doi.org/10.1016/j. physa.2018.02.174 (2018). 24. van Dongen, S. Graph Clustering by Flow Simulation. Ph.D. thesis, University of Utrecht (2000). 25. Su, Y., Wang, B. & Zhang, X. A seed-expanding method based on random walks for community detection in networks with ambiguous community structures. Scientific Reports 7, 41830, https://doi.org/10.1038/srep41830 (2017). 26. Tabrizi, S. A., Shakery, A., Asadpour, M., Abbasi, M. & Tavallaie, M. A. Personalized pagerank clustering: A graph clustering algorithm based on random walks. Physica A: Statistical Mechanics and its Applications 392, 5772–5785 (2013). 27. Hu, Y., Li, M., Zhang, P., Fan, Y. & Di, Z. Community detection by signaling on complex networks. Phys. Rev. E 78, 016115, https:// doi.org/10.1103/PhysRevE.78.016115 (2008). 28. Shao, J., Han, Z., Yang, Q. & Zhou, T. Community detection based on distance dynamics. In Proceedings of the 21th ACM SIGKDD International Conference on Knowledge Discovery and Data Mining, KDD ––15, 1075–1084 https://doi.org/10.1145/2783258.2783301, (ACM, New York, NY, USA, 2015). 29. Chen, L., Zhang, J., Cai, L. & Deng, Z. Fast community detection based on distance dynamics. Tsinghua Science and Technology 22, 564–585, https://doi.org/10.23919/TST.2017.8195341 (2017). 30. Sun, H. et al. A fast community detection method in bipartite networks by distance dynamics. Physica A: Statistical Mechanics and its Applications 496, 108–120 http://www.sciencedirect.com/science/article/pii/S0378437117313481. https://doi.org/10.1016/j. physa.2017.12.099 (2018). 31. Chauhan, S., Girvan, M. & Ott, E. Spectral properties of networks with community structure. Phys. Rev. E 80, 056114, https://doi. org/10.1103/PhysRevE.80.056114 (2009). 32. Li, Y., He, K., Bindel, D. & Hopcroft, J. E. Uncovering the small community structure in large networks: A local spectral approach. In Proceedings of the 24th International Conference on World Wide Web, WWW 15, 658–668 http://dl.acm.org/citation. cfm?id=2736277.2741676. (International World Wide Web Conferences Steering Committee, Republic and Canton of Geneva, Switzerland, 2015) 33. Cheng, X. & Shen, H. Uncovering the community structure associated with the diffusion dynamics on networks. Journal of Statistical Mechanics: Theory and Experiment 2010, P04024 (2010). 34. Newman, M. E. J. Spectral methods for community detection and graph partitioning. Phys. Rev. E 88, 042822 (2013). 35. Newman, M. E. J. Community detection and graph partitioning. EPL (Europhysics Letters) 103, 28003 http://stacks.iop.org/02955075/103/i=2/a=28003 (2013). 36. Cheng, J. et al. A divisive spectral method for network community detection. Journal of Statistical Mechanics: Theory and Experiment 2016, 033403 (2016). 37. Shi, P., He, K., Bindel, D. & Hopcroft, J. Local lanczos spectral approximation for community detection. In Proceedings of ECMLPKDD (2017). 38. Krzakala, F. et al. Spectral redemption in clustering sparse networks. Proceedings of the National Academy of Sciences 110, 20935–20940 (2013). 39. Newman, M. E. J. Spectral community detection in sparse networks. CoRR abs/1308.6494, http://dblp.uni-trier.de/db/journals/ corr/corr1308.html#Newman13a (2013). 40. Singh, A. & Humphries, M. D. Finding communities in sparse networks. Sci. Rep. 5, https://doi.org/10.1038/srep08828 (2015). 41. You, T., Cheng, H.-M., Ning, Y.-Z., Shia, B.-C. & Zhang, Z.-Y. Community detection in complex networks using density-based clustering algorithm and manifold learning. Physica A: Statistical Mechanics and its Applications 464, 221–230, http://www. sciencedirect.com/science/article/pii/S0378437116304563. https://doi.org/10.1016/j.physa.2016.07.025 (2016). 42. Wang, X., Liu, G., Li, J. & Nees, J. P. Locating structural centers: A density-based clustering method for community detection. PLOS ONE 12, 1–23, https://doi.org/10.1371/journal.pone.0169355 (2017). 43. Rodriguez, A. & Laio, A. Clustering by fast search and find of density peaks. Science 344, 1492–1496, http://science.sciencemag.org/ content/344/6191/1492. https://doi.org/10.1126/science.1242072 (2014). 44. Lancichinetti, A., Fortunato, S. & Radicchi, F. Benchmark graphs for testing community detection algorithms. Phys. Rev. E 78, 046110 (2008). 45. Lusseau, D. et al. The bottlenose dolphin community of doubtful sound features a large proportion of long-lasting associations. Behavioral Ecology and Sociobiology 54, 396–405 (2003). 46. Tenenbaum, J. B., Silva, V. d. & Langford, J. C. A global geometric framework for nonlinear dimensionality reduction. Science 290, 2319–2323, http://science.sciencemag.org/content/290/5500/2319. https://doi.org/10.1126/science.290.5500.2319 (2000). 47. Ana, L. N. F. & Jain, A. K. Robust data clustering. In 2003 IEEE Computer Society Conference on Computer Vision and Pattern Recognition, 2003. Proceedings., vol. 2, II–128–II–133 vol. 2 (2003). 48. Steinhaeuser, K. & Chawla, N. V. Identifying and evaluating community structure in complex networks. Pattern Recognition Letters 31, 413–421, http://www.sciencedirect.com/science/article/pii/S0167865509003043, https://doi.org/10.1016/j.patrec.2009.11.001 (2010). 49. Guimerà, R., Danon, L., Daz-Guilera, A., Giralt, F. & Arenas, A. Self-similar community structure in a network of human interactions. Phys. Rev. E 68, 065103, https://doi.org/10.1103/PhysRevE.68.065103 (2003). 50. Boguñá, M., Pastor-Satorras, R., Daz-Guilera, A. & Arenas, A. Models of social networks based on social distance attachment. Phys. Rev. E 70, 056122, https://doi.org/10.1103/PhysRevE.70.056122 (2004). 51. Yang, J. & Leskovec, J. Defining and evaluating network communities based on ground-truth. In Proceedings of the 2012 IEEE 12th International Conference on Data Mining, ICDM 12, 745–754, https://doi.org/10.1109/ICDM.2012.138 (IEEE Computer Society, Washington, DC, USA, 2012).
Acknowledgements
This work was partially supported by the Fundamental Research Funds for the Central Universities, China (grant ID: lzujbky-2017-sp24, lzujbky-2017-192), program of Hui-Chun Chin and Tsung-Dao Lee Chinese Undergraduate Research Endowment, CURE (grant ID: LZU-JZH1923), the Open Funds of Gansu Resources and Environmental Science Data Engineering Technology Research Centre (2015), and the Young Scientists Fund of the National Natural Science Foundation of China (grant ID: 61602225).
Author Contributions
J.J.C. and X.Y.C. conceived the idea and designed the research. J.J.C., X.H.Y., H.J.Y. and Q.L. conducted the experiments. J.J.C., L.J.L. and M.W.L. discussed the results and wrote the manuscript text. All authors reviewed the manuscript.
ScieNtific ReporTS | (2018) 8:8064 | DOI:10.1038/s41598-018-26415-3
10
www.nature.com/scientificreports/
Additional Information
Competing Interests: The authors declare no competing interests. Publisher's note: Springer Nature remains neutral with regard to jurisdictional claims in published maps and institutional affiliations. Open Access This article is licensed under a Creative Commons Attribution 4.0 International License, which permits use, sharing, adaptation, distribution and reproduction in any medium or format, as long as you give appropriate credit to the original author(s) and the source, provide a link to the Creative Commons license, and indicate if changes were made. The images or other third party material in this article are included in the article’s Creative Commons license, unless indicated otherwise in a credit line to the material. If material is not included in the article’s Creative Commons license and your intended use is not permitted by statutory regulation or exceeds the permitted use, you will need to obtain permission directly from the copyright holder. To view a copy of this license, visit http://creativecommons.org/licenses/by/4.0/. © The Author(s) 2018
ScieNtific ReporTS | (2018) 8:8064 | DOI:10.1038/s41598-018-26415-3
11