KSCE Journal of Civil Engineering (2012) 16(1):29-37 DOI 10.1007/s12205-012-1496-6
Construction Management
www.springer.com/12205
A Multi-objective Linear Programming Framework for Evaluating the Financial Viability of Supplementary Facilities in Build-Transfer-Lease Projects in Korea Wooyong Jung*, Bonsang Koo**, and Seung Heon Han*** Received February 28, 2011/Revised March 21, 2011/Accepted April 4, 2011
···································································································································································································································
Abstract Since 2005, the Build-Transfer-Lease (BTL) scheme has been successful in delivering projects such as schools and government housing to the general public while relieving the fiscal constraints of the Korean government. Recently, the inclusion of ‘supplementary’ facilities to the main BTL project has been posited as an alternative solution to increase a BTL project’s rate of returns. However, the absence of a structured approach to evaluate the financial viability of this modified scheme has thus far made its use restrictive. Determining the viability of the modified scheme requires identifying the relative project size of the supplementary facility and the appropriation of the additional revenue between the government and concessionaire that ensure that both parties benefit, while accounting for the increased risk in liquidity. This research proposes a framework using multi-optimization linear programming and Monte Carlo simulation that determines the optimal size of the supplementary facility and the appropriate revenue distribution ratio that minimize government payments and maximize the internal rate of return, while maintaining positive project cash flows. A retrospective case study on a military housing project demonstrates that using the proposed framework enables the addition of a shopping mall which increases the overall rate of return while minimizing the risks of the project. Keywords: public private partnerships, build-transfer-lease, financial risk management, multi-objective optimization ···································································································································································································································
1. Introduction The use of Public Private Partnerships (PPP) to finance public infrastructure projects has been increasing worldwide in recent years. From 2003 to 2008, 99 developing countries have applied PPP to more than 1,300 infrastructure projects worth US $477 billion (World Bank, 2010). PPP has provided a new option for governments under fiscal constraints in developing their infrastructure needs while achieving Value for Money through private sector efficiency and innovation. Although many forms of PPP schemes exist, most are categorized broadly as an end-user based fee or a lease-based government payment scheme (Ahmed et al., 2007; Garvin, 2010; Kwak et al., 2009b; Miller, 1995). In the end-user fee based scheme, private sponsors build a facility and retrieve their investment by collecting a fee for a given period from its end users, i.e., the general public. This scheme relies on a steady stream of revenue (e.g., toll fees), and is mainly used for transportation infrastructure including roads, railways and ports, etc. In the lease-based scheme, the private sector builds a facility and retrieves their investment via annual government lease payments over a specified period of time. The scheme is used when a fee cannot be collect-
ed from the general public, and is utilized for social infrastructure facilities. Even if end-users fees exist, the latter scheme is preferred when the government wishes to minimize the risk involved in the delivery of a given project. For example, recent adopters of PPP such as China and India have preferred lease-based schemes for road projects, because end-user based revenue streams are deemed unreliable (Boeing and Kalidindi, 2006; Chen, 2009; Chen et al., 2006). Western countries such as the U.S., U.K., France, and Australia have also increased the use of lease-based schemes, called unitary or availability payments, as they have found that projected end-user fees are often over-optimistic and create liquidity problems (Aziz, 2007; Daube et al., 2008; Garvin, 2010; Treasury, 2007). A downside of the lease-based scheme is that the rate of return is typically modest, as there is less risk than an end-user based fee scheme. Korea has also adopted lease-based schemes in the form of Build-Transfer-Lease (BTL). Introduced in 2005, it has been to date successfully used in delivering public schools and housing on time and under budget. Recently, however, several BTL projects solicited by the government have been stalled or postponed (Choi, 2007; MPB, 2007). Severe competition between bidders
*Member, Post-doctoral Fellow, Dept. of Civil and Environmental Engineering, Yonsei University, Seoul 120-749, Korea (E-mail:
[email protected]) **Member, Assistant Professor, Dept. of Civil Engineering, Seoul National University of Science and Technology, Seoul 139-743, Korea (Corresponding Author, E-mail:
[email protected]) ***Member, Professor, Dept. of Civil and Environmental Engineering, Yonsei University, Seoul 120-749, Korea (E-mail:
[email protected]) − 29 −
Wooyong Jung, Bonsang Koo, and Seung Heon Han
in a recessed construction market combined with a global financial crisis has contributed in considerably lowering the rate of return on BTL projects. Current reports show an average of 6-7% margin of return, whereas loan interest rates from Korean commercial banks average 7-8% (Choi, 2007). The major financial institutions have been increasingly reluctant to finance these projects, as it has become an unattractive investment option. One solution to improve the rate of return is the inclusion of ‘supplementary’ facilities in BTL projects. In this modified scheme, which we call ‘BTL+s’ projects, the government permits the concessionaire to build facilities independent of the main facility from which the concessionaire can generate additional revenue. This revenue is then partially used to recoup the private sector’s initial investment, as an alternate income to government lease payments. This scheme potentially benefits both parties, as it reduces the annual lease payments for the government while improving the rate of return for the private sector. Kwak et al. (2009a) used simulation to show that in theory, such projects can improve the rate of return. Countries such as the U.K. also allow supplementary projects as a method to generate “third party revenues” (H.M. Treasury, 2007). However, the Korean government has been thus far reluctant to endorse the adoption of BTL+s projects, and several requests by the private sector have been rejected. Reasons for this include the government’s perception that the scheme increases the risk of the project as a whole, as it relies on unreliable revenues. But such perceptions are biased and not subjected to a rigorous evaluation. Deciding to implement the modified scheme requires determining the appropriate size of the supplementary facility and the reasonable allocation of the additional revenue that equally benefits the government and the concessionaire. The absence of a structured way to conduct such analysis has contributed in the restricted adoption of BTL+s projects. This research addresses this need by formulating a method for evaluating the financial viability of BTL+s projects. The framework defines two ratios, the ‘Supplementary to Main Size Ratio’ (SMSR) and the ‘Supplementary Revenue Distribution Ratio’ (SRDR). These respectively represent the relative cost of the supplementary project and the relative amount of the supplementary revenue shared between the government and concessionaire. Using multi-optimization linear programming and Monte Carlo simulation, the framework provides a Pareto optimal set of SMSR and SRDR pairs that minimize government payments, maximize the rate of return for the concessionaire, while ensuring the Debt Service Coverage Ratio (DSCR) requirements are met. A retrospective case study on a military housing project is performed to demonstrate that an optimally structured BTL+s scheme increases the solvency and attractiveness of an existing BTL project. The first section provides an overview of the PPP scheme in Korea, and the recent circumstances involving the adoption of BTL+s projects. The second section discusses the specific evaluation framework and method used to formulate the solution. The last section discusses the details and findings of the case study.
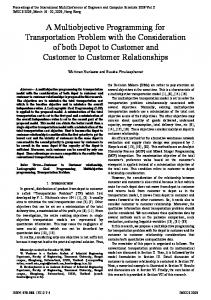
2. Research Background for the BTL+s Scheme 2.1 Public Private Partnerships (PPP) Scheme in Korea Korea introduced PPP with the enactment of the ‘Promotion of Private Capital Investment into Social Overhead Capital (SOC) Act’ in August of 1994 (MOGL, 2010a). This act provided the first comprehensive legal framework for mutual collaboration between the government and the private sector in delivering public infrastructure projects. The act was centered around transportation infrastructure, in effect enabling the implementation of BuildTransfer-Operate (BTO) projects. The act was revised in December of 1998 with the ‘Private Participation in Infrastructure Investment Act’, in which the government expanded support measures and risk sharing mechanisms (MOGL, 2010b). The Amendment of PPP Act in January of 2005 further enlarged the scope of PPP projects to include social infrastructure (schools, healthcare, culture & sports, etc.) and in effect enabled the use of the BuildTransfer-Lease (BTL) scheme for such facilities (MOGL, 2010c). To date, the PPP act allows 46 types of facilities as eligible for PPP, and 461 projects (BTO 292, BTL 169) has been awarded as of September of 2009. In 2008, PPP investment accounted for 18% of the Nation’s total infrastructure budget (MOSF, 2009). 2.2 BTL Project Delivery Process In the BTL scheme, private sponsors build a facility through its own investment, transfer ownership of the facility to the government upon completion, obtain the right of operating and maintaining the facility, and recover the investment via government lease payments over a specified period of time. BTL projects are relatively less of risks compared to BTO projects, because a stable flow of annual income is generated in the form of annual lease payments from the government. Consequently, the government sets the rate of return in BTL projects typically lower than BTO projects. Also, the BTL scheme is preferred to a Build-Lease-Transfer (BLT) in Korea. In the latter scheme, the concessionaire has to pay property taxes during the concession period as ownership is not transferred during this time. Figure 1 describes the process of initiating and implementing a BTL project. All PPP projects, regardless of the specific scheme, first go through a Value for Money (VFM) Test, in which the PPP model is compared to a Public Sector Comparator (PSC). If VFM is larger than 1, and is approved by the National Assembly, the project is designated as a PPP project. The Public and Private Infrastructure Investment Management Center (PIMAC), a government subsidiary designated by the Ministry of Strategy and Finance (MOSF) announces Request for Proposals (RFP’s). The private sector, which typically is a consortium of construction companies, banks and Operation & Maintenance (O&M) companies, submits project proposals. A third party committee formed by PIMAC (i.e., competent authority) evaluates and selects a preferred bidder. The committee then negotiates the contract details with the preferred bidder and once the contract terms are agreed, the project is awarded hence with to the ‘concessionaire.’
− 30 −
KSCE Journal of Civil Engineering
A Multi-objective Linear Programming Framework for Financial Evaluation of Supplementary Facilities in Korean BTL Projects
have also been reported and duly cautioned in the U.K. (Treasury, 2007b). Finally, the government also has to contend with the negative perception from Non-Government Organizations (NGO’s) that perceive the selected concessionaire as unduly “profiteering” from a public project. Hence, the government’s reluctance to endorse supplementary projects is to a degree understandable. A BTL+s scheme needs to be carefully evaluated and structured to minimize the increased risks while improving the overall profitability of the project. However, current decisions are ad hoc and based on subjective perceptions, without a thorough or objective framework. This has resulted in the loss of opportunities in which the BTL+s scheme is viable and has the potential to increase the rate of the return for the overall project.
3. Evaluation Framework
Fig. 1. Implementation Procedure for a Build-Transfer-Lease (BTL) Project
Negotiation topics include financial requirements such as equity to capital ratio, loan and bond obligations and construction and concession periods. The inclusion and conditions of supplementary facilities is also negotiated. The concessionaire submits a detailed implementation plan following the negotiation, and is given the rights to construction and operation for the specified period (MOSF, 2009). 2.3 Associated Risks for BTL+s Projects As discussed, a BTL+s scheme extends the original BTL scheme to include the construction of independent (i.e., supplementary) facilities from which additional revenue can be generated and shared between the government and the concessionaire. Ideally, this benefits both parties: the government can pay less for the cost of the facility, and the concessionaire can increase the rate of return of the project. However, the scheme also increases the potential risks of the project. The concessionaire is deemed responsible for meeting the projected revenues it proposes using the added facility. The government does not provide any guarantees if losses are incurred. Compared to a steady stream of stable annual lease payments from the government, such revenues are susceptible to the volatility of the real estate market. In addition, to win the bid, a bidder has a tendency to make optimistic projections for the additional revenue. If actual revenues fall short and the concessionaire defaults, the government has to buy out the facility, and may end up with a facility in debt. In the worst case, it can also negatively affect the successful delivery of the main facility. This is a scenario that the government wants to avoid as ultimately it fails in providing the general public of its needs. Similar situations of over-estimating third party revenue Vol. 16, No. 1 / January 2012
3.1 Critical Factors and Objective Function As stated, two factors govern the viability of BTL+s projects. These include the relative size (in terms of gross floor area of a facility) of the supplementary facility in relation to the original project, and secondly, the determination of distribution of the generated revenue between the government and the concessionaire. The first factor is important because it determines the absolute amount of additional revenue to be generated. The second factor is important because it determines how this revenue is to be divided between the primary parties. Thus, these factors are defined as ratios to be used in the proposed evaluation framework. The first ratio, SMSR, is the ratio between the size (i.e., gross floor area) of the supplementary facility in relation to the size (i.e., gross floor area) of the main project. The larger the supplementary facility (i.e., the higher the SMSR), the more likely it is to generate more revenue. This is advantageous for both parties, as it will reduce annual Government Payments (GP), and generate more profits and thus a higher rate of return (IRR) for the concessionaire. However, it also increases the risk of default if projected forecasts are not realized and too much of the income is relied on this revenue. The second ratio, SRDR, is the relative amount of the supplementary revenue that is distributed between the government and the concessionaire. Government Payments (GP) will be reduced as this ratio is increased, while the rate of return (IRR) decreases for the concessionaire. However, if the ratio is so large as to leave no substantial profit for the concessionaire, then the incentive to build a supplementary facility is lost. On the other hand, if the ratio is too small, it may give the concessionaire inordinately high profits, leaving the government with little or no reduction in annual lease payments. Thus, the ratios SMSR and SRDR determine the GP and IRR of a BTL+s project. An optimal solution then will be a pair of SMSR and SRDR that minimizes Government Payments (GP), while maximizing the rate of return (IRR) for the concessionaire. This can be formulated as the following objective function:
− 31 −
Wooyong Jung, Bonsang Koo, and Seung Heon Han
Minimize GP = f (SMSR, SRDR) Maximize IRR = f (SMSR, SRDR)
(1) (2)
The objective function must meet several constraint conditions. First and foremost, if a BTL+s project is implemented, its performance should always be better than the original BTL project. Otherwise, there is no point in the addition of the supplementary facility. Thus, the GP from a BTL+s project should always be smaller than that of a “standalone” BTL project. Similarly, the IRR from a BTL+s project should always be higher than that of a standalone BTL project. These constraints are denoted as: GPBTL + s < GPBTL IRRBTL + s > IRRBTL
(3) (4)
SMSR and SRDR are ratios and thus are values between 0 and 1. 0 < SMSR < 1 0 < SRDR ≤ 1
(5) (6)
An SMSR of 0 means that no supplementary project exists, thus SMSR needs to be at least larger than 0. A SMSR of 1 means that the size of the supplementary facility is equal to the size of the main facility. It is not likely for a supplementary facility to be larger than the main facility and this restriction is currently stipulated in the Amendment of PPP Act in Korea (MOGL, 2010). An SRDR of 1 means that additional revenue from the supplementary project is returned in its entirety to the government, whereas a value of 0 means that the revenue is fully occupied by the concessionaire. The granularity (i.e., incremental spacing) for these variables is determined on a project-specific basis. A high level of granularity will provide finer solutions but also dramatically increases the solution space and thus computational simulation time. 3.2 Debt Service Coverage Ratio (DSCR) A particular concern in a BTL+s project is the increased risks in the project becoming insolvent due its reliance on revenue susceptible to market fluctuations. Hence, it is critical to ensure that the Debt Service Coverage Ratio (DSCR) remains positive during the concession period. The DSCR determines whether a project during a given period is able to maintain a healthy positive cash flow, pay off its short-term loans and thus avoid project illiquidity. Indeed, together with Net Present Value (NPV and IRR, DSCR is one of the three basic components in financial cash flow analysis (Yescombe, 2002). The DSCR is also distinguished between the average DSCR(DSCRavg) and minimum DSCR(DSCRmin). DSCRavg is the average of the annual DSCR’s over the lifespan of the project. Thus a certain lower limit usually between 1 and 1.5 is set for BTL projects, depending on the volatility of a specific project (Bakatjan et al., 2003). DSCRmin, on the other hand, identifies the minimum DSCR during the given project period. Whereas DSCRavg may be higher than the specified limit, there may be specific periods where the project is especially in danger of low cash flow. This is particularly true for
BTL+s projects during the construction and initial first few years of the concession period. The supplementary facility in its initial stages will not have been entirely sold or rented out and thus the concessionaire can be strapped for cash. As discussed, the BTL+s scheme is by nature more risk prone than BTL projects. Thus, in similar fashion to the constraints defined in equations (3) and (4), DSCRavg and DSCRmin are also restricted to be higher than the limits of a BTL project. These constraints are defined as follows: DSCRavg DSCRmin
> DSCRavg BTS + s > DSCR min
BTL + s
(7) (8)
BTL BTL
3.3 Equations for Evaluating a BTL+s Project Existing financial equations defined in the Amendment of PPP Act (MOGL, 2010c) are adopted and modified to include the newly variables SMSR and SRDR. Equation (9) defines the relationship between the annual Total Project Cost (TPC), Government Payments (GP), Operating Revenue (OR) and Operating Cost (OC) of a BTL+ s project. TPCi GPi + ORi – OCi = Σin=+nN+ 1 ------------------------------------Σin= 1 -----------------------( i + rBTL + s ) ( i + rBTL + s )
(9)
where TPCi=total project cost at year i; GPi=government payment at year i; ORi= operating revenue from supplementary facility at year i; OCi= operating cost for supplementary facility at year i; rBTL+s=internal rate of return for a BTL+s project; n = completion time of facility; and N=concession period in years. We need to customize the individual terms of Eq. (9) to account for the supplementary project. The Total Project Costs (TPCi) for a BTL+s project needs to account for the costs of the main facility as well as the supplementary facility. The cost of the supplementary facility is accounted for using the ratio SMSR and is calculated using the following equation. TPC = ( eΣin= 1 Ai Πki = 1 ( 1 + θk ) + ( 1 – e ) ( Σ in= 1 Ai ( 1 + rl )
( 1 + cc * SMSR )
T–i
Πki = 1 ( 1 + θk ) ) )
(10)
where Ai=aggregate cost for ith year of construction in a BTL project; θk = escalation rate for the kth year e=equity to capital ratio; T=construction period in years; and rl=loan interest rate. cc=cost coefficient. The cost coefficient, cc, represents the relative costs differences depending on the type of the supplementary facility. That is, a commercial facility such as a shopping mall typically has a higher cost per floor area than a public housing project. This coefficient needs to be determined on a project-specific basis. Aggregate construction costs (Ai) is further divided into detailed costs (i.e., inspection, design, construction, Miscellaneous costs, etc.) as shown in Table 1. The amount of Government Payments (GP) is determined by subtracting the amount of additional revenue that will be returned to the government from the annual total project cost. Thus using the ratio SRDR, it is calculated as follows:
− 32 −
KSCE Journal of Civil Engineering
A Multi-objective Linear Programming Framework for Financial Evaluation of Supplementary Facilities in Korean BTL Projects
Table 1. Independent Variables and their Probability Distributions Classification
Operating Revenue (ORi)
Operating Cost (OCi) Debt service coverage ratio (DSCR)
GPi = Σin= 1 ⎛ TPCi ( 1 + rBTL ) ⎝
Notation
Probability Distribution
Inspection Cost
A1i
Uniform
Rate proportional to Construction Cost Rate proportional to Construction Cost
Design Cost
A2i
Uniform
A3i
Lognormal
Miscellaneous Cost
A4i
Uniform
Rate proportional to Construction Cost
Tax related Cost
A5i
Uniform
Rate proportional to Construction Cost
Start up Cost
A6i
Uniform
Rate proportional to Construction Cost
Equity to Capital Ratio
e
NA
Set by the government
Inflation Rate
θk
Lognormal
rl
Lognormal
Cost Coefficient
cc
NA
Sample data calculation (Local Real Estate Data)
Internal Rate of Return
rBTL
NA
Set by the government (Government bond + α)
Rent per Unit Area
RUAn
Lognormal
Sample data fitting (Local Real Estate Data)
Deposit per Unit Area
DUAn
Lognormal
Sample data fitting (Local Real Estate Data)
Sample data fitting (KOSIS, 2010) Sample data fitting (MONETA 2010)
Interest Rate (Savings)
rs
Normal
Land Appreciation Rate
θl
Normal
Non-sale rate
NSRi
NA
Vacancy rate
VRi
Lognormal
Percentage ratio for OC
m
NA
Real Estate Transaction Registration Act (MOCT, 2006)
Equity to Capital Ratio
e
NA
Set by government
Tax
TAX
NA
Set by government
Depreciation
DEP
NA
Set by government
n–i
rTTL -⎞ – SRDRi ( ORi – OCi ) × -------------------------------–N 1 – ( 1 + rTBL ) ⎠
where rBTL=rate of return for a BTL project; SRDRi=supplementary revenue distribution ratio at year i. Operating revenue (ORi) from a supplementary facility is generated from rent and deposits per floor area. The total floor area is in turn limited by the ratio SMSR. The demand for the facility, that is the market conditions, is represented by the annual non-sales rate and vacancy rate. Thus, the OR for a BTL+s project is calculated as follows:
where RUAn=rent per unit area at the time of construction completion; DUNn=deposit per unit area at time of construction completion; rsi=interest rate of savings account at year i; ABTL=total floor area of BTL project; NSRn=non sales rate at year i; VRi= vacancy rate at year i; and θ j=land appreciation rate at year j. The Operating cost (OCi) is calculated as a percentage of the OR of the supplementary facility. The specific percentage depends on the type of facility and the risks involved in a specific project: (13)
where m= percentage of ORi As DSCR evaluates the cash flow of the project, cash inflow is
Sample data fitting (MONETA 2010) Sample data fitting (Local Real Estate Data) Conservative assumption Sample data fitting (MLTM, 2010)
calculated by subtracting taxes and depreciation costs from the total revenue. Cash outflow is represented by the total debt obligations amortized into annual debt installments. DSCR is then calculated by dividing cash inflow with cash outflow. DSCRavg and DSCRmin is then calculated using Eqs. (16) and (17). CPi + ORi – OCi – TAXi + DEPi DSCRi = -----------------------------------------------------------------------Di
(14)
N
ORi = ( RUAn + DUAn × rsi ) × SMSR * ABTL × ( 1 – NSRi ) × ( 1 – VRi ) × Πji = n + 1 ( 1 + θj ) (12)
Vol. 16, No. 1 / January 2012
Fellows (1996), Touran and Lopez (2006)
Interest Rate (Loan)
(11)
OCi = m × ORi
Data Source or Reference
Construction Cost Total Project Cost (TPCi)
Annual Government Payments (GPi)
Variables
rl ( 1 + ri ) Di = ( 1 – e ) × TPC × ------------------------N ( 1 + ri ) – 1
(15)
Σ1N DSCRi DSCRavg = ---------------------N
(16)
DSCRmin = Minimum ( DSCRi )
(17)
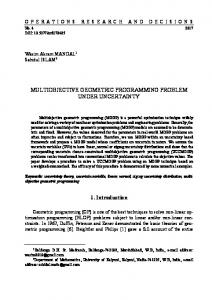
Where DSCRi=debt service coverage ratio for year i; TAXi=tax for the ith year; DEPi=depreciation for year i; Di=annual equal debt installment for year i. 3.4 Multi-objective Linear Programming and Monte Carlo simulation Figure 2 shows an IDEFΦ diagram for the proposed framework. Identifying pairs of SMSR and SRDR values that satisfy Eqs. (1) and (2) is a Pareto optimization problem and is solved using multi-objective linear programming. Monte Carlo simulation is also used to simulate the increased risks in a BTL+s project. That is, the independent variables through Eqs. (9) to
− 33 −
Wooyong Jung, Bonsang Koo, and Seung Heon Han
Fig. 2. IDEFΦ Diagram for the Evaluation Framework of a BTL+s Project
(17) are modeled as probability distributions that best represent their uncertainties. The specific distributions need to be determined on a project-specific basis. Monte Carlo simulation is performed at a 95% percent confidence interval with 5,000 repetitions. This framework was programmed in MATLAB version 7.10 (Attaway, 2009).
4. Case Study 4.1 Overview We performed a retrospective case study on a Military Housing project to demonstrate the value of the proposed framework. The project is a multi-complex project composed of a military residential housing, an office building, officer’s quarters, and a mixed development apartment (Kwak et al., 2009a). The project was budgeted at $42.075 million and construction was planned for 4 years, with a site area of 48,100 square meters. The government had set the concession period at 20 years, and the project was contracted under a BTL scheme. During negotiations, the concessionaire had requested that a shopping mall be built as a supplementary facility to the project. The site is located in the city and has good access to major roads. It is also only a 5-minute trip by car to local residential areas and has a subway station nearby. One of the complaints of the residents was the absence of a local commercial district. Thus, conditions were favorable to build a mall to be served as a central shopping location for the military personnel and existing residents. However, this request was denied as the government perceived the added facility to unnecessarily increase the risk of the project. Ultimately, the project was completed under a pure BTL scheme, and the IRR was reported at 6.48% (Kwak et al., 2009a). 4.2 Assumptions Several assumptions were made for the case study. First, SMSR and SRDR are simulated at increments of 0.05 between zero and one. This creates a solution space consisting of 400 pairs of SMSR and SRDR points. Secondly, the lower limit for DSCRavg is set at 1.36. The limit corresponds to a 5 percentile lower limit of
DSCRavg for the BTL project, which is typically 1.5 or higher (Bakatjan et al., 2003). Similarly, the lower limit of DSCRmin is set at 1.01. All solution pairs must meet both criteria. Thirdly, the probability distributions assumed for the independent variables of Eqs. (9) to (17) are provided in Table 1. Where project-specific data was available, we used the data fitting feature “BestFit” in MATLAB to identify the best distribution. Otherwise, we adopted distributions identified to be appropriate in previous research. Variables that are stipulated and fixed by the government were reflected accordingly. Finally for variables where these were not options, assumptions were defined conservatively. For example, we used a lognormal distribution for the inflation and interest rate for TPC. This was inferred by fitting data from average inflation and interest rate of the previous five years (KOSIS, 2010; MONETA, 2010). Annual construction costs (A3i) were not available to the public, thus we adopted a lognormal distribution used by Fellows (1996), and Touran and Lopez (2006). The Equity to Capital Ratio (e), was assumed at 25% during construction and 10% during the concession period, which is stipulated as the baseline in the Amendment of PPP Act (MOGL, 2010). The cost coefficient was set at 1.42, which represents the relative per square construction cost of regular housing to commercial buildings collected from the local area. Similarly, we collected data from local real estate agencies for commercial properties to data fit the variables for OR. The resultant data fitting for RUA, DUA, VR and land appreciation rates of OR resulted in lognormal and normal distributions, respectively. Data for NSR did not exist and thus we conservatively assumed that 25% of the lease space from the supplementary facility is not sold annually. This means that 25% of the space is not sold in the first year, 6.25% is not sold in the second year and 1.6% is not sold in the third year. This estimate is lower than other shopping districts in nearby areas. Finally, a percentage of 0.8 was used for ‘m’ to calculate the annual operating costs, OC. The percentage is based on the Real Estate Transaction Registration Act (MOCT, 2006), which stipulates a cap for real estate transaction and associated operating costs.
− 34 −
KSCE Journal of Civil Engineering
A Multi-objective Linear Programming Framework for Financial Evaluation of Supplementary Facilities in Korean BTL Projects
4.3 Simulation Results Figures 3 to 7 show the results of the simulations. The first four figures reveal the quantified relationships between the ratios SMSR SRDR versus the objective variables GP, IRR and DSCR. The final figure shows the results of the optimization. As shown in Fig. 3, Government Payments (GP) decrease as the SMSR and SRDR ratios increase (i.e., inversely proportional). Thus, ideally, the larger the facility and larger the SRDR enables government to pay less. In fact, at SMSR of 0.7 and SRDR of 0.5, the government does not need to make any lease payments whatsoever. However, DSCR limitations are not accounted for in this graph. Figure 4 shows that the Internal Rate of Return (IRR) increases as SMSR increases and SRDR decreases. However, the rate of increase of IRR dissipates as the SMSR increases, and thus is not linearly proportional. This is because the Non-Sales Rate (NSR) has been assumed to be proportional to the SMSR, and thus, the expected IRR decreases as not-enough lease space is sold. The Fig. 4 also shows that at maximum, with an SRDR of 0.25 and an
SMSR of 0.80, the IRR can be as high as 10.2%. Even with a conservative SRDR of 0.75 and SMSR of 0.2 can still achieve IRR of 6.7%, which are both higher than the 6.48% reported for the original BTL project. As discussed, strict DSCR values are required to ensure that the project retains a healthy cash flow and avoid project insolvency. Fig. 5 shows that DSCRavg first increases in similar fashion to the graphs of IRR then subsequently decreases. This is because as the size of the project gets larger, NSR and VR increases, and thus cash flow is affected negatively. Thus, the size and government payment negatively affect the liquidity of the project. Fig. 6 shows that DSCRmin displays similar behavior but is affected even more negatively than DSCRavg. Figure 7 shows the Pareto optimum solution. Unsatisfied points represent the failed pairs of SMSR and SRDR that do not meet the constraint conditions specified. Dominated points do satisfy the constraint conditions, but are dominated by the undominated points on the Pareto frontier. As a result, 112 points out of 400 candidate points satisfy the constraint conditions and of these 7
Fig. 3. Simulation Results for Government Payments (GP) in relation to SMSR and SRDR
Fig. 5. Simulation Results for DSCRavg in relation to SMSR and SRDR
Fig. 4. Simulation Results for Internal Rate of Return (IRR) in relation to SMSR and SRDR
Fig. 6. Simulation Results for DSCRmin in relation to SMSR and SRDR
Vol. 16, No. 1 / January 2012
− 35 −
Wooyong Jung, Bonsang Koo, and Seung Heon Han
ases, GP decreases and IRR increases. As SRDR increases, GP and IRR decreases. Thus, it helps the parties involved to better understand the relationships and impact of their decisions. Thirdly, it demonstrates that a BTL+s project does require a stricter and careful structure as it diminishes the liquidity of the project. As SMSR and SRDR increase, after a certain point DSCRavg and DSCRmin decrease to the point at which the project becomes illiquid. Finally, the framework provides a solution space that ensures both parties benefit from the added facility while ensuring that the outcomes are better than the initial BTL project. Thus the framework enables both parties to better understand their options and consequently make more informed decisions. Fig. 7. Simulation Results of SMSR and SRDR Pairs of Solutions (Pareto optimal for GP and IRR)
points are identified as Pareto optimal. Table 2 presents the detailed values of these 7 points. Of these solutions, Solution 1 (SMSR=0.45, SRDR=0.35) has the lowest GP of $22.9 million, and also the lowest IRR of 9.19%. Thus this solution is the most attractive for the government. Solution 7 (SMSR=0.85, SRDR=0.05) has the highest GP of $37.2 million and the highest IRR of 11.09%. This is the best solution for the concessionaire. Neither solution, however, has to be selected. Rather, it sets lower and upper boundaries. Given the particular situation and market conditions of the project, the government and private sector can negotiate from one of these solutions. It also shows that there is a difference of $14.3 million for GP and 1.90% for IRR, even within this boundary, which is not trivial. Thus without a given range, it may be very difficult to identify solutions that satisfy both parties. It is worthwhile to note that regardless of the solution selected, the IRR is always higher than the original BTL project. The lowest IRR is 9.19% of Solution 1 which is still higher than the actual IRR of 6.48%. In summary, the retrospective case study provides evidence of the power of the proposed framework. First, it shows that a set of solutions which perform better than the original BTL project does exist and can be found. Secondly, it clarifies and also quantifies the correlations between the ratios SMSR, SRDR and the objective variables GP and IRR. Specifically, as SMSR incre-
5. Conclusions This paper has presented a framework to evaluate the financial viability of BTL+s projects. The addition of a supplementary facility has the potential to increase the rate of return for BTL projects. To be successful, however, two factors, the relative cost of the supplementary project and the relative amount of the supplementary revenue shared between the government and concessionaire need to be properly evaluated. These two factors, defined as the ratios, SMSR and SRDR, has to be formulated in a way that ensures the government and private sector both benefit, while healthy cash flows are maintained. Multi-objective linear programming is used to identify a Pareto optimal set of SMSR and SRDR pairs that enable the government to minimize their annual lease payments while enabling the concessionaire to maximize their rate of return. Monte Carlo simulation is used to simulate the increased risks of the added supplementary facility, and the constraints such as DSCR requirements enable stricter evaluation of the liquidity of the project during a project’s lifespan. The retrospective case study provides evidence and advantages of using the proposed framework. The study shows that the relationships between the ratios SMSR, SMSR and the variables GP, IRR, and DSCR are complex and nonlinear. In addition, the study shows that even the range within the solution space can be significant. Thus, evaluation of a BTL+s project based on heuristics or guesswork has the likelihood of resulting in suboptimal
Table 2. Pareto Optimal Solutions for the Retrospective Case Study IRR (%)
DSCRavg
DSCRmin
Number
SMSR
SRDR
GP (M$)
median
5 percentile
median
5 percentile
median
1
0.45
0.35
22.9
9.19
7.70
1.55
1.39
1.16
1.02
2
0.50
0.30
23.8
9.63
8.11
1.57
1.40
1.17
1.02
3
0.60
0.25
23.8
10.146
8.60
1.58
1.41
1.16
1.01
4
0.65
0.20
26.3
10.58
9.01
1.60
1.43
1.16
1.02
5
0.70
0.15
29.4
11.03
9.47
1.62
1.45
1.17
1.03
6
0.80
0.10
32.5
11.54
9.91
1.62
1.45
1.16
1.01
7
0.85
0.05
37.2
11.09
10.41
1.65
1.48
1.17
1.02
standalone BTL
-
-
42.1
6.49
5.38
1.47
1.36
1.16
1.01
− 36 −
5 percentile
KSCE Journal of Civil Engineering
A Multi-objective Linear Programming Framework for Financial Evaluation of Supplementary Facilities in Korean BTL Projects
solutions that do not reveal the full spectrum of the possibilities of incorporating a supplementary facility. Care must be taken in forecasting the future revenues of the supplementary facility. As done in the case study, a conservative estimate must be made. Nevertheless, a large SMSR and SRDR will inevitably increase the risk of the project. Too heavy reliance on the supplementary facility to the point where it becomes the main source of revenue is not encouraged. Future research includes modeling revenue variability for different types of supplementary facilities (e.g., residential versus commercial), and incorporating the model into the evaluation model. Not all BTL projects should include a supplementary project as default. However, we have shown that a carefully structured BTL+s project is one way to increase the rate of return and provide the needed incentive for private sector participation. Revitalizing the attractiveness of BTL projects is imperative if Korea’s PPP enterprise is to continue to prosper. The government ultimately has the burden of delivering needed facilities to the general public, but cannot do so without private sector financing and innovation.
Acknowledgments This research was supported by the Korea Science and Engineering Foundation funded by the Ministry of Education, Science and Technology (2009-0081326).
References Ahmed, F. M. S., Miroslaw, J. S., and Ismail, B. (2007). “BOT viability model for large-scale infrastructure projects.” Journal of Construction Engineering and Management, Vol. 133, No. 1, pp. 50-63, doi: 10.1061/(ASCE)0733-9364(2007)133:1(50). Attaway, S. (2009). Matlab: A practical introduction to programming and problem solving, Elsevier Inc., UK. Aziz, A. M. (2007). “Successful delivery of public-private partnerships for infrastructure development.” Journal of Performance of Constructed Facilities, Vol. 21, No. 6, pp. 918-931, doi: 10.1061/ (ASCE)0733-9364(2007)133:12(918). Bakatjan, S., Arikan, M., and Tiong, R. L. K. (2003). “Optimal capital structure model for BOT power projects in Turkey.” Journal of Construction Engineering and Management, Vol. 129, No. 1, pp. 89-97, doi: 10.1061/(ASCE)0733-9364(2003)129:1(89). Boeing, S. L. and Kalidindi, S. N. (2006). “Traffic revenue risk management through annuity model of PPP road projects in India.” International Journal of Project Management, Vol. 24, No. 7, pp. 605613, doi: 10.1016/j.ijproman.2006.07.008. Chen, C. (2009). “Can the pilot BOT project provide a template for future projects? A case study of the Chengdu No. 6 Water Plant B Project.” International Journal of Project Management, Vol. 27, No. 6, pp. 573-583, doi: 10.1016/j.ijproman.2008.10.006. Chen, M. S., Lu, H. F., and Lin, H. W. (2006). “Are the nonprofit organizations suitable to engage in BOT or BLT scheme? A feasible analysis for the relationship of private and nonprofit sectors.” International Journal of Project Management, Vol. 24, No. 3, pp. 244-252, doi: 10.1016/j.ijpro man.2005.08.002.
Vol. 16, No. 1 / January 2012
Choi, S. J. (2007). “How to fiscally manage the BTL type project.” Korea Development Study of Korea Development Institute, Vol. 29, No. 1, pp. 137-175. Daube, D., Vollrath, S., and Alfen, H. W. (2008). “A comparison of project finance and the forfeiting model as financing forms for PPP projects in Germany.” International Journal of Project Management, Vol. 26, No. 4, pp. 376-387, doi: 10.1016/j.ijproman.2007.07.001. Garvin, M. J. (2010). “Enabling development of the transportation public-private partnership market in the United States.” Journal of Construction Engineering and Management, Vol. 136, No. 4, pp. 402-411, doi: 10.1061/(ASCE)CO.1943-7862.0000122. Korean statistical information service (KOSIS) (2010). Inflation index [online], Available from http://kosis.kr/gen_etl/start.jsp?orgId=101& tblId =DT_2KAA601&conn_path=I2&path= [cited 24 July 2010]. Kwak, S. N., Han, S. H., Soh, M., Jung, H., and Jung, W. (2009a). “Riskintegrated feasibility analysis model of BTL+BTO project.” J. Architecture Institute of Korea, Vol. 23, No. D, pp. 172-184. Kwak, Y. H., Chih, Y., and Ibbs, C. W. (2009b). “Towards a comprehensive understanding of Public Private Partnership (PPP) for infrastructure development.” California Management Review, Vol. 51, No. 2, pp. 51-78. Miller, J. B. (1995). Aligning infrastructure development strategy to meet current public needs, PhD Thesis, MIT, Cambridge, Mass. Ministry of Construction and Transportation (MOCT) (2006). Real estate transaction registration act, Korean Ministry of Construction and Transportation, Gwacheon, Korea. Ministry of Government Legislation (MOGL) (2010a). Act on promotion of private capital into social overhead capital investment [online], Available from http://www.law.go.kr/DRF/MDRFLawService.jsp? OC=mofe&ID=3750 [cited 24 July 2010]. Ministry of Government Legislation (MOGL) (2010b). Act on private participation in infrastructure [online], Available from http://www. law.go.kr/DRF/MDRFLawService.jsp?OC=mofe&ID=3750 [cited 24 July 2010]. Ministry of Government Legislation (MOGL) (2010c). Amendment of PPP Act [online], Available from http://www.law.go.kr/DRF/ MDRFLawService.jsp?OC=mofe&ID=3750 [cited 24 July 2010]. Ministry of Land, Transportation and Maritime Affairs (MLTM) (2010). Investigation of office investment profitability [online], Available from http://www.mltm.go.kr/USR/BORD0201/m_40/DTL.jsp?mode =view&idx=91149 [cited 24 July 2010]. Ministry of Planning and Budget (MPB) (2007). National finance operating plan from 2007 to 2016: Opening policy debates, MPB Hall in MPB in Republic of Korea. Ministry of Strategy and Finance (MOSF) (2009). Public finance plan for private investment [online], Available from http://pimac.kdi.re.kr/ law/investment_tab01.jsp?page=2 [cited 30 May 2010]. MONETA (2010). Available from http://finance.moneta.co.kr/?wlog_ mkt=FIN [cited 24 July 2010]. Treasury, H. M. (2007). Standardization of PFI contracts, The Stationery Office, London, U.K., ISBN: 978-1-84532-269-4. Touran, A. and Lopez, R. (2006). “Modeling cost escalation in large infrastructure projects.” Journal of Construction Engineering and Management, Vol. 132, No. 8, pp. 853-860, doi: 10.1061/(ASCE) 0733-9364(2006)132:8(853). World Bank. 2010 (2008). Globaldataset [online], Available from http:/ /ppi.worldbank.org/# [cited 30 May 2010]. Yescombe, E. R. (2002). Principle of project financing, Academic Press, Orlando.
− 37 −