BWM: Best Worst Method Jafar Rezaei Delft University of Technology, The Netherlands
[email protected]
www.bestworstmethod.com Challenge the future
1
MCDM problem • Decision-making is generally defined as the cognitive process of selecting an alternative from a set of alternatives. • A multi-criteria decision-making (MCDM) problem is a problem where a decision-maker has to find the best alternative from a set of alternatives considering a set of criteria.
www.bestworstmethod.com Challenge the future
2
MCDM problem (example 1) A shipper has to select the best port among a set of four ports: Le Havre (France); Antwerp (Belgium); Rotterdam (Netherlands); Hamburg (Germany)
Considering the criteria: • • • • •
Challenge the future
3
port efficiency port infrastructure location port charges interconnectivity
MCDM problem (example 2) A manufacturer has to select the best location for its central warehouse from a set of three alternative locations: Utrecht; Arnhem; Dordrecht
Considering the criteria: • • • • • • •
proximity to customers proximity to suppliers investment costs expansion possibility road connection rail connection water connection
www.bestworstmethod.com Challenge the future
4
MCDM problem (example 3) I want to buy a car from the following set:
Considering the criteria: • • • • •
price quality comfort safety style
www.bestworstmethod.com Challenge the future
5
MCDM problem (formulation) A discrete MCDM problem is generally shown as a matrix as follows: c1 c2 cn a1 p11 a p P 2 21 am pm1
p12 p22 pm 2
p1n p2 n pmn
where
a1 , a2 ,, am is a set of feasible alternatives (actions, stimuli), c1 , c2 ,, cn is a set of decision-making criteria, and pij is the score of alternative i with respect to criterion j. www.bestworstmethod.com Challenge the future
6
MCDM problem (goal) The goal is to select* the best (e.g. most desirable, most important) alternative (an alternative with the best overall value Vi ) (*other goals: rank, sort) n
Vi w j pij j 1
w j 0, w j 1
The scores p ij are collected from available data sources (if they are objective and available, e.g. price), or measured using qualitative approaches (e.g. Likert scale), or calculated similar to the weights of the criteria (if they are subjective, e.g. quality).
BWM is used to find the weights wj (other methods: SMART, AHP/ANP) www.bestworstmethod.com Challenge the future
7
BWM (pairwise comparison) BWM uses pairwise comparison* to find the weights (wj) of the criteria. • Pairwise comparison aij shows how much the decision-maker prefers criterion i over criterion j. • To show such preference, we may use Likert scales (e.g. very low … very high) with a corresponding numerical scale like: • 0.1, 0.2, …, 1 (0.1: equally important, …, 1: i is extremely more important than j). • 1, 2, …, 100 (1: equally important, …, 100: i is extremely more important than j). • 1, …,9 (1: equally important, …, 9: i is extremely more important than j).
* Thurstone, L.L. (1927). A law of comparative judgement. Psychological Review, 34, 278–286.
www.bestworstmethod.com Challenge the future
8
Steps of BWM: Step 1 • Determine a set of decision criteria. In this step, the decision-maker considers the criteria c1 , c2 ,, cn that should be used to arrive at a decision. For instance, in the case of buying a car, the decision criteria can be:
quality (c1 ), price(c2 ), comfort (c3 ), safety(c4 ), style(c5 ) It is clear that for different decision-makers, the set of decision criteria might vary.
1
2
... ...
n Challenge the future
9
Steps of BWM: Step 2 • Determine the best (e.g. the most important), and the worst (e.g. the least important) criteria. In this step, the decision-maker identifies the best and the worst criteria. No comparison is made at this stage. For example, for a particular decision-maker, price (c2 ) and style(c5 ) may be the best and the worst criteria respectively.
Best
1
2
... ...
n-2 Challenge the future
Worst 10
Steps of BWM: Step 3 • Determine the preference of the best criterion over all the other criteria using a number between 1 and 9 (or other scales). The resulting Best-to-Others (BO) vector would be:
AB aB1 , aB 2 ,, aBn where a Bj indicates the preference of the best criterion B over criterion j. For our example, the vector shows the preference of price (c2 ) over all the other criteria.
aB2
aB1
Best
1
aBw
aBn-2
2
... ...
n-2 Challenge the future
Worst 11
Steps of BWM: Step 4 • Determine the preference of all the criteria over the worst criterion using a number between 1 and 9 (or other scales). The resulting Others-to-Worst (OW) vector would be:
AW a1W , a2W ,, anW
T
where a jW indicates the preference of the criterion j over the worst criterion W. For our example, the vector shows the preference of all the criteria over style(c5 ) .
aB2
aB1
Best
1
aBw
aBn-2
... ...
2
Worst
n-2 Challenge the future
a1W
a2W
an-2W
12
Steps of BWM: Step 5
• Find the optimal weights w1* , w2* ,, wn*
The optimal weights for the criteria is the one where, for each pair of wB w j and w j wW ,we have wB w j aBj and w j wW a jW.. To satisfy these conditions for all j, we should find a solution wj w B where the maximum absolute differences a jW aBj and wj wW for all j is minimized.
www.bestworstmethod.com Challenge the future
13
Steps of BWM: Step 5, min-max To find the optimal weights, the following optimization model is formulated.
wj wB min max aBj , a jW j wW wj s.t.
w
j
1
(1)
j
w j 0, for all j
www.bestworstmethod.com Challenge the future
14
Steps of BWM: Step 5, Converted min-max Model (1) is converted to the following model.
min s.t.
wB aBj , for all j wj
wj wW
(2)
a jW , for all j
w
j
1
j
Solving Model(2), the optimal weights
w , w ,, w are obtained. * 1
* 2
* n
w j 0, for all j www.bestworstmethod.com Challenge the future
15
Consistency ratio: Definition • Definition . A comparison is fully consistent when aBj a jW aBW for all j, where a Bj , a jW , aBW are respectively the preference of the best criterion over the criterion j, the preference of criterion j over the worst criterion, and the preference of the best criterion over the worst criterion.
2
8
aBw aBj
Best
... ...
j
... ... ajW
4
www.bestworstmethod.com Challenge the future
Tallest (B)
j
Shortest (W)
16
Worst
Consistency ratio: A robust index As it is likely that we do not have the full consistency, we can calculate the level of consistency using a robust index called consistency ratio:
aBW
1
Consistency Index (max )
0.00 0.44 1.00 1.63 2.30 3.00 3.73 4.47 5.23
Consistency Ratio
2
3
4
5
6
7
8
9
* Consistency Index
Consistency ratio (CR) ∈ 0, 1 . The lower the CR the more consistent the comparisons, hence the more reliable results. A 𝐶𝑅 ≤ 0.25 is considered as a very high consistency level. www.bestworstmethod.com Challenge the future
17
BWM: post-optimality When we have more than 3 criteria AND a consistency ratio grater than zero, Model (2) has multiple optimal solutions. Solving the following two models the lower bound and the upper bound of the weights are obtained: min w j
max w j
s.t.
s.t.
wB a Bj * , for all j wj
wj wW
a jW , for all j
w
*
(3a)
wB a Bj * , for all j wj
wj wW
j
1
j
w j 0, for all j
a jW * , for all j
w
j
1
j
w j 0, for all j www.bestworstmethod.com Challenge the future
18
(3b) A decision-maker selects an optimal solution from the interval weights. This can be the center of the intervals, for instance.
Linear BWM, min-max
We can also minimize the maximum from the set wB aBj w j , w j a jW wW which results in the following model:
min max wB aBj w j , w j a jW wW j
s.t.
w
j
1
(4)
j
w j 0, for all j
www.bestworstmethod.com Challenge the future
19
Linear BWM, Converted min-max Model (4) is converted to the following model.
min L This is a linear model with a unique solution w1* , w2* ,, .wn* .
s.t.
wB aBj w j L , for all j w j a jW wW L , for all j
w
j
1
j
w j 0, for all j
(5)
L* is considered as a good indicator
of the consistency* of the comparisons.
(*note: the of Model (5) should not be divided by the consistency index values on page 17) L*
Model (5) is a good linear approximation of Model(2). www.bestworstmethod.com Challenge the future
20
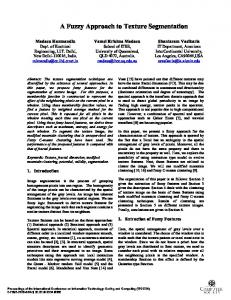
An example (buying a car) N For buying a car, a buyer considers five criteria: quality (c1), price (c2), comfort (c3), safety (c4), and style (c5). The buyer provides the following pairwise comparison vectors (BO: Best to Others; OW: Others to Worst). BO
Best criterion: Price OW Quality Price Comfort Safety Style
Quality 2
Price 1
Comfort 4
Safety 3
Style 8
Worst criterion: Style 4 8 4 2 1 www.bestworstmethod.com Challenge the future
R
H
21
An example (buying a car, Model (2)) Using Model (2) to solve the problem we have:
1 *
0.5 0.45
*
1 Consistency Ratio 0.22 Consistency Index 4.47
0.4 0.35
w1 0.1579, 0.2469 , w1 (center ) 0.2024 , w1 (width ) 0.0445
w 0.1429, 0.1644 , w (center ) 0.1536 , w (width ) 0.0108 3
3
3
w4 0.1111, 0.1579 , w4 (center ) 0.1345 , w4 (width ) 0.0234 w5 0.0476, 0.0548 , w5 (center ) 0.0512 , w5 (width ) 0.0036
weight
w2 0.4286, 0.4932 , w2 (center ) 0.4609 , w2 (width ) 0.0323
0.3 0.25 0.2 0.15 0.1 0.05 0 Quality
www.bestworstmethod.com Challenge the future
22
Price
Comfort
Safety
Style
An example (buying a car: Model (2)) N 1. Suppose we have a performance matrix as follows (10-pont scale; the higher the better): ql pr cm sf st N 8 6 5 8 8 P R 7 9 6 7 7 H 8 4 7 6 6
VN 8 0.2024 6 0.4609 5 0.1536 8 0.1345 8 0.0512 6.6382
2. And here are the weights we get from page 22 (center of the intervals): w* 0.2024, 0.4609, 0.1536, 0.1345, 0.0512
This car, with the highest overall score, is selected.
R
3. Then we can get the overall value of each car using the following function : VR 7 0.2024 9 0.4609 6 0.1536 7 0.1345 7 0.0512 7.7864
n
Vi w j pij j 1
H
If the alternative scores (performance matrix) are of from different scales (ton, euro, km) we first normalize the scores: 𝑥𝑘 , if x is positive (such as quality), ma x{ 𝑥𝑖 } 𝑛𝑜𝑟𝑚 𝑥𝑘 = 𝑥𝑘 1− , if x is negative such as price . ma x{ 𝑥𝑖 }
VH 8 0.2024 4 0.4609 7 0.1536 6 0.1345 6 0.0512 5.6522
www.bestworstmethod.com Challenge the future
23
An example (buying a car: Model (5)) N If we solve the problem using the Linear BWM (Model (5)) we get the following weights:
VN 8 0.246 6 0.431 5 0.154 8 0.123 8 0.046 6.676 Again, this car, with the highest overall score, is selected.
w* 0.246, 0.431, 0.154, 0.123, 0.046
R
With the following consistency ratio: VR 7 0.246 9 0.431 6 0.154 7 0.123 7 0.046 7.708
*L 0.061
H
As can be seen the weights are slightly different from the center of intervals, yet we come to the same best decision.
VH 8 0.246 4 0.431 7 0.154 6 0.123 6 0.046 5.784
www.bestworstmethod.com Challenge the future
24
Highlights • BWM is an easy-to-understand and easy-to-apply MCDM method. • BWM makes the comparisons in a structured way, which makes the judgment easier and more understandable, and more importantly leads to more consistent comparisons, hence more reliable weights/rankings. • The interval weights of BWM enables the decision-maker to choose a set of weights which are more consistent with his/her higherlevel information (e.g. in situations where debating has a role: e.g. in a political party). • The linear model can be used when flexibility is not desirable. • BWM needs less comparison data compared to some other MCDM methods (such as AHP). • BWM can be applied to different MCDM problems with qualitative and quantitative criteria. www.bestworstmethod.com Challenge the future
25
Want to know more!? For more information you may read these papers:
• Rezaei, J. (2015). Best-Worst Multi-Criteria Decision-Making Method, Omega, Vol. 53, pp. 49–57. • Rezaei, J. (2016). Best-worst multi-criteria decision-making method: Some properties and a linear model, Omega, Vol. 64, pp. 126-130. And visit this website: http://www.bestworstmethod.com Here you can also find the ways (such as an Excel Solver) you can solve your BWM problems. Or contact me:
[email protected] www.bestworstmethod.com Challenge the future
26