Since music will not necessarily be produced as albums, the construction of ... Many researchers have studied the music similarity prob- ..... ICASSP, 2001.
A MUSIC SIMILARITY FUNCTION BASED ON SIGNAL ANALYSIS Beth Logan and Ariel Salomon Compaq Computer Corporation Cambridge Research Laboratory One Cambridge Center Cambridge MA 02142 USA. ABSTRACT We present a method to compare songs based solely on their audio content. Our technique forms a signature for each song based on K-means clustering of spectral features. The signatures can then be compared using the Earth Mover’s Distance [1] which allows comparison of histograms with disparate bins. Preliminary objective and subjective results on a database of over 8000 songs are encouraging. For 20 songs judged by two users, on average 2.5 out of the top 5 songs returned were judged similar. We also found that our measure is robust to simple corruption of the audio signal. 1. INTRODUCTION The advent of MP3 and other compression algorithms is changing the world of music distribution. We are moving toward a future in which all the world’s music will be ubiquitously available. Additionally, the ‘unit’ of music has changed from the album to the song. Thus users will soon be able to search through vast databases at the song level. Since music will not necessarily be produced as albums, the construction of playlists will be important in future systems. Playlists should ideally list songs of a similar genre that ‘fit together’. In this paper, we study the playlist construction problem as the problem of quickly and automatically finding music similar to a favored query song. Thus we focus on the development of a technique to automatically determine music similarity. The traditional and most reliable technique of determining music similarity is by hand. This is clearly infeasible for large quantities of music. Collaborative filtering techniques are an alternative to solo hand-classification (e.g. [2]). These techniques produce personal recommendations by computing the similarity between one person’s preferences and those of other people. However, these methods
�
Ariel Salomon is a PhD student at Massachusetts Institute of Technology. The work for this paper was performed during an internship at Cambridge Research Laboratories.
cannot quickly analyze new music. Also, it may be difficult to obtain reliable information from users. Many researchers have studied the music similarity problem by analyzing MIDI music data, musical scores or using pitch-tracking to find a ‘melody contour’ for each piece of music. String matching techniques are then used to compare the transcriptions for each song (e.g. [3], [4], [5]). However, techniques based on MIDI data or scores are limited to music for which this data exists in electronic form. Also, only limited success has been achieved for pitch-tracking of polyphonic music [6] although recent results show much promise [7]. Other work has analyzed the music content directly. Blum et al. present an indexing system based on matching features such as pitch, loudness or Mel-frequency cepstral coefficients (MFCCs)[8]. Foote has designed a music indexing system based on histograms of MFCC features derived from a discriminatively trained vector quantizer [9]. In this paper, we build on the work of Foote to construct a distance measure between music based solely on the music content. We characterize songs using histograms of MFCC features but unlike Foote, the bins of our histograms are local to each song. This implies that the acoustic space for each song is efficiently ‘covered’ with adequate resolution where needed. Conversely if pre-determined bins are used, some songs may have all their information concentrated in one or two bins and important discriminating detail may be lost. Our technique has many similarities to an audio retrieval technique described in [10], although we use K-means clustering rather than Gaussian mixture models to characterize each song. We also study the problem of music retrieval rather than the speech-in-audio retrieval problem studied there. The organization of this paper is as follows. In Section 2 we describe our distance measure. We then describe how this can be incorporated into a playlist generation system. Next, we present results of experiments. Finally we present our conclusions and suggestions for future work.
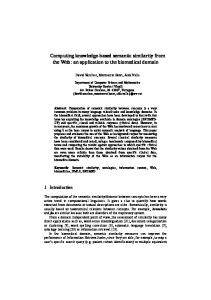
Figure 1: Top level diagram of the process of creating a signature for a song 2. SPECTRAL NOVELTY DISTANCE MEASURE Our distance measure captures information about the novelty of the audio spectrum. Conceptually, this corresponds to the type of instruments playing, including whether there is singing, which appears to be related to perceptual similarity. For each piece of music we compute a ‘signature’ based on spectral features. We then compare signatures using the Earth Movers Distance (EMD) [1]. 2.1. Obtaining the Spectral Signature The process to obtain a spectral signature for a piece of music is shown in Figure 1. The steps are as follows. We first divide the audio signal into frames. For each frame, we then obtain a spectral representation. Many representations are possible so long as a distance measure is available to compare one frame to another such that frames which sound similar are close to each other. In our implementation we use MFCCs (e.g. [11]). These features are prevalent in speech recognition applications. They are based on the discrete cosine transform of the log amplitude Mel-frequency spectrum and can be compared using the Euclidean distance measure. Other spectral measures might include using the amplitude spectrum directly or a representation based on MP3 coefficients. Given a sequence of transformed frames for a given song, we then cluster these frames into groups which are similar. The number of clusters may be fixed for every song, in which case standard K-means clustering can be used [12]. Alternatively, the number of clusters chosen can be dependent on the song (e.g. [13]). The set of clusters, characterized by the mean, covariance and weight of each cluster is then denoted the signature for the song. 2.2. Comparing Songs We obtain a spectral signature for every song of interest. These need only be calculated once and stored. We then compare the signatures for two different songs using the
EMD[1]. This distance measure can compare histograms with disparate bins. The EMD calculates the minimum amount of ‘work’ required to transform one signature into the other. Let be the first signature with clusters where and are the mean and covariance respectively of cluster and is the weight of that cluster. Similarly, let be the second signature. Let be the distance between clusters and . In our work, we compute this using a symmetric form of the Kullback Leibler (KL) distance. For clusters and this takes the form
��� ��� ��
�����
�����
����������������� �� ������ �% �� �!�� ����" ���% # $ �� ��� ��-% *, ����.*, ����������/� ( & ' � � � � + � , * � ) ���+*10/���-*102���.*103��#
�%5*76 4 &(' 8�9 & ' 89 �� �% �-*76 4 �% *76 � � * 6;: � %.: � �� �%=�+*76���?"@+AC� B %.: � B * 63D � (1)
�% *76 as the ‘flow’ between &(' and 8�9 . This flow Define E reflects the cost of moving probability mass (analogous to ‘piles % of earth’) from one cluster to the other. We solve for * 6 that all E minimize the overall cost F defined by F �HI'KJ=G LN9!I J=M L 4 % * 6 E % * 6 (2) subject to a series of constraints. That is, we seek the cheap� est way to transform signature to signature ) . This problem can be formulated as a linear programming
% * 6 , thetaskEMDfor which efficient solutions exist. Given all E is then calculated as OQPSR � � � ) � �UT G'VJ=L T 9!J=L 4 �%7*7 �6 % E *7 �6 % *76 � (3) T G'VJ=L TM 9!J=L E M 3. PLAYLIST GENERATION SYSTEM
In order to evaluate our distance measure, we have developed a system to generate playlists from given seed songs. We use an in-house database of over 8000 songs drawn from a wide range of styles. Each song in the database is labeled with the genre, song name, album name and artist name. The genre is one of the following: Blues, Celtic, Classical, Comedy, Country, Folk, Jazz, Newage, Rap, Rock, Soundtrack, Techno, Various Artists, Vocal, World. To our knowledge this represents one the largest databases used for published content-based music retrieval experiments. For each song, we compute a signature based on Kmeans clustering of frames of MFCCs. We start with audio sampled at 16kHz and divide this signal into frames of 25.6ms overlapped by 10ms. We then convert each frame to 40 Mel-spectral coefficients and take the logarithm and the discrete cosine transform to obtain 40 cepstral coefficients. Of these, only the first 13-30 are used. We disregard the
Nr. MFCC Features
Average distance between all songs
12 19 29
0.56 0.65 0.70
Average distance between songs on the same album 0.28 0.35 0.38
Nr. MFCC Features 12 19 29
Average number of songs in the same genre Closest 5 Closest 10 Closest 20 3.43 6.53 12.4 3.44 6.57 12.5 3.36 6.44 12.3
Table 2: Average number of closest songs with the same genre as the seed song
Table 1: Statistics of the distance measure zeroth cepstral coefficient which contains magnitude information. Finally, we cluster the sequence of cepstral coefficients into 16 clusters using standard K-means clustering. This set of clusters is the signature for the song. After computing the signature for every song, we then compute the distances between all songs using the EMD as described above. For a given seed song, the playlist is then returned as the closest songs. Clearly we could devise better schemes to determine the playlist, such as combining the scores from several query songs and incorporating user feedback. This is the subject of ongoing work.
W
4. EVALUATION Our evaluation focuses on the merit of our similarity measure rather than the overall quality of playlists returned. We report information retrieval metrics and other statistics.
Nr. MFCC Features 12 19 29
Average number of songs by the same artist Closest 5 Closest 10 Closest 20 1.13 1.72 2.46 1.17 1.80 2.59 1.16 1.80 2.64
Table 3: Average number of closest songs by the same artist as the seed song genre as the query song. Note that this result gives only an indication of the performance of our system since several of our genre categories overlap (e.g. jazz and blues) and songs from both categories might still be perceived as relevant by a human user. Tables 3 and 4 show similar results where relevance is defined as songs by the same artist and songs on the same album. From these tables we see that typically, around one song by the same artist or on the same album is one of the top 5 closest songs.
4.1. Distance Measure Statistics We first examine some general statistics of our distance measure. Table 1 shows the average distance between songs for the entire database over a range of different MFCC parameterizations. We also show the average distance between songs on the same album. Our measure is such that the distance between a song and itself is zero (i.e. we have a dissimilarity measure). From Table 1 we see that our measure correctly assigns a smaller distance to songs on the same album which we expect on average to be perceptually more similar than other songs in the database. 4.2. Objective Relevance
W
We now examine the ‘goodness’ or relevance of the top songs returned by our system in response to a query song. Because user tests are expensive and time-consuming, we first use objective tests to tune the parameters of our system and identify trends that are true on average over the whole database. We examine three objective definitions of relevance: songs of the same style, songs by the same artist and songs on the same album. For each song in our database, we analyze the closest 5, 10 and 20 songs returned. Table 2 shows the average number of songs returned by our system which have the same genre as the query song. We see that the majority of songs returned are of the same
4.3. Subjective Relevance From the above, it appears that 19 cepstral features give the best retrieval performance. We therefore conduct user tests with this configuration. Our tests compare a playlist generated by our system to a playlist generated at random from the same 8000 song database. Two independent users participated in the test. They were presented with playlists from 20 randomly selected songs. For each song, a randomly generated playlist and the playlist generated by our system was presented. Users were instructed to rate each song in the playlist as ‘similar’ or ‘not similar’ to the query song. Interestingly, both users naturally assumed audio similarity rather than say lyric similarity. There was good agreement between the users as to which songs were similar with only 12% of songs being rated differently. Nr. MFCC Average number of songs on the same album Features Closest 5 Closest 10 Closest 20 12 0.84 1.21 1.61 19 0.86 1.26 1.68 29 0.81 1.21 1.69 Table 4: Average number of closest songs on the same album as the seed song
Algorithm Random Proposed
Average Number of Similar Songs Closest 5 Closest 10 Closest 20 0.2 0.6 0.9 2.5 4.7 8.2
Table 5: Average number of similar songs in playlists generated at random and by our similarity measure as judged by 2 users on 20 queries Nr. MFCC Features 12 19 29
% of times original song returned within: Closest 1 Closest 5 Closest 10 98.8 99.2 99.3 99.8 100.0 100.0 97.2 97.6 97.8
Table 6: Percentage of times the original song is returned as one of the closest 1, 5 and 10 songs when the query is a clipped version of the original The average number of similar songs for the first 5, 10 and 20 songs in the playlists is shown in Table 5. Despite the preliminary nature of our tests, the results are very encouraging and confirm what we have noted in many informal tests. On average, 2.5 out of the top 5 songs returned were similar for our system as opposed to 0.2 out of 5 for a random playlist generator. 4.4. Robustness to Corruption Finally, we investigate the robustness of our distance measure to ‘clipping’ of songs. For all songs in our database, we remove a random section uniformly distributed between 0s and 30s from a randomly selected place in the song. We then calculate the signatures for each song as before. For each corrupted song, we use our measure to find the closest songs to this in the clean database. Ideally, the original version of each corrupted song should be the first song returned. Table 6 shows the percentage of times the original song is returned as one of the 1, 5 and 10 closest songs when the corrupted version is used as the query. We see that these numbers are quite high indicating that our distance measure has some robustness to this type of corruption. 5. CONCLUSIONS AND FUTURE WORK We have described a method to compare songs based solely on their audio content. We have evaluated our distance measure on a database of over 8000 songs. Preliminary objective and subjective results show that our distance measure preserves many aspects of perceptual similarity. For 20 songs judged by two users, we saw that on average 2.5 out of the top 5 songs returned are perceptually similar. We also saw that our measure is robust to simple corruption of the audio signal.
Ongoing work is focused in three main areas. First, we are still refining the parameters of our distance measure over all genres and investigating the effect of different clustering techniques to obtain the song signatures. Second, we are exploring the many heuristics that can be used to select the best playlist given a query song or songs. Finally, we are investigating the incorporation of other audio and non-audio based distance measures into our song selection scheme. 6. REFERENCES [1] Y. Rubner, C. Tomasi, and L. Guibas, “The Earth Mover’s Distance as a metric for image retrieval,” Tech. Rep., Stanford University, 1998. [2] “Workshop on collaborative filtering,” Proceedings, University of California at Berkeley, March 1996. [3] S. Blackburn and D. De Roure, “A tool for content based navigation of music,” in ACM Multimedia, 1998. [4] R. McNab, L. Smith, I. Witten, C. Henderson, and S. Cunningham, “Towards the digital music library: Tune retrieval from acoustic input,” in Digital Libraries 1996, 1996, pp. 11–18. [5] A. Ghias, J. Logan, D. Chamberlin, and B. Smith, “Query by humming,” in ACM Multimedia, 1995. [6] K. D. Martin, “Transcription of simple polyphonic music: Robust front end processing,” in the Third Joint Meeting of the Acoustical Societies of America and Japan, 1996. [7] M. Goto, “A predominant-F0 estimation method for CD recordings: MAP estimation using EM algorithm for adaptive tone models,” in Proc. ICASSP, 2001. [8] T. L. Blum, D. F. Keislar, J. A. Wheaton, and E. H. Wold, Method and article of manufacture for contentbased analysis, storage, retrieval, and segmentation of audio information, U.S. Patent 5, 918, 223, 1999. [9] J. T. Foote, “Content-based retrieval of music and audio,” in SPIE, 1997, pp. 138–147. [10] Z. Liu and Q. Huang, “Content-based indexing and retrieval by example in audio,” in ICME 2000, 2000. [11] L. R. Rabiner and B. H. Juang, Fundamentals of Speech Recognition, Prentice–Hall, 1993. [12] R. Duda, P. Hart, and D. Stork, Pattern Classification, John Wiley & Sons, 2000. [13] D. Pelleg and A. Moore, “X-means: Extending kmeans with efficient estimation of the number of clusters,” in ICML 2000, 2000.