A New Approach for Creating Customizable Cytoarchitectonic Probabilistic Maps Without a Template Amir M. Tahmasebi1 , P. Abolmaesumi1 , X. Geng2 , P. Morosan3 , K. Amunts4 , G.E. Christensen5 , and I.S. Johnsrude6 1
2
School of Computing, Queen’s University, Kingston, ON, Canada,
[email protected], Neuroimaging Research Branch, National Institute on Drug Abuse, NIH, USA, 3 Institute of Medicine, Research Center Juelich, Juelich, Germany, 4 Brain Imaging Center West, Germany, 5 Electrical and Computer Engineering, University of Iowa, USA, 6 Department of Psychology, Queen’s University, Kingston, Canada,
Abstract. We present a novel technique for creating template-free probabilistic maps of the cytoarchitectonic areas using a groupwise registration. We use the technique to transform 10 human post-mortem structural MR data sets, together with their corresponding cytoarchitectonic information, to a common space. We have targeted the cytoarchitectonically defined subregions of the primary auditory cortex. Thanks to the template-free groupwise registration, the created maps are not macroanatomically biased towards a specific geometry/topology. The advantage of the groupwise versus pairwise registration in avoiding such anatomical bias is better revealed in studies with small number of subjects and a high degree of variability among the individuals such as the post-mortem data. A leave-one-out cross-validation method was used to compare the sensitivity, specificity and positive predictive value of the proposed and published maps. We observe a significant improvement in localization of cytoarchitectonically defined subregions in primary auditory cortex using the proposed maps. The proposed maps can be tailored to any subject space by registering the subject image to the average of the groupwise-registered post-mortem images.
1
Introduction
Functional neuroimaging group studies usually involve a “normalization” step, in which brain image data from every subject are transformed to a common standard space. Such normalization compensates, at least in part, for the macroanatomical differences (sulci and gyri patterns) among individual brains within the group, with the expected consequence that the overlap of functional activation among subjects will be increased. However, function is determined more by the cyto-, myelo-, and connectional architecture of the brain [1, 2], than by the configuration of gyri and sulci, and these microanatomical characteristics do not
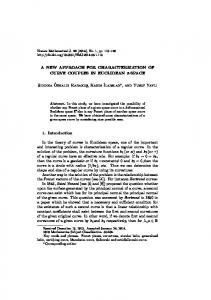
Fig. 1. Highlighted regions depicts Te1.0 (blue), Te1.1 (green), and Te1.2 (red) cytoarchitectonic subregions of the primary auditory cortex in a post-mortem brain.
necessarily align with macroanatomy [3]. Recent progress in human brain mapping has enabled observer-independent analysis of the cytoarchitecture of the cortex [4]. Integration of this detailed knowledge of microanatomy with functional observations seems a promising way forward for understanding the principles underlying functional organization in the brain [5]. A lack of information about intersubject microanatomical variability has been a major challenge in this endeavor. A common solution, given that microanatomical details are not easily obtainable from MR images, is the use of probabilistic maps of cytoarchitectonic data, derived from a number of post-mortem data sets registered to a standard stereotaxic space. To create a probability map, the structure of interest is first labeled in a group of individuals. Then, all the labeled volumes are transformed to a common space and overlapped to find the union of the labeled regions. Probability maps allow statistical assessment of the location of a particular region in any image that is being transformed to the spatial frame of the map. Moreover, they provide a way to predict the position of a functional activation focus and provide a method for analyzing data in an anatomically informed way (i.e., region-of-interest-based analysis). Maps of the motor and somatosensory cortices, auditory cortex, visual cortex, Broca’s region and others have already been published [1, 6] based on extensive and painstaking analysis of 10 post-mortem human brains (Juelich/Dusseldorf data sets). A list of available maps is given in [7]. In primary auditory cortex, Morosan and colleagues [8] developed maps of three subregions: Te1.0, Te1.1, and Te1.2, which all overlap with the anteriormost gyrus of Heschl (HG). Figure 1 shows the cross-sectional views for a post-mortem brain with the corresponding cytoarchitectonic labels of the three subregions. Morosan utilized an affine registration to transform the cytoarchitectonic labels to MNI space; however, due to intersubject anatomical variability of HG among the brains, the generated
probability maps are diffuse, with large overlaps between maps of adjacent regions. Recently, Bailey et al. [9] proposed deformable registration of these three cytoarchitectonic data sets in order to create maps tailored to particular individuals. In that method, the cytoarchitectonic subregions are locally warped to the gyrus of Heschl in the subject brain. However, this technique requires manual segmentation of HG in the subject image which is time consuming, subjective, and requires anatomical expertise. Furthermore, entirely new probability maps must be generated for each new brain image. The method proposed here is completely automatic, and the probability map created can then be warped to the space of any other brain image.
In this work, we present a new approach for creating cytoarchitectonic probabilistic maps for microanatomical subregions that can also be customized for a specific subject space. The proposed technique utilizes a groupwise deformable registration [10] to warp the 10 post-mortem brains as well as the corresponding cytoarchitectonic information to a common space (i.e., group space). The groupwise registration has the advantage of avoiding the anatomical bias introduced by choosing a specific template in typical pairwise registration frameworks. The effect of the template bias in the resulting probability maps becomes even more dramatic when using a small group of subjects (such as the post-mortem brains) as the resulting maps necessarily give high probabilities where the anatomy is similar to the template and low probabilities elsewhere. On the other hand, in a groupwise registration, every brain in the study is given equal probability of presence in the final map. The constructed probability maps using the proposed method can be further tailored to the anatomy of an individual subject by using a deformable registration between the average of the warped post-mortem data and the subject image.
We evaluate and compare the quality of the proposed probability maps using a leave-one-out (LOO) method [11]. Maps were created based on nine data sets, and used to ‘diagnose’ the auditory subregion in the excluded data set. True positive, false positive, false negative, and true negative voxels were measured, and the sensitivity, specificity and positive predictive value (PPV) of the maps were calculated. The same measures were calculated between the published maps and the labeled regions in the post-mortem brains, with the necessary difference that the published maps (created from all 10 data sets) also comprise the data that was used to evaluate them. Note that this biases our results away from our prediction (that the new maps are better). Repeated-measures ANOVAs were conducted on each of the diagnostic measures. The proposed maps yielded significantly higher PPV and specificity compared to the published maps, whereas the two map types did not differ in sensitivity. Furthermore, the overlap between probability maps for adjacent subareas was analyzed and compared between the proposed and published maps. There was significantly less overlap between every pair of maps created by the proposed method compared to the published maps.
Fig. 2. Overview of the proposed approach for creating customized cytoarchitectonic probability maps for primary auditory cortex subregions: Te1.0, Te1.1, and Te1.2.
2
Materials and Methods
Figure 2 demonstrates an overview of the proposed approach. As shown in the figure, the procedure consists of two major parts: (a) creating probabilistic maps in the group space; and (b) customizing the constructed maps for a specific subject brain. Both input data and the created outputs are in MNI space. The 10 post-mortem human brains used in this study are from previously published work [6]: serial coronal brain sections stained for cell bodies were quantitatively analyzed. An observer-independent method was used to determine the areal border for each subregion. Results were digitized and mapped onto high-resolution structural MR images of the same post-mortem brains, creating three-dimensional labeled volumes of cytoarchitectonic regions. These areas are called Te1.0, Te1.1, and Te1.2, and all overlap somewhat with Heschl’s gyrus. The post-mortem data was intensity-bias corrected using BrainSuite2 software7 to achieve intensity matching among the regions with similar tissue type. 2.1 Cytoarchitectonic Probabilistic Map in Group Space The post-mortem MR images were concurrently registered to a common space using implicit reference-based group (IRG) registration [10]. IRG is a recently developed groupwise registration technique that jointly estimates transformation from each image in the group to a “hidden” reference by optimizing the intensity difference of each pair of the deformed images. The intensity-bias correction step applied to the post-mortem data guarantees intensity matching between corresponding voxels of all images within the group. The cost function includes a similarity cost and a regularization constraint, defined as: C = Csimilarity + Creg where 7
BrainSuite2: http://brainsuite.usc.edu/.
(1)
Csimilarity =
XZ
k(Ii (hiR (x)) − Ij (hjR (x)))k2 dx
(2)
i,j
Ii represents the ith image in the group and hiR (x) is the transformation from image Ii to the implicit reference. Creg is a small deformation linear-elastic constraint [12] to penalize transformations with large and unsmooth distortion. The transformed images converge to the implicit reference during the IRG registration eliminating the bias associated with selecting a specific reference image. The algorithm assumes a small deformation linear elastic model and uses the Fourier series to parameterize the deformation field. A spatial and frequency multi-resolution procedure is used to estimate the full resolution transformations to avoid local minima. Next, the resulting deformation fields are used to transform the corresponding cytoarchitectural labels to the same group space. A probability map was constructed by averaging the 10 warped subregions. In order to customize the generated probability maps for a specific subject, one can use a deformable registration such as the normalization tool provided in SPM8 to transform the subject to the space of the average post-mortem brain or vice versa. When conducting a group study, it is recommended that the group average image be registered to the groupwise averaged post-mortem image. 2.2
Evaluation Framework
Leave-one-out cross-validation The constructed probability maps as well as the post-mortem data were transformed to MNI space using the SPM software for validation. The quality of the proposed probability maps was evaluated using a leave-one-out method at two different thresholds: 20%, and 60% (for the published maps) and 22.2% and 66.67% (for the proposed maps). All combinations of nine out of 10 (10 cases) were used to create probability maps for three subregions of Te1.0, Te1.1, and Te1.2 using the proposed method. The created maps were then used to ‘diagnose’ each subregion in the excluded brain, and true positive (TP), false positive (FP), true negative (TN) and false negative (FN) voxels were calculated. Labeled voxels from the excluded brain that were correctly identified by the probability map are TP voxels. Labeled voxels that were not identified in the excluded brain are FN, and unlabeled voxels that were incorrectly classified as the target subregion by the probability map are FP. Finally, unlabeled voxels that are correctly identified by the probability map are TN. We measure the quality of the maps based on sensitivity (Sn), specificity (Sp) and positive predictive value (PPV): Sn =
TP , TP + FN
Sp =
TN , TN + FP
PPV =
TP TP + FP
(3)
The published maps were also used to evaluate the same post-mortem data; however, the published maps were evaluated on the same data that was used to constitute the maps. MANOVAs were used to identify significant differences on these measures between the two types of maps. 8
Statistical Parametric Mapping: Wellcome Department of Cognitive Neurology, UK.
Fig. 3. Comparing cytoarchitectonic probability maps generated using the proposed method and the previously published maps [8], superimposed on Colin27 brain.
Between-map overlap Any single voxel can only belong to one subregion. To the extent that voxels are shared between two adjacent Te1 maps and are assigned high probabilities by both maps, the maps do not segregate the regions well. We evaluate the two methods for such between-map overlap (i.e., Te1.0/Te1.1, Te1.0/Te1.2, and Te1.1/Te1.2).
3
Results and Discussion
Figure 3 gives cross-sectional views of both the proposed and previously published probability maps for Te1.0, Te1.1, and Te1.2 subregions overlaid on Colin27 [13] brain image. White and black colors correspond to the highest and the lowest probabilities, respectively. As can be seen, the proposed probability maps are significantly denser in terms of the spatial expansion and more focused on Heschl’s gyrus. Both proposed and published probability maps are more diffuse in the right hemisphere than left. Sensitivity, specificity, and positive predictive values were calculated for both proposed and published maps. We consider left and right hemispheres separately. Four-factor MANOVAs (method: proposed vs. published; subregions of Te1: Te1.0, Te1.1, and Te1.2; hemisphere: left or right; threshold value: 2 levels) were conducted on each of the three diagnostic measures followed by post-hoc pairwise comparisons to identify significant differences. PPV (F(1,9)=113.442, p < 0.05) and specificity (F(1,9)=298.542, p < 0.05) were significantly higher for the proposed than the published maps; however, sensitivity did not differ; see Table 1. Significant difference in PPV despite no significant difference in
sensitivity implies that the proposed maps are more conservative in labeling the cytoarchitecture in brain compared to published maps.
Method
Sensitivity Specificity
PPV
(mean±std) (mean±std) (mean±std)
proposed 23.8 ± 1.1% 96.8 ± 0.3% 73.4 ± 2.1% published 24.2 ± 1.4% 84.8 ± 0.6% 30.4 ± 3.6%
Table 1. Mean±std of the sensitivity, specificity and PPV values of the 10 test cases for both types of maps.
Next, the percentage of the overlap between maps of adjacent subareas was calculated and compared between the proposed and published maps. All maps were thresholded at 40%, assuming overlap at lesser probabilities could arise for voxels on the edges of the maps. We define an overlapping voxel as “critical” if the probability value for both maps exceeds 50%. As can be observed from Table 2, there is a higher probability of overlapping voxels in the published maps exceeding this critical value compared to our proposed maps. Nonadjacent regions (Te1.1 and Te1.2) did not overlap in either map type. Overlapping Overlap Critical Method Maps Percentage Voxels Proposed 0.1% 0.0% Te1.0/Te1.1 Published 1.4% 21.0% Proposed 0.6% 3.0% Te1.0/Te1.2 Published 1.0% 20.0%
4
Table 2. Total percentage of the overlapping voxels and the critical voxels in every pair of the overlapping maps given for both methods.
Conclusions
The presented work demonstrates a novel approach for creating template-free customizable cytoarchitectonic probabilistic maps for Te1 subregions of the human primary auditory cortex. In anatomical/functional studies of the brain with a small number of subjects (such as the post-mortem data set), pairwise matching introduces a large bias factor in the registration results due to the high degree of intersubject morphological variability among the individuals. The templatefree strategy of registration avoids such bias by simultaneous registration of all brains towards a virtual reference image that is iteratively updated. The proposed method of cytoarchitectonic probability map construction takes advantage of a novel groupwise registration to transform the labeled post-mortem data into a common space in a template-free fashion. The presented approach can be applied to any other area of the brain for which the corresponding cytoarchitectonic data is available from post-mortem subjects. For the Juelich data set, this includes motor cortex, somatomotor cortex, visual cortex, Broca’s area and others. The proposed approach enables accurate and reliable testing of the hypothesis of architectonic-functional relationships in cognitive neuroscience.
These probability maps, after the data from a functional neuroimaging (e.g., fMRI) subject has been registered to them, can be used to conduct a ROI-based statistical analysis by using them as weighted filters on the functional data. Such method of ROI-based functional analysis would allow for more precise and focused functional differentiation of small, adjacent subregions in the brain. Acknowledgments. This work was partially supported by the Natural Sciences and Engineering Research Council (NSERC), Ontario Ministry of Research and Innovation, the Canadian Institutes of Health Research (CIHR), and NIH grant EB004126.
References 1. Amunts, K., Weiss, P., Mohlberg, H., et al.: Analysis of verbal fluency in microstructurally defined stereotactic space: The role of Brodmann’s areas 44 and 45. J. Comp. Neurol. 16(2) (2002) 176 2. Eickhoff, S., Amunts, K., Mohlberg, H., Zilles, K.: The human parietal operculum. II. stereotaxic maps and correlation with functional imaging results. Cereb. Cortex 16(2) (2006) 268–279 3. Amunts, K., Zilles, K.: Advances in cytoarchitectonic mapping of the human cerebral cortex. Neuroimaging Clin. N. Am. 11 (2001) 151–169 4. Amunts, K., Schleicher, A., B¨ urgel, U., Mohlberg, H., Uylings, H., Zilles, K.: Broca’s region revisited: Cytoarchitecture and intersubject variability. J. Comp. Neurol. 412(2) (1999) 319–341 5. Felleman, D., Essen, D.V.: Distributed hierarchical processing in the primate cerebral cortex. Cereb. Cortex 1 (1991) 1–47 6. Zilles, K., Schleicher, A., Palomero-Gallagher, N., Amunts, K.: Quantitative analysis of cyto- and receptorarchitecture of the human brain. Brain Mapping: The Methods 2nd Edn. (2002) 573–602 7. Eickhoff, S., Paus, T., Caspers, S., Grosbras, M., Evans, A., Zilles, K., Amunts, K.: Assignment of functional activations to probabilistic cytoarchitectonic areas revisited. NeuroImage 36(3) (2007) 511–521 8. Morosan, P., Rademacher, J., Schleicher, A., Amunts, K., Schormann, T., Zilles, K.: Human primary auditory cortex: Cytoarchitectonic subdivisions and mapping into a spatial reference system. NeuroImage 13(4) (2001) 684–701 9. Bailey, L., Abolmaesumi, P., Tam, J., Morosan, P., Cusack, R., Amunts, K., Johnsrude, I.: Customised cytoarchitectonic probability maps using deformable registration: Primary auditory cortex. MICCAI 4792/2007 (2007) 760–768 10. Geng, X., Christensen, G., Gu, H., Ross, T., Yang, Y.: Implicit reference-based group-wise image registration and its application to structural and functional MRI. NeuroImage in Press (2009) 11. Tahmasebi, A., Abolmaesumi, P., Wild, C., Johnsrude, I.: Quantification of intersubject variability in human brain: a validation framework for probabilistic maps. Proc. SPIE 7262 (2009) 726218 12. Christensen, G., Johnson, H.: Consistent image registration. IEEE Trans. Med. Imag. 20 (2001) 568–582 13. Holmes, C., Hoge, R., Collins, L., Woods, R., Toga, A., Evans, A.: Enhancement of MR images using registration for signal averaging. J. Comput. Assist. Tomogr. 22(2) (1998) 324–333