A New Approach for Video Indexing and Retrieval Based on Visual Features Carlos A. F. Pimentel Filho1 and Celso A. Saibel Santos2 1
Departamento de Ciência da Computação Universidade Federal de Minas Gerais, Brazil
[email protected] 2 Departamento de Ciência da Computação Universidade Federal da Bahia, Brazil
[email protected] Abstract. This work is concerned with video indexing and retrieval based on visual features. It puts forward an approach for the automatic summary and indexing of digital videos in order to support queries based on visual content on a video database. The proposed approach was applied to a video collection containing more than 34 hours of broadcast news videos. Visual features extracted from the summarized version of the videos were then used for video content indexing. That provided us with the basis for various experiments and analyses on the retrieval of visual content with the application of various techniques implemented. The approach proposes a method for key frame extraction that summarizes video content in a static storyboard, specifically designed for key frame retrieval and video access. Thus, the selected key frames are processed in order to extract statistical features as well as wavelet coefficients to represent the video’s essence in a very short amount of data while preserving its main content characteristics. Categories and Subject Descriptors: Information Storage and Retrieval [Content Analysis and Indexing]: Abstracting methods and Indexing methods Keywords: CBIR, CBVR, Video Indexing, Video Summarization
1.
INTRODUCTION
Advances in technology in video production, transmission, distribution and storage have produced a large amount of multimedia data giving rise to several important questions. Some of these questions are: How do we represent video content in order to support queries for specific scenes or frames? How do we manage, navigate and retrieve information in visual media quickly and efficiently? These questions make the automatic analysis of multimedia content an important research topic today [Seinstra et al. 2007]. The extensive use of digital videos and the need of managing multimedia repositories in an effective and efficient way have led to content-based video retrieval (CBVR) systems [Seinstra et al. 2007; Truong 2004; Zhang et al. 1997]. Such systems are based on a reduced representation or description of video visual features. The approach presented in this article involves all of the phases of CBVR, ranging from the extraction of key frames and visual features, which produces a compressed representation of the visual content, to the retrieval of specific parts of a video, based on its visual similarity. The approach was applied to a repository containing more than 34 hours of broadcast news videos, This work was carried out while their authors were affiliated to Universidade Salvador and was funded by CNPq grant for supporting the project DEIVID (Ambiente para DEscrição, indexação e consulta de conteúdos de VÍDeos Digitais - grant number 506647/2004-8). The first author was supported by a scholarship from CAPES during his MSc studies at Universidade Salvador. c Copyright 2010 Permission to copy without fee all or part of the material printed in JIDM is granted provided that the copies are not made or distributed for commercial advantage, and that notice is given that copying is by permission of the Sociedade Brasileira de Computação. Journal of Information and Data Management, Vol. 1, No. 2, June 2010, Pages 293–308.
294
·
C. A. F. Pimentel Filho, C. A. S. Santos
represented in reduced form by just about 1.25% of its total number of frames. This reduced representation was used to extract visual features and to create an index to evaluate video content. The produced repository was used in various experiments in order to analyze the performance of retrieval techniques implemented using the proposed approach. Besides the proposed approach itself, this article addresses the retrieval of video frames with tolerance for small visual changes. In the analyzed video collection of broadcast news, the proposed approach allowed us to find frames semantically related (news of the same genre), belonging to different news issues, even if there have been some small changes between related video frames. This article extends previous work presented in [Filho et al. 2008] and [Filho et al. 2009], and it is structured as follows. Section 2 outlines aspects of visual information retrieval. Section 3 presents the proposed approach, describing its key frame selection and visual retrieval methods. Section 4 presents experimental results and analyzes the performance of the implemented tools. Finally, Section 5 presents the conclusions. 2.
CONTENT BASED VIDEO RETRIEVAL
In 1951, Calvin Moores [Moores 1951] coined the term "Information Retrieval", associating it with the process with which a set of definitions can convert a request for information into a number of useful references. In general, this process starts with the definition of a structure of indexes that can be used to allow the retrieval of specific parts of the body of stored information. The indexing of video content can be made through an automatic or manual process, or even a combination of both. In manual indexing, a database must be created with video descriptions and a manual process creates the corresponding indexes. In automatic indexing, a computer system automatically analyzes the visual or audio content generating the entries for the indexes. This specific work focuses on automatic video indexing, building upon the visual content of its key frames. Since each video frame is also an image, the algorithms used in this work are based on existing techniques for extracting features of ordinary images [Jacobs et al. 1995]. According to Fig. 1, the retrieval of an image is basically done in three ways: "text based", "sketch based" and "example based" [Deselaers 2003].
Fig. 1.
Ways for image retrieval: (a) "text based", (b) "sketch based" and (c) "example based"
In "text based" retrieval (Fig. 1(a)), the user provides a textual description of the content of interest. This description is then applied to a database in order to retrieve the desired content. In Journal of Information and Data Management, Vol. 1, No. 2, June 2010.
A New Approach for Video Indexing and Retrieval Based on Visual Features
·
295
this approach, it is necessary that the video content has been annotated by following some metadata standard, such as MPEG-7 [Gertz et al. 2002]. This approach is more efficient from a semantic point of view. However, it is very much dependent on manual notes previously made. Moreover, the annotations are very costly. Each video hour properly annotated consumes around ten man-hours of work. According to [Dimitrova et al. 2002], more than the cost of generating manual annotation, when it can be done, it may be subjective and incomplete. In "sketch based" retrieval (Fig. 1(b)), the user makes a sketch of the image that she is looking for. This should be as close as possible to the model she has in mind, i.e., as similar as possible in terms of color, shape and position of objects. To achieve the "sketch based" retrieval, the present work used the wavelet transform as a tool for feature extraction [Jacobs et al. 1995]. In "example based" retrieval (Fig. 1(c)), the user provides an image similar to that one she is looking for. This image is applied as a sort of template, example or model from which basic features are extracted and then used in the query process. The query image can be a photograph, an image in low resolution, a thumbnail picture similar to the desired target or even a synthetic image generated by computer graphics. 3.
THE PROPOSED APPROACH
The approach proposed in this article provides a series of features related to the capture and processing of individual video frames. There are also modules dedicated to indexing, querying and navigating on visual content. The architecture of the proposed tool is divided into two main modules: a module responsible for video parsing [Guan et al. 2000], the video parser, and another module called video oracle, which is responsible for indexing, querying and navigating through the videos. This architecture is shown in Fig. 2.
Fig. 2.
3.1
Indexing, retrieval and navigation in the content-based video approach
Main Video Parser Characteristics
The video parser was implemented in C++ with the support of the Microsoft DirectX c API. Any video codec1 that is installed and recognized by DirectX c is processed by the tool’s parser. The features implemented in the parser are: —Video frame resizing to 128×128 pixels resolution. —Extraction of distances between frames (in order to support automatic shot cut detection). 1A
codec is a device or computer program capable of encoding and/or decoding a digital data stream or signal. Journal of Information and Data Management, Vol. 1, No. 2, June 2010.
296
·
C. A. F. Pimentel Filho, C. A. S. Santos
—Key frames selection and storage in thumbnail format. —Extraction of the wavelet signature [Jacobs et al. 1995] and statistical key frames features. —Storage of statistical data, distances between video frames and wavelet key frame signature. 3.1.1 Video Frame Resizing. All video frames are processed by the video parser to reduce the spatial resolution. Independent of video input resolution, each frame is scaled to 128×128 pixels. Three factors led to this resizing: —Processing of video frames in low resolution presents lower computational cost in the last stages of parsing. —Frame resizing presents few changes into data features when compared to data obtained from the original frame resolution. The statistical frame features and differences or distances between them have no relevant change comparing to those spatially reduced. —Extraction of wavelet signatures also suffers little interference, since the details in the frames in higher resolution are usually discarded by the signature method. The reason for choosing 128×128 pixels is a restriction of the DWT algorithm presented by [Jacobs et al. 1995]. This restriction requires that the number of rows and columns be always power of two. The reference [Liu et al. 2007] also makes a reduction in image resolution in a work involving image clustering. It is noteworthy that the appearance aspect of the frames is lost, resulting in distortion of images. But this is not a problem for querying similar frames, since the images used as query input parameters receive the same aspect appearance change. 3.1.2 Extraction of Distances between Frames. In its essence, we can say that the methods for automatic shot cut detection and key frame extraction used in this work are basically the same [Santos 2004]. The main differences between them are the thresholds applied and the color channels used by each method (RGB or YIQ). Another difference is that, given a frame qi at time i, for the shot cut detection, there is a comparison between adjacent frames qi and qi+1 , whereas in order to extract key frames, the differences are taken between the last key frame and the next n new key frame candidates (qi and qi+n ). 3.1.3 Key Frame Selection. Key frame selection meets two key roles: the first one is to select which frames will be processed during the extraction of statistical features and the image signature, and the second is to support automatic video summary and browsing [Hanjalic and Zhang 1999]. Due to temporal redundancy, adjacent frames tend to have very similar statistical features as well as wavelet signatures are close or even identical [Jacobs et al. 1995]. One of the main objectives of the present work is to select a number of key frames that produce the best relation between redundancy and losses when capturing the key frames. Thus, a reduced set of key frames tends to produce compact summaries that make the indexing possible (in terms of time and space complexity). Consecutive frames are considered redundant when they have great visual similarity, defined by some metric that compares them [Filho et al. 2008]. The analysis of a smaller set of frames has three advantages: (i) higher speed of processing in the overall amount of key frames, (ii) reduced amount of redundant information in the indexes and (iii) smaller cost of storage and better performance in query answer time. The proper key frame selection also depends on the main objectives of the application that will use them. In order to support the summary and the CBVR approach proposed by this work, the capture of key frames must be performed with the smallest key frame losses and the least redundancy possible between key frames. That is because it is expected that the low representation of video through the static summary is enough to allow the implementation of queries for visual content retrieval with an acceptable accuracy. The difficulty in generating an adequate summary for the proposed approach is Journal of Information and Data Management, Vol. 1, No. 2, June 2010.
A New Approach for Video Indexing and Retrieval Based on Visual Features
·
297
exactly the setup of the parameters (loss and redundancy). The algorithms that minimize the losses add some redundancy, while on the other hand, the algorithms aimed at minimizing the redundancy involve considerable losses of representative frames for visual content. 3.1.4 Pixel-by-pixel Comparison of Successive Frames. The most simple and direct approach for comparison of frames is the computation of the distance between them using the values of their pixels that occupy the same position in space. To this end, L1 or L2 norms can be used (Eq. 1 and 2 respectively). Even though these equations do not define the color channel used in the comparison, they are valid for any channel.
kfl , fl k =
X
|fk [i, j] − fl [i, j]|
(1)
i,j
kfl , fl k2 =
sX
(|fk [i, j] − fl [i, j]|)2
(2)
i,j
The same method can be used for the selection of key frames. The first frame of the video, q0 , is the first selected key frame. From the last selected key frames, the distance to each of the next frames is computed until a threshold is reached. In this case, a new key frame is chosen. Algorithm 1 illustrates the pseudo-code of the method. Data: All Video Frames Result: Key Frames initialization; i ← 0; kF rame ← q[i]; for i ← 1 to totalF rames do if distance(kF rame, q[i]) > threshold then kF rame ← q[i]; end end Algorithm 1: Key frames selection by distance 3.1.5 Comparison of Frames by Histogram. Another technique which is intensively used in shot detection is based on the comparison of histograms of light intensity of the frames. The histogram of a digital image with gray levels in the interval [0, L − 1] is a discrete-time signal p(rk ) = nk /n, where rk is the k-th level of gray, nk is the number of pixels in the image with intensity k, n is the total number of pixels in the image and k = 0, 1, 2, ..., L − 1 [Gonzalez and Woods 2008]. The selection of key frames based on histogram can be simply implemented by replacing the function of pixel-wise distance in Algorithm 1 by the function of distance between histograms, illustrated in Eq. 3. In this equation, fi and fj stand for, respectively, the frames i and j; pi and pj stand for the histograms of probability of the frames i and j; and zn (fi , fj ) stand for the function of distance between the two histograms.
zn (fl , fl ) =
l=0 X
|pi [l] − pj [l]|
(3)
L−1
Even though Eq. 3 has been presented with respect to a monochromatic image, it can be also applied to the RGB or any other color domain. As in the pixel-wise method, the difference by histogram is Journal of Information and Data Management, Vol. 1, No. 2, June 2010.
298
·
C. A. F. Pimentel Filho, C. A. S. Santos
computed for each RGB color channel as well as for I and Q channels in the video parser. The exclusion of Y channel is due to a common characteristic in journalistic videos: they very often present flashes and take transition effects with fading, resulting in many redundant key frames when comparison by histogram is used. Since flashes and fading are related to image brightness, a possible solution is not to consider the luminance component (Y channel) in the computation of the distances [Drew and Au 2000]. 3.1.6 Selection of Key Frames. The selection of key frames depends on the goals of the application that uses them. In order to support searches oriented to the visual content proposed in [Jacobs et al. 1995], the capture of key frames should simultaneously have the least frame loss and the least redundancy, when compared to a reference obtained with human interference. Consecutive frames are redundant if they can be considered visually similar, measured by the distance between them. Lost frames are those which appear in the manual reference but have not been captured by the method. The number of lost and redundant frames is influenced by the suitable choice of the considered distance threshold. If such a threshold is too low, many redundant frames are generated; if it is too high, many frames may be lost. 3.2
Evaluation of Automatic Key Frame Extraction Methods
When applied to RGB and YIQ color spaces, the two methods based on frame difference presented in previous sections have generated four basic approaches for key frame automatic selection: (B1) pixel-by-pixel in RGB and (B2) histogram differences in RGB; (B3) pixel-by-pixel in IQ and (B4) histogram differences in IQ components of the YIQ color space. Besides individual application of each basic method, this work intends to show that a reasonable tradeoff between redundant key frames and amount of key frames loss should be met when basic approaches are integrated. Three new "combined" approaches have been derived from the previous four basic ones: (C5) integration of B1 and B2, (C6) integration of B3 and B4 basic approaches and, finally, (C7) integration of the four basic approaches. Actually, the combined key frame extraction methods are obtained from a slight modification of Algorithm 1: the "if condition" is related not only to an individual basic approach, but to a combination of these basic approaches using the AND logic operator. 3.2.1 Evaluation Criteria for the Methods. The evaluation criteria for the automatic key frame selection methods applied in this work is the tradeoff between redundant key frame generated and the amount of key frames lost for the analyzed method. A subset of key frames obtained by human intervention is used as the reference (or target) subset. Each subset obtained from applying a (basic or combined) method is compared to the reference subset for producing redundancy and lost measures. In [Drew and Au 2000], the authors use a similar approach to compare video summaries automatically and manually generated. The target subset of key frames was obtained from visual inspection of a 44 minutes video segment related to a TV News including commercial breaks, in a total of 79.432 frames. The reference subset contains 582 shots and 883 key frames and, thus, 1,51 key frame per shot. The metrics used in the analyses are (i) the percentage between additional (redundant) key frames and (ii) the percentage between missing (lost) key frames for a method when it is compared to the key frames reference subset. Hence, for example, if a shot cut in the reference subset contains 10 key frames and the method produces 15 key frames, the method exhibited a redundancy of 50% for the considered shot. Similarly, if a shot contains four frames in the reference and the automatic method produces three frames, the method presents percentage loss of 25%. In Table I, KF/S is the mean of key frames per shot. The first row presents the reference subset values for the proposed evaluation. As those values have been obtained by human intervention, there Journal of Information and Data Management, Vol. 1, No. 2, June 2010.
A New Approach for Video Indexing and Retrieval Based on Visual Features Threshold not defined 45 52,5 60 67,5 75
KF/S 1,51 2,74 1,94 1,39 1,02 0,71 Table I.
Loss 0% 8,2% 16,4% 26,3% 9,8% 51,7%
Redundance 0% 65,2% 33,2% 14,9% 7,9% 3,1%
Total Loss 0 90 158 265 387 505
Total Redundance 0 763 380 173 87 30
·
299
Total 883 1596 1132 809 595 413
Reference values followed by pixel-by-pixel in RGB
is no frame redundancy neither frame loss. In other words, it is supposed that this subset contains only the key frames expected from an automatic extraction process. It is also important to notice that performance of each automatic method is strongly dependent on the threshold choice for the inter-frame distance, as shown in Table I. 3.2.2 The Threshold Choice. The experimental interactive process proposed in this work consists of finding the best inter-frame distance threshold for each analyzed method applying the following rule: the best threshold is defined by the point P at which the redundancy curve intercepts the loss curve in the performance graph of the method. Intuitively, in all the other points (except P ) in the graph the redundancy increases and the loss decreases, or vice versa. Hence, the intersection point between loss and redundancy curves associated to a key frame selection method defines its best threshold. As an example, consider Fig. 3. It shows the graph associated to the values presented in Table I, in which the threshold can have values between 45 and 75. Note that the threshold can assume values on the interval from 0 (identical consecutive frames) to 255 (maximum difference, for instance, white and black frames consecutively). In this example, the best threshold obtained from the redundancy versus loss graph associated to B1 method (RGB distance) is 22%.
Fig. 3.
Loss vs. Redundancy graphic for RGB pixel-by-pixel difference method
Table II depicts the points of redundancy and loss curves for all methods analyzed in this work. These values have been produced applying the same experimental process described previously. As shown in Table II, the pixel-by-pixel difference method (B1), even though very simple, has obtained the best performance when only individual methods are considered. The C7 method that combines the basic methods B1-B4 has produced the best whole performance with almost 12% of redundancy and loss when compared to the target key frames subset. This method exhibits robustness to fading and dissolution transition effects, avoiding excessive redundant key frames selection. The weakness of the method is similar to that of B1 and B2 methods, that is, it is sensible to rapid brightness variation (for example, in scenes within flash lights, very usual situation in TV news) that causes abrupt changes in histogram and pixel-by-pixel distances calculated between consecutive frames. It is important to notice that combined methods imposing a specific "best" threshold must be found for each individual basic method involved in the combination. In this work, these thresholds were Journal of Information and Data Management, Vol. 1, No. 2, June 2010.
300
·
C. A. F. Pimentel Filho, C. A. S. Santos Method 1 - Pixel-by-pixel RGB 2 - RGB Histogram 3 - IQ Pixel-by-pixel 4 - IQ Histogram 5 - Combination of methods 1 and 2 6 - Combination of methods 3 and 4 7 - Combination of methods 1, 2, 3 and 4 Table II.
Result 22% 29% 39% 25% 17% 18% 12%
Best performance for loss vs. redundancy in each method or combination
defined based on a heuristic process considering the individual performance of each basic method when applied to a same video sequence. In the sequel, the performance of the combined method is evaluated using the supposed best thresholds for basic methods. The subset containing the automatically extracted key frame is then visually inspected in order to verify if the redundancy level is high and which, among the basic methods, causes the problem. Then, the threshold for the identified method is augmented. A similar process is applied to analyze the key frames loss level produced for each basic method. If the loss level is not acceptable, the threshold value is reduced for minimizing the problem. The evaluation of isolated basic methods allows, indeed, to specify the lower and the upper bounds for the threshold values, reducing the possible configurations that should be analyzed. Once the thresholds were set using the described process, they are fixed in the C7 method for automatically key frame extraction. 3.2.3 Statistical Features and Wavelet Signature Extraction from the Key Frames. In the approach used by this work, the visual features of the key frames representing a video were mapped in two parts: (i) image signature and (ii) statistical key frame features. The image signature obtained from the key frames follows the proposal of [Jacobs et al. 1995], which consists in a collection of the ten largest and ten smallest coefficients of the wavelet transform [Charles 1992; Daubechies 1992; DeVore et al. 1992; Stollnitz et al. 1995] of the image. It also includes the average obtained from all of the image pixels. The extraction of the coefficients, obtained independently for each color channel, YIQ in this case, defines the "image signature" [Jacobs et al. 1995]. The higher coefficients, i.e., the more energetic in absolute values, represent the main frequency components of the image (in other words, they are the image essence). Although such a representation is very short, it preserves the essential components in terms of color and spatial information of objects contained in the images or frames. Details on the implementation, algorithms and the justification about the choice of the YIQ color space are discussed in [Jacobs et al. 1995]. Nine features were selected to compose a statistical vector that also summarizes the visual content of each key frame. In fact, these nine features are conceptually summarized by just three features, as each one was applied to the three YIQ color channels. The three basic extracted features are: mean, variance and entropy [Gonzalez and Woods 2008]. The statistical features used to represent the key frame content are also obtained form the YIQ color space in order to maintain compliance with the coefficients obtained by wavelet signatures. 3.2.4 Creating Data Files. The video parser generates four files with the data resulting from the processing. The first file contains the characteristics of the video processed, such as the frame rate per second, the spatial resolution, the total amount of frames, and so on. The second file contains the difference between neighbor frames, in order to support the shot cuts detection. The third file stores the statistical features of key frames. And finally, the fourth file stores the wavelet coefficients that represent the frame signature. These last two files are the basis for the key frame query based on its visual content. Journal of Information and Data Management, Vol. 1, No. 2, June 2010.
A New Approach for Video Indexing and Retrieval Based on Visual Features
3.3
·
301
Video Oracle Characteristics
The video oracle tool "consumes" the data files produced by the video parser and "feeds" a database with the parsed data. The video oracle also analyzes the parsing data in order to detect shot cuts. It also provides an interface for queries on the key frame indexes and navigation platform through the indexed videos. The main functions performed by the video oracle are: —Indexing and integration of data generated by the video parser (text files) in the database. —Data analyses between neighbor frames offered by video parsing tool in order to infer shot cuts. —User interface for key frame queries in the indexed videos. —"Query by example" on the statistical visual content key frame database. —Key frame "query by example" or "query by sketch" based on image signature. —Access to the temporal video segment represented by the key frame, regardless of the query method used. The following sections detail each one of the features of the video oracle module. 3.3.1 Indexing and Inserting Data in the Database. The process of inserting data generated by the parser is semi-automatic, since the user individually selects the video processed by the parser. After selecting the video files, the data with the representation of the video features are automatically inserted and indexed into the database. 3.3.2 Automatic Shot Cut Detection. In the specific case of neighbor frame data, the video oracle tool already identifies and analyzes possible shot cuts inserting in the database only the shot boundaries inferred by the distance pixel-by-pixel between neighbor frames. Two metrics were also analyzed: the Euclidean distance between histograms of the frames and the difference taken by the image signatures described in [Jacobs et al. 1995]. The results of these two methods were not as satisfactory as compared to pixel-by-pixel, thus the prevalence of the latter method. Details and comparisons of performance between the methods are outside the scope of this work and can be found in [Filho et al. 2008]. 3.3.3 Video Key Frame Querying Interface. For image query systems, the interaction between the user and the system is crucial, since the entry of information is flexible and changes in the consultation may be obtained by involving the user with the search procedure. Typically, the environments of retrieval systems have an area to specify the query and to display the results. The video oracle interface tries to be simple and intuitive. The video oracle interface for search and navigation is shown in Fig. 4. The specification of the query is made by selecting an image file from the directory of files (see Fig. 4(2)). There is a button for "search by statistics" (Fig. 4(4)), which allows the search based on statistical feature vectors represented by a 9-dimensional vector as described in Subsection 3.3.7. The button "wavelet query" proceeds the query by using the image signature vector. Then, two strategies may be chosen for the classification task, "by example" or "by sketch" [Jacobs et al. 1995]. The query image is shown in Fig. 4(1) and the result containing the more similar target frames is represented by a collection of thumbnails shown in Fig. 4(5). The other key frames are shown in order of similarity from left to right from the first to second line of results, and so on, until the 10th minor similar frame. Results from the 11th ranking are shown in other "pages", each one with 10 frames, presented in decreasing order of similarity. 3.3.4 Access and Navigation Through Indexed Videos. The access and video browsing through its content use the same query interface shown in Fig. 4. Each thumbnail displays the video file name associated with the correspondent key frame and the exact position where it occurs in the video. To watch the video content in the exact point where the key frame occurs, the user just has to click on the desired key frame result and the video starts to play. Journal of Information and Data Management, Vol. 1, No. 2, June 2010.
302
·
C. A. F. Pimentel Filho, C. A. S. Santos
Fig. 4.
Video oracle user inteface
3.3.5 Key Frame Query Process. To process a query, regardless of the method (statistical or image signature), a sequence of steps is followed. First, the user provides an image ("example" or "sketch") to the system, this image is called "query image". The image features are extracted according to the selected query processing method. The same procedures applied by the video parser tool (resizing the image to 128×128 pixels and converting the RGB color space to YIQ) are performed on the query image. If the statistical method is selected, the system proceeds by extracting the statistical features from the query image, which results into a 9-dimension vector. If the wavelet method is chosen, the image is transformed to the wavelet domain, where its image signature is obtained. Once the statistical features or the image signature has been extracted from the query image, it is possible to compare the image signature or the statistical vector with the entire database of indexed key frames features, and then classify the results according to their similarity. However, such operation, when applied to the entire database, involves a high computational cost. To resolve this problem, a primary filter selects the most likely vectors or image signatures in the database, bringing a much smaller subset of data to be compared and classified. This process is similar to one done by the QBIC system [Flickner et al. 1995]. 3.3.6 Query by Image Signature. In the case of signature image based query, the primary filter takes into account only the three average values of pixels from the YIQ color channels. After filtering, each resulting representative key frame signature is then compared with the query image signature according to the metric described by [Jacobs et al. 1995]. Finally, the best key frames results are ordered by distance and displayed. 3.3.7 Query by Statistical Features Method. In the case of query by statistical characteristics, a primary filter is applied by using all the nine features described in Subsection 3.2.3. After filtering, each representative result vector is compared with the vector obtained from the query image by using the Euclidean distance [Gonzalez and Woods 2008]. Then all the distances measures are sorted and the most similar frames are displayed to the user. Journal of Information and Data Management, Vol. 1, No. 2, June 2010.
A New Approach for Video Indexing and Retrieval Based on Visual Features
4.
·
303
ANALYSIS OF THE PROPOSED APPROACH AND SUPPORTING TOOL
A series of experiments were performed to define the best solutions for implementing the tool in order to perform visual content-based retrieval on videos. Those experiments included the evaluation of the best key frame summary generation. Pimentel et al. [2008] show that the video parser generates summaries with low key frame loss (frames that should have been selected), around 12%. It also provides a low redundancy amount of frames (wrongly selected key frames) around 12%. It was possible to conclude that the summary representation of the video contents obtained by this approach can be effectively used as a basis for CBVR. The second phase included the evaluation of the experiments on the frame video retrieval from some query images. For these experiments, it was necessary to build a video collection, obtained by capturing TV transmissions. More specifically, 46 editions of the Jornal Nacional 2 were captured. The news videos have an average duration of 44.5 minutes per edition, including commercial breaks. In summary, this generated a collection with more than 34 hours of video equivalent to 3.5 million of individual frames. 4.1
Content-based Frame Retrieval Evaluation
The performance evaluation of CBIR approaches is not a trivial task for three reasons. First, there is not a pattern regarding the precise metrics used to evaluate the performance of visual image retrieval. Second, there is not a standard image gallery for evaluating the results of searches [Long et al. 2003]. And third, the consensual limit about two images similarity is subjective and imprecise. The performance evaluation of frame retrieval performed by this work used two metrics borrowed from the field of classical information retrieval: recall and precision [Long et al. 2003]. More specifically, in the evaluation of frame retrieval performance, µ denotes the total number of relevant frames retrieved, λ denotes the total number of retrieved frames and ϑ denotes the total number of relevant frames. The measures for precision p and recall r are given by the Eq. 4 and 5:
p=
µ λ
(4)
r=
µ ϑ
(5)
The total number of relevant frames ϑ can vary greatly according to the target frame. For example, the search for an atypical frame returns few occurrences from the database, while the search for a frame that composes a commercial break can be repeated many times across the database, because every time the commercial appears, a recurrence of similar key frames are selected by the video parser and these frames are included in the database. The query performance evaluation for each frame is done in two steps. In the first step, the occurrence of similar frames is manually counted, i.e., once a query is specified, it is manually established how many frames should be returned. In the second, the number of returned frames is compared to that of those manually obtained. This second phase also gives some important criteria related to the position of the frames in the similarity classification. It is important because it is not enough that the frame has been returned, it is necessary that it has been well classified (the first positions classification is directly related to the equation of accuracy). Ideally, the target frames are returned and ranked among the top results, which in practice does not always occur. In order to measure the frames ranking, it was admitted a certain range of tolerance to its maximum permitted in the classification order. This tolerance band is relative since it directly depends on the number of expected frames. 2 Jornal
Nacional is a Brazilian news broadcasted by Rede Globo Television Journal of Information and Data Management, Vol. 1, No. 2, June 2010.
304
·
C. A. F. Pimentel Filho, C. A. S. Santos
Thus, each test is evaluated four times in order to measure precision and recall. The reason for the assessment in four steps was to give a greater margin of tolerance in the ranked frames returned by the queries. For each query, the tolerance margin is increased until a certain limit. As a result, it is observed that when the set of classified samples is increased, there is an increase in recall and a reduction in precision. The four rating tests are based on the following criteria: for precision pi , λ varies from ϑ to 4ϑ λ = iϑ, where i ∈ 1, 2, 3, 4. In practice, it means that for the first search test, the classified target frames are observed just until the position ϑ; in the second test until 2ϑ; in the third until 3ϑ and, finally, the fourth and final search, the results of precision and recall up to 4ϑ frames ranking positions. It is important to note that, when submitting queries to a production environment, the number of expected frames will probably be unknown by the user. Thus, up to a maximum of four times the amount of manual counted frames is only a formal way for assessing the performance environment proposed in this work. In practice, a user can navigate through a really much bigger collection of ranked frames. It is also important to highlight that the higher the number, the more likely it is to obtain a recall of 100% or very nearly so, since the database will obviously contain all of the expected frames in the search. 4.2
Considerations for the Frame Search
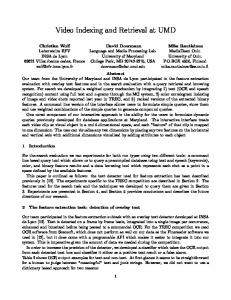
In the query based on similarity, the user may have in mind a degree of closeness between frames that depend on his goals. Thus, this study evaluates and defines two specific types of query, as follows: "query for most similar frames" and "query for frames with small dissimilarity tolerance". —In the "query for most similar frames" the goal is to retrieve the frames most similar to some image provided as an example. Such kind of query is based on the premise that known frames are repeated several times on the database of key frames. As an example, such key frames are present in commercial and stickers that are repeated during programming. By doing this kind of search, the user must have an example which is very similar to that one she wants to retrieve. In other words, the user wants to retrieve all of the re-occurrences of scenes where the example key frame appears. As an example of such a kind of query, the user wants to retrieve all segments of the news weather forecast. In order to reach this objective, she provides a common frame that occurs in all of the forecast opening calls, as occurs in Jornal Nacional. —In the "query for frames with small dissimilarity tolerance" there is a greater degree of tolerance given to the similarity. This kind of query may be useful depending on various situations and the user’s needs. As an example observed in videos of Jornal Nacional, the anchor usually appears in a scene whose background is themed to the news. For example, news related to politics have an appropriate background, as well as news related to health, education, economy, sports, football and so on. —Fig. 5 illustrates some examples of "images with small dissimilarity tolerance" between them, although all the frames are related to international news, there may be changes related to anchor, her color suit, the map and/or country flag where the news is related, among other changes. It is worth noting in the case of flags, their size, their colors and shapes can vary greatly, and yet, this kind of search was successful in the experiments, as shown by the results of Section 4.3.1.
4.3
Experimental Results
From the total set of journalistic videos, nearly 3.5 million of frames have been reduced to just 42,755 key frames. This subset of key frames is used for both querying on statistical characteristics and querying based on wavelet signature. Another important fact is that this subset contains only about Journal of Information and Data Management, Vol. 1, No. 2, June 2010.
A New Approach for Video Indexing and Retrieval Based on Visual Features
Fig. 5.
·
305
Example of frames with small dissimilarity tolerance
1.25% of the total frames [Filho et al. 2008]. The evaluation results of the queries in terms of precision and recall are presented in the following subsections. 4.3.1 Query for Most Similar Frame Results. These experiments, took into account the query methods based on statistical characteristics and image signature using the parameters of the "query by example". Twenty-five key frames were tested in two experiments. These images were selected randomly and its occurrences could go from one to some dozen times in the database. The query results for the statistical and image signature method ("query by example") are presented in Tables III and IV, respectively. According to these tables, the method based on the wavelet signature had better performance.
Recall Precision
1ϑ 62,40% 62,40%
Table III.
Recall Precision
3ϑ 73,90% 24,63%
4ϑ 75,62% 18,90%
Results - estatistical query
1ϑ 91,80% 91,80%
Table IV.
2ϑ 64,18% 32,09%
2ϑ 93,40% 46,70%
3ϑ 94,71% 31,57%
4ϑ 95,91% 23,98%
Results - "query by example"
4.3.2 Results for Frame Query With Small Dissimilarity Tolerance. In these experiments, as described in Section 4.2, a tolerance to some changes in the frames was considered. Twenty five sample frames from Jornal Nacional were selected, being all of them different from those used in the experiment described in Subsection 4.3.1. Changes in the selected example images may occur in several ways, for example, the anchor suit color or other details in the background theme. Usually these themes are made up by some animation effect that supports them, so not always the key frame captured in the summary process contains exactly the same content. Thus, it is desired that the query system be tolerant enough in these deficiencies in details. The results of these experiments are shown in Table V.
Recall Precision Table V.
1ϑ 82,45% 82,45%
2ϑ 88,66% 44,33%
3ϑ 89,57% 29,86%
4ϑ 91,15% 22,79%
Query for frames with small dissimilarity tolerance results
Journal of Information and Data Management, Vol. 1, No. 2, June 2010.
306
·
C. A. F. Pimentel Filho, C. A. S. Santos
Fig. 6.
Some examples of sketch images used
4.3.3 Query by Sketch. The sketches used were manually created from a few sample frames. Some of them are shown in Fig. 6. The objective of this experiment was to eliminate details in the scenes obtained from pictures with visual similarity. The results obtained from this kind of search were quite satisfactory when the images had a really good similarity in the position of objects. The reduced spectrum of colors did not represent a problem in this kind of query. The results presented in Table VI show that recall reaches an average of 90% success until the first 4ϑ ranking. Another important point about the retrieval is concerned with the fact that success is intimately connected to the manual sketch quality. In cases where the sketch is created completely free hand, the user tends to make a sketch that really does not match the target that the user wants to achieve. Recall Precision
1ϑ 76,45% 76,45%
Table VI.
2ϑ 83,03% 41,52%
3ϑ 89,59% 29,86%
4ϑ 90,57% 22,64%
Results from "sketch query"
4.3.4 Results From Querying Random Selected Frames. Here, a last experiment shows that the proposed approach is effective for the key frame selection as well as for the frame querying. In this experiment, a set of 25 frames were randomly selected from all of the frames set from the Jornal Nacional news edition captured on September 26, 2007. These 25 frames were used as input for query by example according to two methods: the statistical and the wavelet "query by example". The objective of the experiment is to show that, if all the video content was well summarized in a set of representative frames, without loss of visual information, then all random frames were expected to be retrieved by the proposed approach. The first experiment, based on statistical similarity, obtained the results presented in Table VII. Table VII shows that the initial recall is just below 70%, evolving to around 75% by reducing precision. Recall Precision Table VII.
1ϑ 68,40% 68,40%
2ϑ 70,00% 35,00%
3ϑ 70,00% 23,33%
4ϑ 74,00% 18,50%
Results of "statistical query" using random frames
Table VIII, based on the method "query by example", presents very similar results to the ones obtained by the statistical query. An initial recall is also just below 70%, however, the final recall is slightly better than that obtained by the statistical method. For both methods, for some queries the frames were not retrieved. It happened for almost the same random examples. This problem is due to the summary creation and not to the query process, once Journal of Information and Data Management, Vol. 1, No. 2, June 2010.
A New Approach for Video Indexing and Retrieval Based on Visual Features
Recall Precision Table VIII.
1ϑ 67,73% 67,73%
2ϑ 73,20% 36,60%
3ϑ 74,00% 24,67%
·
307
4ϑ 78,00% 19,50%
Results from the "query by example" with random frames
these frames were not retrieved because the video parser lost this visual information. This shows that the video summary process is critical in such kind of multimedia indexing. On the other hand, the query results presented a very good performance since the set of frames not retrieved, was really not present in the video summary. 5.
CONCLUSION
The methods and techniques proposed in this work were assessed by using the video parser and video oracle tools presented in Section 3. These tools can be potentially used to analyze and index any kind of digital video. In other words, the obtained results shown in this article are not restricted to broadcast news video. Thus, the video parser and the video oracle may be applied to other video categories such as documentaries, movies and surveillance. The reduction of the total amount of video key frames into a compact summary is important in order to reduce the computational time and space cost as well as the reduction of the amount of data features extracted. Furthermore, the reduced summary contributes to the retrieval process time. The presented techniques resulted in an efficient retrieval system and a very compact amount of data to represent all of the visual content using just a few set of frames and with low redundancy. On the other hand, it is not possible to find an automatic summary method completely free of redundancy and, at the same time, completely representative. Some redundancy has to be accepted as well as some information loss. However, if well controlled, the relation between redundancy and information loss may be acceptable as shown in the experiments described in this work. The use of a low quality antenna during the process of video capture caused some white noise in the video collection. Nevertheless, it was not considered a serious problem and, somehow, the noise is welcome once it introduces some visual distortion that was strayed by the feature extraction algorithm. In other words, the features presented here are, in some way, white noise proof. The capture of broadcast news videos using the Brazilian digital TV broadcast can produce a better video collection without white noise. The results shown in Section 4.3 reinforce that our key frame extraction meets the expected objectives. Considering the high complexity involved in the automatic video indexing of visual content and the multimedia content retrieval, the methods presented for key frame retrieval are considered satisfactory in terms of computational cost as well as in retrieval effectiveness. The benchmark was implemented in an ordinary PC architecture. The retrieval of similar visual content frames is done in less than 20 seconds, in extreme cases, depending on the method used. This is considered a relevant result since the overall indexed video database corresponds to about 34 hours of broadcast. Although query semantics was not a major issue in this work, queries of the type "query for frames with small dissimilarity tolerance" usually carry some semantic aspects. Thus, for example, queries that return frames in which the broadcast news anchor appears in the foreground and the flag of the country reported by the news appears in the background involve some kind of semantics, since the subject "international news" might be associated to them. The evaluation or quantification of the semantic level of a query must be addressed in future work. The three query methods, by statistical features, by wavelet signatures "sketch" and by "example", are stable for the random frames test. The problem presented by this experiment was due mainly to the key frame extraction process. For better results, it is necessary to reduce the key frame loss in Journal of Information and Data Management, Vol. 1, No. 2, June 2010.
308
·
C. A. F. Pimentel Filho, C. A. S. Santos
the video parser module which in the other hand, would produce more redundancy in the database. REFERENCES Charles, C. An Introduction to Wavelets. Academic Press Professional, Inc., San Diego, USA, 1992. Daubechies, I. Ten Lectures on Wavelets. Society for Industrial and Applied Mathematics, Philadelphia, PA, USA, 1992. Deselaers, T. Features for Image Retrieval. Tech. rep., Rheinisch-Westfalische Technische Hochschule, Netherlands, 2003. DeVore, R. A., Jawerth, B. D., and Lucie, B. J. Image Compression Through Wavelet Transform Coding. IEEE Trans. Inform. Theory 38 (2): 719–746, 1992. Dimitrova, N., Zhang, H.-J., Shahraray, B., Sezan, I., Huang, T., and Zakhor, A. Applications of VideoContent Analysis and Retrieval. IEEE MultiMedia 9 (3): 42–55, 2002. Drew, M. S. and Au, J. Video Keyframe Production by Efficient Clustering of Compressed Chromaticity Signatures. In Proceedings of the ACM international Conference on Multimedia. pp. 365–368, 2000. Filho, C. A. F. P., Santos, C. A. S., and Buck, T. A. Integração de Métodos Baseados em Diferença de Quadros para Sumarização do Conteúdo de Vídeos. In Brazilian Symposium on Multimedia and Web. Vila Velha, Brazil, 2008. Filho, C. A. F. P., Santos, C. A. S., and Buck, T. A. Um Ambiente para Indexação e Recuperação de Conteúdo de Vídeo Baseado em Características Visuais. In Brazilian Symposium on Multimedia and Web. Fortaleza, Brazil, 2009. Flickner, M., Sawhney, H., Niblack, W., Ashley, J., Huang, Q., Dom, B., Gorkani, M., Hafner, J., Lee, D., Petkovic, D., Steele, D., and Yanker, P. Query by Image and Video Content: The QBIC System. Computer 28 (9): 23–32, 1995. Gertz, M., uwe Sattler, K., Gorin, F., and Michael Hogarth, J. S. Annotating Scientific Images: A Conceptbased Approach. In Proceedings of the International Conference on Scientific and Statistical Database Management. Washington, USA, pp. 59–68, 2002. Gonzalez, R. C. and Woods, R. E. Digital Image Processing. Prentice Hall, 2008. Guan, L., He, Y., Kung, S.-Y., Larsen, J., Kung, S., and Guan, L. Video Modeling and Retrieval. Multimedia Image and Video Processing. CRC Press, 2000. Hanjalic, A. and Zhang, H. An Integrated Scheme for Automated Video Abstraction Based on Unsupervised Cluster-Validity Analysis. IEEE Transaction on Circuits and Systems for Video Technology 9 (8): 1280–1289, 1999. Jacobs, C., Finkelstein, A., and Salesin, D. H. Fast Multiresolution Image Querying. In Annual Conference on Computer Graphics and Interactive Techniques. Los Angeles, USA, pp. 277–286, 1995. Liu, T., Rosenberg, C., and Rowley, H. A. Clustering Billions of Images with Large Scale Nearest Neighbor Search. In IEEE Workshop on Applications of Computer Vision. Applications of Computer Vision, IEEE Workshop on, 2007. Long, F., Zhang, H., and Feng, D. D. Fundamentals of Content-Based Image Retrieval. In D. D. Feng, W. C. Siu, and H. J. Zhang (Eds.), Multimedia Information Retrieval and Management: Technological Fundamentals and Applications. Springer, Berlin, pp. 1–26, 2003. Moores, C. Datacoding Applied to Mechanical Organization of Knowledge. Am. Doc. vol. 2, pp. 20–32, 1951. Santos, T. T. Segmentação Automática de Tomadas em Vídeo. M.S. thesis, Universidade de São Paulo, Brazil, 2004. Seinstra, F. J., Geusebroek, J.-M., Koelma, D., Snoek, C. G., Worring, M., and Smeulders, A. W. HighPerformance Distributed Video Content Analysis with Parallel-Horus. IEEE MultiMedia 14 (4): 64–75, 2007. Stollnitz, E. J., Derose, T. D., and Salesin, D. H. Wavelets for Computer Graphics: A Primer - Part 1. IEEE Computer Graphics and Applications 15 (3): 76–84, 1995. Truong, B. T. Search of Structural and Expressive Elements in Film Based on Visual Grammar. Ph.D. thesis, Department of Computing Science Curtin University of Technology, USA, 2004. Zhang, H., Wang, J. Y. A., and Altunbasak, Y. Content-Based Video Retrieval and Compression: A Unified Solution. In Proc. IEEE Int. Conf. Image Processing. Washington, USA, pp. 13–16, 1997.
Journal of Information and Data Management, Vol. 1, No. 2, June 2010.