algorithms Article
A New Fuzzy Harmony Search Algorithm Using Fuzzy Logic for Dynamic Parameter Adaptation Cinthia Peraza, Fevrier Valdez, Mario Garcia, Patricia Melin and Oscar Castillo * Tijuana Institute of Technology, c.p 22379 Tijuana, Mexico;
[email protected] (C.P.);
[email protected] (F.V.);
[email protected] (M.G.);
[email protected] (P.M.) * Correspondence:
[email protected]; Tel.: +52-664-6236318 Academic Editor: Yun-Chia Liang Received: 7 July 2016; Accepted: 30 September 2016; Published: 14 October 2016
Abstract: In this paper, a new fuzzy harmony search algorithm (FHS) for solving optimization problems is presented. FHS is based on a recent method using fuzzy logic for dynamic adaptation of the harmony memory accepting (HMR) and pitch adjustment (PArate) parameters that improve the convergence rate of traditional harmony search algorithm (HS). The objective of the method is to dynamically adjust the parameters in the range from 0.7 to 1. The impact of using fixed parameters in the harmony search algorithm is discussed and a strategy for efficiently tuning these parameters using fuzzy logic is presented. The FHS algorithm was successfully applied to different benchmarking optimization problems. The results of simulation and comparison studies demonstrate the effectiveness and efficiency of the proposed approach. Keywords: harmony search; fuzzy logic; dynamic parameter adaptation
1. Introduction In the literature, there is a wide variety of metaheuristic algorithms and this paper focuses on one of them, the harmony search algorithm (HS), which, as its name suggests, is inspired by music. In particular, it refers to jazz behavior of a musical orchestra, where the goal is to compose the most harmonious melody, as measured by aesthetic standards [1]. The HS method considers the following mathematical form that basically consists of three steps: harmony memory accepting (HMR), pitch adjusting (PArate) and randomization. The model is inspired by a musical orchestra. Musicians have three options to play tunes: the first is to play any melody that is already known in the memory; the second is to start playing a song that already exists and to adjust the tone as the melody progresses; and the third option is to play a tune at random that was never played before. The three steps mentioned above are essential to achieve optimal results for addressing a particular problem since each of them has a specific function, whether it is to explore or exploit the search space, thereby avoiding local optima and finding the global optimum. HS has many advantages over other algorithms: (a) it does not require complex calculations; (b) because the HS algorithm uses stochastic random search, derivative information is also unnecessary, although HS uses different concept derivatives based on human experiences [2]; and (c) it can be used in linear and nonlinear functions. The harmony search algorithm has been very successful in a wide variety of optimization problems, presenting several advantages with respect to traditional optimization techniques, as outlined in the following [3–5]. However, HS also has disadvantages, as is the case for all algorithms that move the parameters by trial and error—they can fall into local optima. Therefore, this paper presents a new method called fuzzy harmony search algorithm (FHS), which uses fuzzy logic for dynamically changing the algorithm parameters and thereby exploring and exploiting the search space at the right time in order to obtain the global optimum in the shortest possible time. Several fuzzy systems are used to perform dynamical parameter adaptation. The main scientific Algorithms 2016, 9, 69; doi:10.3390/a9040069
www.mdpi.com/journal/algorithms
Algorithms 2016, 9, 69
2 of 19
contribution in this paper is that currently there are methods and variants on the harmony search algorithm that use techniques to move its parameters, such as linear functions, statistical methods and other methods that help improve the convergence of the algorithm among others, but there is no method in the literature which adjusts the parameters using fuzzy logic. This is therefore the main scientific contribution, which is based on the study of parameters and performing experiments by trial and error, and in this way finding the best ranges for the outputs of the membership functions and fuzzy rules. In addition, a set of experiments was carefully performed to reveal the impact of control parameters when applied to benchmark mathematical functions, and a comparison with another method called the fuzzy bat algorithm [6] is presented. Similarly, there are papers on harmony search algorithm (HS) applications that use this algorithm to solve real world problems. To mention a few: self-adaptive harmony search algorithm for optimization [7] and a tabu harmony search-based approach to fuzzy linear regression [8], two improved harmony search algorithms for solving engineering optimization problems [9], combined heat and power economic dispatch by harmony search algorithm [5], a novel hybrid bat algorithm with harmony search for global numerical optimization [10], a hybrid Taguchi-harmony search algorithm for solving engineering optimization problems [11], and a dynamic multi-swarm particle swarm optimizer with harmony search [12]. There are also papers of different metaheuristic algorithms that could be considered as related work, including the firefly algorithm [13,14], the bat-inspired algorithm [15], differential evolution [16], virtual bee algorithms [17], hybridization of Particle swarm optimization (PSO) and Genetic Algorithms (GA) [18], fuzzy Particle swarm algorithm—a generalization of particle swarm optimization [19], and design of PSO-based fuzzy classification system [20]. The rest of the paper is organized as follows: Section 2 shows the methodology for parameter adaptation and describes the proposed methods. Section 3 shows the experimentation with the fuzzy system and benchmark mathematical functions. Section 4 presents simulation results and a comparison of the harmony search algorithm with fuzzy harmony search algorithm. Section 5 presents simulation results and a comparison of the fuzzy harmony search algorithm with the fuzzy bat algorithm. Section 6 offers a statistical comparison. Finally, Section 7 describes the conclusions. 2. Methodology for Parameter Adaptation Harmony search is relatively a new metaheuristic optimization algorithm inspired by music and was first proposed by Geem et al. in 2001 [1,21,22]. The HS algorithm is defined by Equations (1)–(3), which are the equations to control the exploitation and exploration of the search domain, respectively [10]. HMR ∈ [0, 1]
(1)
xnew = xold + b p (2 rand − 1)
(2)
Pa = Plower limit + Prange × rand
(3)
The HMR and PArate parameters introduced in the improvisation process help the algorithm to find globally and locally improved solutions. The traditional HS algorithm uses fixed values for the HMR and PArate parameters whereas the improvement suggested in [23] varies the PArate and bandwidth (bw) parameters throughout the iterations. Inspired by their modification, the paper presents a new fuzzy harmony search algorithm (FHS). Mathematical Description of the Fuzzy Harmony Search (FHS) Algorithm The mathematical description for FHS is defined as follows: Equation (1) shows the fundamental part of the traditional HS algorithm; where the harmony memory accepting (HMR) is represented by a constant value. Equation (2) shows the fundamental part of the traditional HS algorithm, where the
Algorithms 2016, 9, 69
3 of 19
pitch adjusting (PArate) is represented by a constant value. Equations (1) and (2) describe the different ways the basic equations of HS are modified for achieving the goal, and then, convert part of it into fuzzy parameters. The differences between both equations are that HMR in Equation (1) and PArate in Equation (2) are those that change, because an essential part of the proposed method lies in these two parameters. Traditionally, these two parameters are constant; in this case, due to the importance of these two parameters, they are converted into fuzzy parameters. Therefore, for designing the fuzzy systems, which dynamically adjust the HMR and PArate parameters, the measure of percentage of iterations is considered as the input. All the fuzzy systems are of Mamdani type because it is more common to use them in this type of fuzzy control and the defuzzification method is the centroid. In this case, this type of defuzzification was used because other researchers have achieved good results with this method. In this case, these values are considered fuzzy because they are changing dynamically when the FHS is running, and are defined by Equations (4) and (5), where HMR and PArate are changing values in the range [0,1]. r
hmr ( hmr ) hmr ∑i = 1i 1 µi rhmr hmr µ ∑i = 1 i
HMR =
(4)
where HMR is the harmony memory accepting rate; rhmr is the number of rules of the fuzzy system corresponding to hmr; hmr1i is the output result for rule i corresponding to hmr; µihmr is the membership function of rule i corresponding to hmr. r
PArate =
PArate ( PArate ) PArate ∑i = 1i 1 µi r PArate PArate µ ∑i = 1 i
(5)
where PArate is the pitch adjusting; r PArate is the number of rules of the fuzzy system corresponding to PArate; PArate1i is the output result for rule i corresponding to PArate; µiPArate is the membership function of rule i corresponding to PArate. Fuzzy logic is based on fuzzy set theory proposed by Zadeh in 1965, which helps us in modeling knowledge, through the use of if-then fuzzy rules. The fuzzy set theory provides a systematic calculus to deal with linguistic information, and that improves the numerical computation by using linguistic labels stipulated by membership functions [19,20]. The parameters of HMR and PArate are selected to be modified using fuzzy logic, since these parameters account for controlling the exploitation and exploration of the search domain. The HMR and PArate parameters in the HS algorithm are very important to fine-tuning the optimized solution vectors, and can be potentially useful in adjusting the convergence rate of the algorithm to find the optimal solution Therefore, the adjustment of these parameters is of great interest. There are three variants of the algorithm that have been applied to achieve better results and they are briefly explained in the following: The improved harmony search algorithm (IHS) [13] is a novel method for generating new solution vectors that enhance accuracy and convergence rate of harmony search (HS) algorithm; the global best harmony search (GHS) [24] is proposed in this paper where concepts from swarm intelligence are borrowed to enhance the performance of HS; and the new global harmony search (NGHS) [25] is a proposed new algorithm that includes two important operations—position updating and genetic mutation with a small probability. The former enables the worst harmony of the harmony memory to move to the global best harmony rapidly in each iteration, and the latter can effectively prevent the NGHS from trapping into the local optimum. It should be noted that none of these methods use fuzzy logic techniques to achieve their goals. The harmony search algorithm has been applied so far to various optimization problems: optimization of functions [9,14], the distribution of water, groundwater modeling, energy-saving clearance, structural design [26], vehicle routing, and others. The possibility of combining harmony search with other algorithms, such as particle swarm optimization and genetic algorithms has also been investigated.
Algorithms 2016, 9, 69
4 of 19
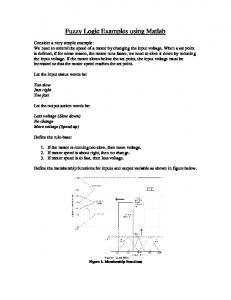
The parameter harmony memory accepting (HMR) represents the exploitation, and this will ensure that the best harmonies will be transferred to the new harmony memory. The parameter pitch adjustment (PArate) represents the exploration of this algorithm, and is similar to the mutation operator in genetic algorithms. A pitch adjustment rate (PArate) was used to control the degree of adjustment. The literature suggests the range of pitch adjustment to be between 0 and 1; this parameter in the original algorithm does not change during the iterations and some authors use this parameter in a range between 0.1 and 0.7. In the proposed model, the parameters change during iterations in the range 0.7 to 1 through the use of a fuzzy system to give diversity algorithm and finding the global optimum. Parameter randomization is used to increase the diversity of the solutions, and the use of randomization can further push the system to explore various regions with high diversity solutions in order to find the global optimum. The main difference between FHS and the traditional HS method is in the way they perform the adjusting of the HMR and PArate parameters. To improve the performance of the HS algorithm, the FHS algorithm considers the HMR and PArate as dynamic parameters in the improvisation step. FHS uses a fuzzy system to be responsible for dynamically changing the HMR and PArate parameters in the range from 0 to 1 and 0.7 to 1; this range is based on a detailed study of the behavior of the algorithm parameters after performing a series of experiments applied to optimization problems, since some items used different ranges in the original method [22] in each iteration number. In this case, the rules are used in increasing and decreasing form as shown in Figure 1. This method includes the input iterations of the algorithm, because other studies have found it favorable to consider this measure that can control the execution of the algorithm. In addition, it is also found that an algorithm performance measure, such as the iterations, needs to be considered in the parameter adaptation. In this work, all the above are taken into consideration for the fuzzy systems to modify the HMR and PArate parameters by dynamically changing these parameters in each iteration of the algorithm. In this phase, the percentage of elapsed iterations is considered to determine the values of HMR and PArate. If a low percentage of iterations elapses, the HMR and PArate parameters would take a low value in the range in order to enable a wide search in the search space, as a kind of exploration. On the contrary, if a high percentage of iterations have occurred, it would give the HMR and PArate parameters a high value in the indicated range in order to draw a more intense exploitation within the search space in advanced iterations. Subsequently, if the percentage of elapsed iterations is medium, then a medium value for HMR and PArate would occur, with the aim of expanding the above criteria. The following equation represents this idea [27]: Iteration =
Current Iteration Maximun of iterations
(6)
Therefore, for designing the fuzzy systems, which dynamically adjust the HMR and PArate parameters, the measure described above was considered as the input. Experiments were performed to test each parameter separately in order to check their behavior when applied to optimization problems with different fuzzy rules to increase or decrease, and eventually the two parameters in the output were put together to test the effectiveness of the method. The first proposed output of the fuzzy system is the HMR parameter, the second proposed output of the fuzzy system is the PArate parameter and for the third proposed fuzzy system, the outputs are both HMR and PArate parameters. The fuzzy systems use rules with increment and decrement and with ranges from 0 to 1 and from 0.7 to 1, respectively, for the experiments.
Algorithms 2016, 9, 69
5 of 19
Algorithms 2016, 9, 69
5 of 19
Figure 1. Proposal for fuzzy dynamic adaptation of HS. Figure 1. Proposal for fuzzy dynamic adaptation Figure 1. Proposal for fuzzy dynamic adaptation of HS.of HS.
The design of the input variable in all fuzzy systems can be found in Figure 2, which shows the Thedesign design of the input input variable in all fuzzy can bebe found in Figure 2, which shows the the The of variable inis allgranulated fuzzysystems systems can found in Figure 2, which shows input called “iteration”, and this input into three triangular membership functions. inputcalled called“iteration”, “iteration”, and this triangular membership functions. input this input inputisisgranulated granulatedinto intothree three triangular membership functions.
Low 1 Low
Medium Medium
Degree Degreeofofmembership membership
1
High High
0.8 0.8
0.6
0.6
0.4
0.4
0.2
0.2 0
0 0 0
0.1
0.1
0.2
0.2
0.3
0.3
0.4
0.5
0.6
Iteration 0.4
0.5
0.7
0.6
0.8
0.7
0.9
0.8
1
0.9
1
Iteration Figure 2. Input 1: Iteration. Figure 2.2.Input Figure Input1:1:Iteration. Iteration.
For the output variables, as mentioned above, the recommended values for HMR and PArate are from 0 to 1 and 0.7 to 1, so the output variables are designed using these ranges of values. Each output
Algorithms 2016, 9, 69 Algorithms 2016, 9, 69
6 of 19 6 of 19
Algorithms 9, 69 6 ofare 19 For 2016, the output variables, as mentioned above, the recommended values for HMR and PArate
Degreeofof membership Degree membership
For the output variables, as mentioned above, the recommended values for HMR and PArate are from 0 to 1 and 0.7 to 1, so the output variables are designed using these ranges of values. Each from 0 to 1 and 0.7 to 1, so the output variables are designed using these ranges of values. Each output is granulated into three triangular membership functions which are low, medium and high, is granulated into three triangular membership functions which are low, are medium and high,and andhigh, the output is granulated into three triangular membership functions which low, medium and the design of the HMR and PArate output variables can be found in Figures 3 and 4. design of the HMR and PArate output variables can be found in Figures 3 and 4. and the design of the HMR and PArate output variables can be found in Figures 3 and 4.
Medium Medium
Low 1 Low 1
High High
0.8 0.8 0.6 0.6 0.4 0.4 0.2 0.2 0 0 0.7 0.7
0.75 0.75
0.8 0.8
0.85 0.85 HMR HMR
0.9 0.9
0.95 0.95
1 1
Degreeofof membership Degree membership
Figure 3. Output of Fuzzy System 1: HMR (Harmony Memory Accepting Parameter). Figure3.3. Output Output of of Fuzzy FuzzySystem System1:1: HMR HMR (Harmony (Harmony Memory MemoryAccepting AcceptingParameter). Parameter). Figure
Low 1 Low 1
Medium Medium
High High
0.8 0.8 0.6 0.6 0.4 0.4 0.2 0.2 0 0 0.7 0.7
0.75 0.75
0.8 0.8
0.85 0.85 PArate PArate
0.9 0.9
0.95 0.95
1 1
Figure 4. 4. Output Output of of Fuzzy Fuzzy System System 2: 2: PArate PArate (Pitch (Pitch Adjustment Adjustment Parameter). Parameter). Figure Figure 4. Output of Fuzzy System 2: PArate (Pitch Adjustment Parameter).
Having defined defined the possible possible output variables, variables, it was decided decided to combine combine them to to generate Having Having defined the the possible output output variables, itit was was decided to to combine them them to generate generate different fuzzy systems for the dynamic adjustment of HMR and PArate. Based on the literature the different different fuzzy fuzzy systems systems for for the the dynamic dynamic adjustment adjustment of of HMR HMR and and PArate. PArate. Based Based on on the theliterature literature the the recommended values for the parameters are from 0 to 1, so in this case the range 0 to 1 and 0.7 to 1 recommended recommended values values for for the the parameters parameters are are from from 00 to to 1, 1, so so in in this this case case the the range range 00 to to 11 and and 0.7 0.7 to to 11 were used used for the the outputs in in the fuzzy fuzzy system. There There are 12 12 possible fuzzy fuzzy systems, in in this case case only were were usedfor for theoutputs outputs inthe the fuzzysystem. system. There are are 12 possible possible fuzzy systems, systems, in this this case only only the three fuzzy systems using a range 0.7 to 1 are presented, using rules to increase because these the the three three fuzzy fuzzy systems systems using using aa range range 0.7 0.7 to to 11 are arepresented, presented, using using rules rules to to increase increase because because these these algorithms achieve achieve better results, results, which are are definedbelow. below. algorithms algorithms achievebetter better results,which which aredefined defined below. The first first fuzzy system system has iteration iteration as input input and HMR HMR as output, output, which is shown in Figure 5. The The first fuzzy fuzzy system has has iteration as as input and and HMR as as output, which which is is shown shown in in Figure Figure 5. 5. The second fuzzy system has iteration as input and PArate as output and is shown in Figure 6. The The second fuzzy system has iteration as input and PArate as output and is shown in Figure 6. The The second fuzzy system has iteration as input and PArate as output and is shown in Figure 6.third The third fuzzy system has iteration as input and the outputs are HMR and PArate, as shown in Figure 7. fuzzy system has iteration as input the outputs are HMR PArate, as shown in Figure 7. third fuzzy system has iteration as and input and the outputs are and HMR and PArate, as shown in Figure 7. The first fuzzy system is defined by the following design, using as input the iterations and as The The first first fuzzy fuzzy system system isis defined defined by by the thefollowing following design, design, using using as as input input the the iterations iterations and and as as output in in this case case the harmony harmony memory accepting accepting (HMR) to to dynamically vary vary the first first parameter output output in this this case the the harmony memory memory accepting (HMR) (HMR) to dynamically dynamically vary the the firstparameter parameter that within within the the algorithm algorithm represents represents the the exploitation, exploitation, which which is is the the number number of of solutions solutions that that will will be that that within the algorithm represents the exploitation, which is the number of solutions that will be be considered for the subsequent iteration, as shown in Figure 5. considered consideredfor forthe thesubsequent subsequentiteration, iteration,as asshown shownin inFigure Figure5.5.
Algorithms 2016, 9, 69 Algorithms 2016, 2016, 9, 9, 69 69 Algorithms Algorithms 2016, 9, 69
of 19 19 77 of 7 of 19
FHS1 FHS1 FHS1 rules 333 rules rules Iteration (3) (3) Iteration Iteration (3)
HMR (3) (3) HMR HMR (3)
Figure 5. 5. Fuzzy Fuzzy System System for for Increasing Increasing HMR. HMR. Figure Figure forIncreasing Increasing HMR. Figure5.5.Fuzzy Fuzzy System System for HMR. The second second fuzzy fuzzy system system is is defined defined by by the the following following design, design, using using as as input input the the iterations iterations and and as as The The second second fuzzy system is by design, using asas input the iterations and as The fuzzy system isdefined defined bythe thefollowing following design, using input the iterations and output the pitch adjusting (PArate) to dynamically vary the second parameter that represents the output the pitch adjusting (PArate) to dynamically vary the second parameter that represents the output the pitch adjusting (PArate) to dynamically vary the second parameter that represents the as output theinpitch adjusting (PArate) to dynamically the secondofparameter that represents exploration the algorithm, algorithm, which can can be viewed viewed as asvary refinement local solutions, solutions, as shown shownthe in exploration in the which be aa refinement of local as in exploration in in the the algorithm, algorithm, which which can can be be viewed viewed as as aa refinement refinement of of local local solutions, solutions, as as shown shown in in exploration Figure 6. 6. Figure Figure 6. 6. Figure
FHS2 FHS2 FHS2 rules 333 rules rules PArate (3) (3) PArate PArate (3)
Iteration (3) (3) Iteration Iteration (3)
Figure 6. Fuzzy System System for for Increasing Increasing PArate. PArate. 6. Fuzzy PArate. Figure Figure 6. Fuzzy System for Increasing PArate.
The third third fuzzy fuzzy system, system, which which is is composed composed of of the the following following design, design, uses uses as as input input the the iterations iterations The The The third fuzzy system, which is composed of the following design, uses as input the iterations and as as outputs outputs the the HMR HMR and and PArate PArate parameters parameters to to move move both both parameters parameters dynamically. dynamically. For For this this case, case, and and and as as outputs outputs the the HMR HMR and and PArate PArate parameters parameters to to move move both both parameters parameters dynamically. dynamically. For For this this case, case, combination of ofrules rulesbased basedon onthe theresults resultsofof ofthe thetwo twoprevious previous fuzzy systems is made, as illustrated aaa combination rules based on the results the two previous fuzzy systems is made, as illustrated fuzzy systems is made, as illustrated in a combination of rules based on the results of the two previous fuzzy systems is made, as illustrated in Figure Figure 7. in 7. Figure 7. in Figure 7.
FHS3 FHS3 FHS3
Iteration (3) (3) Iteration Iteration (3)
HMR (3) (3) HMR HMR (3)
rules 333 rules rules PArate (3) (3) PArate PArate (3)
HMR and and PArate. PArate. Figure 7. 7. Fuzzy Fuzzy System System for for Increasing Increasing HMR PArate. Figure Figure 7. Fuzzy System for Increasing HMR and PArate.
To design designthe therules rules of each each fuzzy system, was decided decided that in in early iterations iterations the HS HS To of of each fuzzy system, it wasititdecided that in that early iterations the HS algorithm To design the rules fuzzy system, was early the To design the rules of each fuzzy system, it was decided that in early iterations the HS algorithm must explore and eventually eventually exploit. must explore and eventually exploit. exploit. algorithm must explore and algorithm must explore and eventually exploit. The rules rules for for the the fuzzy fuzzy system system number number 11 are are shown shown in in Figures Figures 88 and and 9, 9, the the rules rules for for the the fuzzy fuzzy The The rules for the fuzzy system number 1 are shown in Figures 8 and 9, the rules for the fuzzy system number 2 are shown in Figures10 and 11and the rules for the fuzzy system number are 10 and 11and 11 andthe therules rulesfor for the the fuzzy system number 33 are system number 2 are shown in Figures Figures10 system number 2 are shown in Figures10 and 11and the rules for the fuzzy system number 3 are in Figures Figures 12 12 and and 13, 13, respectively. respectively. shown in respectively. shown shown in Figures 12 and 13, respectively. rules given in Figure are those used inin the fuzzy system 1, and and areare defined to increase increase the The given in Figure arethose thoseused used the fuzzy system 1, and defined to increase The rules given in Figure 888are in the fuzzy system 1, are defined to the The rules given in Figure 8 are those used in the fuzzy system 1, and are defined to increase the HMR parameter according to the iterations to achieve better exploration and exploitation of the the HMR parameter according to the iterations achievebetter betterexploration explorationand andexploitation exploitationof the HMR parameter according to the iterations to to achieve HMR parameter according to the iterations to achieve better exploration and exploitation of the space. search space. search search space.
Algorithms 2016, 9, 69 Algorithms 2016, 2016, 9, 9, 69 69 Algorithms Algorithms 2016, 2016, 9, 9, 69 69 Algorithms
8 of 19 of 19 19 88 of of 19 19 88 of
Figure 8. Rules Rules for Fuzzy Fuzzy System totoIncrease Increase (FHS1). Figure 8. Rules for Fuzzy System Increase (FHS1). (FHS1). Figure 8. for System 11 1to Figure 8. 8. Rules Rules for for Fuzzy Fuzzy System System 11 to to Increase Increase (FHS1). (FHS1). Figure The rules rules given given in in Figure Figure 99 are are those those used used also also for for the the fuzzy fuzzy system system 1, 1, which which are are defined defined for for The those fuzzy The rules given in Figure 9 are those used also for the fuzzy system 1, which are defined for The rules given in Figure 9 are those used also for the fuzzy system 1, which are defined for decreasing the the HMR HMR parameter parameter to to achieve achieveexploitation exploitationand andexploration explorationof ofthe thesearch searchspace. space. decreasing the HMR parameter to achieve exploitation and exploration of the search space. decreasing the the HMR HMR parameter parameter to to achieve achieve exploitation exploitation and and exploration exploration of of the the search search space. space. decreasing
Figure 9. 9. Rules Rules for for Fuzzy Fuzzy System System 11 to to Decrease Decrease (FHS1). (FHS1). Figure Figure Rulesfor forFuzzy Fuzzy System (FHS1). Figure 9. 9. Rules System111toto toDecrease Decrease (FHS1). Figure 9. Rules for Fuzzy System Decrease (FHS1). The rules rules given given in in Figure Figure 10 10 are are those those used used in in the the fuzzy fuzzy system system 2, 2, in in this this case case for for increasing increasing the the The The rules in 10 used in system 2, The rules given given in Figure Figure 10 are are those those used in the the fuzzy fuzzy system 2, in in this this case case for for increasing increasing the the The rules given in Figure 10 are those used in the fuzzy system 2, in this case for increasing the PArate parameter to achieve exploration and exploitation of the search space. PArateparameter parameterto toachieve achieveexploration explorationand andexploitation exploitationof ofthe thesearch searchspace. space. PArate PArate parameter parameter to to achieve achieve exploration exploration and and exploitation exploitation of of the the search search space. space. PArate
Figure 10. 10. Rules Rules for for Fuzzy Fuzzy System System 22 to to Increase Increase (FHS2). (FHS2). Figure Figure 10.10. Rules for Fuzzy System222toto toIncrease Increase (FHS2). Figure Rulesfor forFuzzy Fuzzy System System (FHS2). Figure 10. Rules Increase (FHS2). The rules rules given given in in Figure Figure 11 11 are are those those used used in in the the fuzzy fuzzy system system 2, 2, but but now now for for decreasing decreasing the the The The rules given in Figure 11 are those used in the fuzzy system 2, but now for decreasing the The rules given in Figure 11 are those used in the fuzzy system 2, but now for decreasing the PArate parameter parameter to to achieve achieve exploitation exploitation and and exploration exploration of of the the search search space. space. PArate PArateparameter parameterto toachieve achieveexploitation exploitationand andexploration explorationof ofthe thesearch searchspace. space. PArate PArate parameter to achieve exploitation and exploration of the search space.
Figure 11. 11. Rules Rules for for Fuzzy Fuzzy System System 22 to to Decrease Decrease (FHS2). (FHS2). Figure Figure 11. 11. Rules Rules for for Fuzzy Fuzzy System System 22 to to Decrease Decrease (FHS2). (FHS2). Figure Figure 11. Rules for Fuzzy System 2 to Decrease (FHS2). The rules rules given given in in Figure Figure 12 12 are are used used in in the the fuzzy fuzzy system system 3, 3, which which are are aa combination combination of of the the two two The The rules rules given in in to Figure 12 are are used used in theexploit fuzzy system system 3, which which are aa combination combination of of the the two two The given Figure 12 in the fuzzy 3, are parameters in increase first explore and then the search space. The rules given in Figure 12 are used in the fuzzy system 3, which are a combination of the two parameters in increase to first explore and then exploit the search space. parameters in increase increase to first explore explore and then then exploit the search search space. parameters in to first and exploit the space. The rules rules given in into Figure 13 are are used used in the third fuzzy fuzzy system, which are are another another combination combination parameters in increase first explore and then exploit the search space. The given Figure 13 in the third system, which The rules given in Figure 13 are used in the third fuzzy system, which are another combination The rules given in Figure 13 are used in the third fuzzy system, which are another combination of the the two parameters in decrease toused first in exploit andfuzzy then explore explore the search space. combination of The rules given in in Figure 13 are the third system,the which are space. another of two parameters decrease to first exploit and then search of the the two two parameters parameters in in decrease decrease to to first first exploit exploit and and then then explore explore the the search search space. space. of the two parameters in decrease to first exploit and then explore the search space.
Figure 12. 12. Rules Rules for for Fuzzy Fuzzy System System 33 to to Increase Increase (FHS3). (FHS3). Figure Figure 12. 12. Rules Rules for for Fuzzy Fuzzy System System 33 to to Increase Increase (FHS3). (FHS3). Figure
Figure 11. Rules for Fuzzy System 2 to Decrease (FHS2). The rules given in Figure 12 are used in the fuzzy system 3, which are a combination of the two parameters in increase to first explore and then exploit the search space. Algorithms 9, given 69 9 of 19 The2016, rules in Figure 13 are used in the third fuzzy system, which are another combination of the two parameters in decrease to first exploit and then explore the search space.
Algorithms 2016, 9, 69
Figure 12.12.Rules System33totoIncrease Increase (FHS3). Figure Rulesfor forFuzzy Fuzzy System (FHS3).
9 of 19
Figure 13.13.Rules Decrease (FHS3). Figure Rulesfor forFuzzy Fuzzy System System 33totoDecrease (FHS3). 3. Experimentation Experimentationwith withthe theFuzzy FuzzySystems Systemsin inHarmony Harmony Search Search for for Benchmark Benchmark Mathematical Mathematical Functions Functions For all the the experiments experimentsused, used,the theparameters parametersare arepresented presented Table 1. For all the functions, For all in in Table 1. For all the functions, the the global minimum is zero. proposed method six mathematical functions—some simple global minimum is zero. TheThe proposed method usedused six mathematical functions—some simple and and more complicated—in order to test algorithm andmeasure measureits itseffectiveness. effectiveness.In In this this case, case, somesome more complicated—in order to test thethe algorithm and ten dimensions in each problem were used, as the literature suggests this number for the first tests. ten dimensions in each problem were used, as the literature suggests this number for the first tests. We it with the the bat algorithm method whichwhich also uses dimensions. Once you validate Wethen thencompare compare it with bat algorithm method alsoten uses ten dimensions. Once you the performance of the method it will apply to problems of control. validate the performance of the method it will apply to problems of control. Table Table 1. 1. Parameters Parameters for for each each of of the the methods. methods.
Parameter Simple Simple HS Parameter HS Harmonies Harmonies Iterations Iterations HMR HMR PArate PArate
4 4toto 4040 1000 1000 0.95 0.95 0.7 0.7
FHS1 FHS1
FHS2 FHS2
4 4toto4040 44toto4040 1000 1000 1000 1000 Dynamic 0.95 Dynamic 0.95 0.7 Dynamic 0.7 Dynamic
FHS3 FHS3 44 to 40 to 40 1000 1000 Dynamic Dynamic Dynamic Dynamic
Table 11 shows shows the the parameters parameters of the methods to be considered in the comparison; in this case, Table of the the proposed proposed method method (FHS) (FHS) and and the the simple simple HS HS algorithm. algorithm. the comparison of HS without without parameter parameter Also for the comparison of the proposed method with respect to the HS adaptation, parameters that give the global minimum of each of the the six six benchmark benchmark mathematical mathematical be found. found. In Figure 14, 14, there there is is aa sample sample of of the the functions functions that that are are used used [28,29]. [28, 29]. functions have to be indicatedininFigure Figure14,14, functions of ten dimensions for experiments the experiments considered. As indicated functions of ten dimensions for the were were considered. Once Once the systems fuzzy systems that dynamically adjust the parameters ofdefined, HS are defined, and the to problem the fuzzy that dynamically adjust the parameters of HS are and the problem which to which this isisapplied defined (benchmark mathematical functions), the proposal is as this is applied definedis(benchmark mathematical functions), the proposal is as shown inshown Figure in 1, Figure 1, where it can be observed that the harmony memory accepting (HMR) and pitch adjustment where it can be observed that the harmony memory accepting (HMR) and pitch adjustment (PArate) (PArate) parameters are adjusted by system, a fuzzy and system, andthis in turn thisHS” ‘‘fuzzy HS’’ searches for the parameters are adjusted by a fuzzy in turn “fuzzy searches for the optimal optimal parameters for the benchmark mathematical [30]. parameters for the benchmark mathematical functionsfunctions [30].
Algorithms 2016, 9, 69 Algorithms 2016, 9, 69
10 of 19 10 of 19
Figure mathematical functions. Figure14. 14.Benchmark Benchmark mathematical functions.
Experiment Results the Simple Harmony Search Algorithm withwith Fuzzy 4.4. Experiment ResultsComparison Comparisonofof the Simple Harmony Search Algorithm Fuzzy HarmonySearch Search Harmony Inthis this section, section, the the experimental byby thethe Harmony Search algorithm andand fuzzy In experimentalresults resultsobtained obtained Harmony Search algorithm fuzzy harmony search are shown in separate tables of the 12 proposed fuzzy systems. harmony search are shown in separate tables of the 12 proposed fuzzy systems. The results results obtained obtained using sixsix benchmark mathematical functions, The usingthe theoriginal originalmethod, method,with with benchmark mathematical functions, are presented in Table 2. It should be noted that the best, worst and average of 30 experiments are are are presented in Table 2. It should be noted that the best, worst and average of 30 experiments shownfor foreach each mathematical mathematical function. shown function. Table harmony search algorithm. Table 2. 2. Results Resultsobtained obtainedusing usingthe the harmony search algorithm.
Simple Harmony Search Harmony Search Function Simple Best Worst Average Function Best− 05 1.49 Worst 2.36 − 04 6.57 −Average 05 Spherical 1.47 −−05 11 1.31 − 02 − 04 − 05 Rosenbrock 2.36E Spherical 1.49E − 044.88 6.57E 9.31 −−11 12 2.24 − 07 − 08 − 04 Rosenbrock 1.47E 1.31E − 022.26 4.88E Rastrigin Rastrigin 9.31E − 12 2.24E − 07 2.26E 8.72 − 06 4.54 − 04 1.18 − 04 − 08 Ackley Ackley 8.72E − 06 4.54E − 04 1.18E 7.33 − 05 1.80 − 03 2.71 − 04 − 04 Zakharov Zakharov 7.33E − 05 1.80E − 03 2.71E − 04 Sum Square 4.82 − 06 1.05 − 04 3.59 − 05 Sum Square 4.82E − 06 1.05E − 04 3.59E − 05 In Table 2, the overall averages obtained for each mathematical function are presented. The first In Table 2, the overall obtained for each mathematical functionrepresents are presented. The first column represents the bestaverages values of the experiments, the second column the worst column represents the best values of the experiments, the second column represents the worst values values of the experiments and the third column represents the averages of the experiments with the oforiginal the experiments and the third column represents the averages of the experiments with the original harmony search algorithm. The search first proposal made by this method was to perform the dynamic adjustment of parameters harmony algorithm. applied theproposal first parameter ofthis the method algorithm, which is the harmony memory accepting (HMR). The to first made by was to perform the dynamic adjustment of parameters This was created to dynamically change this parameter in the range that indicates the literature, applied to the first parameter of the algorithm, which is harmony memory accepting (HMR). which is from 0 toto1.dynamically This methodology was applied to the in sixthe benchmark mathematical functions This was created change this parameter range that indicates the literature, previously mentioned and 30 experiments were performed with each of these functions. Table 3 which is from 0 to 1. This methodology was applied to the six benchmark mathematical functions shows the results. previously mentioned and 30 experiments were performed with each of these functions. Table 3 shows the results.
Algorithms 2016, 9, 69
11 of 19
In Table 3, the overall averages, as well as best and worst results obtained for each mathematical function and method can be found. The results obtained with the FHS1 using the range of 0 to 1 using rules increment and decrement are presented. Table 3. Comparison of results obtained with the FHS1 using fuzzy logic to increase and decrease of the HMR parameter in the range 0 to 1. FHS1 Rules Increase in Range 0 to 1
FHS1 Rules Decrease in Range 0 to 1
Function
Best
Worst
Average
Function
Best
Worst
Average
Spherical Rosenbrock Rastrigin Ackley Zakharov Sum Square
1.22E − 04 1.18E − 12 2.65E − 07 8.23E − 05 2.00E − 03 4.30E − 04
1.31E − 01 9.24E − 06 2.00E + 00 4.35E − 01 1.38E + 02 1.00E + 00
4.71E − 03 3.04E − 07 5.69E − 02 1.72E − 01 2.04E + 00 3.33E − 02
Spherical Rosenbrock Rastrigin Ackley Zakharov Sum Square
2.10E − 03 4.46E − 16 4.70E − 10 6.64E − 05 1.01E + 00 3.70E − 02
4.90E − 01 2.01E − 09 3.23E − 06 1.80E − 03 1.47E + 01 9.08E + 00
1.19E − 01 1.18E − 10 3.35E − 07 6.50E − 04 6.67E + 00 2.38E + 00
Based on the previous experiments, the range of 0.7 to 1 for the HMR output was used. In the literature, it is recommended to use this parameter in the range from 0.7 to 0.95 to obtain better results, but in many existing works they use the range up to 0.99 and 1, hence the experiments were performed by trial and error. Table 4 shows the results obtained with this modification. Table 4. Results obtained with FHS1 using fuzzy logic to increase and decrease HMR with a range from 0.7 to 1, applied to six benchmark mathematical functions. FHS1 Rules Increase in Range 0.7 to 1
FHS1 Rules Decrease in Range 0.7 to 1
Function
Best
Worst
Average
Function
Best
Worst
Average
Spherical Rosenbrock Rastrigin Ackley Zakharov Sum Square
2.45E − 09 2.95E − 11 1.06E − 11 1.00E − 09 1.30E − 13 2.30E − 09
3.52E − 04 6.88E − 05 9.32E − 08 5.09E − 04 9.54E − 04 5.70E − 05
5.28E − 05 6.33E − 07 1.36E − 08 7.87E − 05 1.25E − 04 3.72E − 06
Spherical Rosenbrock Rastrigin Ackley Zakharov Sum Square
4.94E − 04 1.81E − 13 1.32E − 09 3.31E − 05 3.55E − 01 1.58E − 02
2.91E − 01 1.35E − 08 2.07E − 06 1.40E − 03 1.27E + 01 5.47E + 00
5.12E − 02 1.88E − 09 1.88E − 07 4.60E − 04 3.41E + 00 9.28E − 01
In Table 4, the averages of the 30 experiments for each mathematical function are shown, in addition to the best and worst results obtained for each mathematical function and the overall average obtained in each function. The results of these experiments suggest the use of the range of 0.7 to 1 with the proposed method as shown in Table 5. Table 5. Comparison of results obtained with FHS1 and the harmony search algorithm. Simple Harmony Search
FHS1 Rules Increase in Range 0.7 to 1
Function
Best
Worst
Average
Function
Best
Worst
Average
Spherical Rosenbrock Rastrigin Ackley Zakharov Sum Square
2.36E − 05 1.47E − 11 9.31E − 12 8.72E − 06 7.33E − 05 4.82E − 06
1.49E − 04 1.31E − 02 2.24E − 07 4.54E − 04 1.80E − 03 1.05E − 04
6.57E − 05 4.88E − 04 2.26E − 08 1.18E − 04 2.71E − 04 3.59E − 05
Spherical Rosenbrock Rastrigin Ackley Zakharov Sum Square
2.45E − 09 2.95E − 11 1.06E − 11 1.00E − 09 1.30E − 13 2.30E − 09
3.52E − 04 6.88E − 05 9.32E − 08 5.09E − 04 9.54E − 04 5.70E − 05
5.28E − 05 6.33E − 07 1.36E − 08 7.87E − 05 1.25E − 04 3.72E − 06
In Table 5, the averages of the 30 experiments for each mathematical function are shown, as well as the best and worst results for each mathematical function and the overall average. The results are with the original algorithm and the best fuzzy system, in this case FHS1, with rules and increase in the output range from 0.7 to 1. The best results obtained are of the proposed method.
Algorithms 2016, 9, 69
12 of 19
The second proposal made by this method was to perform the dynamic adjustment of parameters applied to the second parameter of the algorithm, which is the pitch adjustment (PArate). This was created to dynamically change this parameter in the range indicated in the literature, which is from 0 to 1. This methodology was applied to the six previously mentioned benchmark mathematical functions of which 30 experiments are performed. Table 6 shows the results obtained with this modification. Table 6. Results obtained with FHS2 using fuzzy logic to increase and decrease PArate with 0 to 1 range applied to six benchmark mathematical functions. FHS2 Rules Increase in Range 0 to 1
FHS2 Rules Decrease in Range 0 to 1
Function
Best
Worst
Average
Function
Best
Worst
Average
Spherical Rosenbrock Rastrigin Ackley Zakharov Sum Square
1.19E − 04 1.20E − 12 3.66E − 11 6.86E − 06 3.40E − 03 2.20E − 03
1.01E − 02 1.51E − 08 6.40E − 07 7.98E − 04 3.29E + 00 1.26E − 01
1.14E − 03 7.31E − 10 6.42E − 08 2.30E − 04 7.89E − 01 2.00E − 02
Spherical Rosenbrock Rastrigin Ackley Zakharov Sum Square
3.02E − 05 7.01E − 13 1.62E − 10 1.49E − 05 2.40E − 03 7.08E − 04
1.54E − 02 1.58E − 09 2.76E − 06 9.57E − 04 3.86E + 00 1.26E − 01
9.06E − 04 1.34E − 10 2.86E − 07 2.36E − 04 7.74E − 01 1.33E − 02
In Table 6, the overall averages, best and worst obtained for each mathematical function and each method can be found. The results obtained with the FHS2 using the range of 0 to 1 and rules increment or decrement are presented. In Table 7, the averages of the 30 experiments for each mathematical function are shown. The best and worst results obtained for each mathematical function, and the overall averages obtained in each function are also shown. The results of these experiments are the best ones in the range of 0.7 to 1 and rules increment with the proposed method is as shown in Table 8. Table 7. Results obtained with FHS2 using fuzzy logic to increase and decrease PArate with a range from 0.7 to 1, applied to 6 benchmark mathematical functions. FHS2 Rules Increase in Range 0.7 to 1
FHS2 Rules Decrease in Range 0.7 to 1
Function
Best
Worst
Average
Function
Best
Worst
Average
Spherical Rosenbrock Rastrigin Ackley Zakharov Sum Square
1.54E − 09 5.44E − 14 1.20E − 11 1.07E − 08 1.10E − 10 2.06E − 08
2.64E − 04 2.80E − 10 1.28E − 07 4.28E − 04 7.55E − 04 5.50E − 06
1.38E − 05 1.76E − 11 1.08E − 08 9.55E − 06 4.72E − 05 2.53E − 06
Spherical Rosenbrock Rastrigin Ackley Zakharov Sum Square
5.15E − 14 4.14E − 14 c1.44E − 10 4.31E − 05 6.91E − 04 1.00E − 03
7.60E − 03 8.64E − 10 2.58E − 06 2.00E − 03 3.54E + 00 5.70E − 03
9.08E − 04 7.31E − 11 2.22E − 07 4.98E − 04 5.94E − 01 3.13E − 03
Table 8. Comparison results obtained with FHS2 and the harmony search algorithm. Simple Harmony Search
FHS2 Rules Increase in Range 0.7 to 1
Function
Best
Worst
Average
Function
Best
Worst
Average
Spherical Rosenbrock Rastrigin Ackley Zakharov Sum Square
2.36E − 05 1.47E − 11 9.31E − 12 8.72E − 06 7.33E − 05 4.82E − 06
1.49E − 04 1.31E − 02 2.24E − 07 4.54E − 04 1.80E − 03 1.05E − 04
6.57E − 05 4.88E − 04 2.26E − 08 1.18E − 04 2.71E − 04 3.59E − 05
Spherical Rosenbrock Rastrigin Ackley Zakharov Sum Square
1.54E − 09 5.44E − 14 1.20E − 11 1.07E − 08 1.10E − 10 2.06E − 08
2.64E − 04 2.80E − 10 1.28E − 07 4.28E − 04 7.55E − 04 5.50E − 06
1.38E − 05 1.76E − 11 1.08E − 08 9.55E − 06 4.72E − 05 2.53E − 06
In Table 8, the averages of the 30 experiments for each mathematical function are shown, in addition to the best and worst results obtained for each mathematical function and the overall averages obtained in each function for each method. The results are with the original algorithm and
Algorithms 2016, 9, 69
13 of 19
the best fuzzy system, in this case FHS2 with rules and increase in the output range from 0.7 to 1. The best results obtained are of the proposed method. The third proposal was proposed to make dynamic the HMR and PArate parameters in the range from 0.7 to 1, both for increasing and decreasing the parameters. In Table 9, the overall averages, as well as best and worst obtained for each mathematical function and method, are presented. The results were obtained with the FHS3 using the range of 0 to 1 and rules increment or decrement are shown. In Table 10, the averages of the 30 experiments for each mathematical function are shown; also the best and worst results for each mathematical function and the overall average in each function are shown. The results of these experiments use the range of 0.7 to 1 and rules in increment with the proposed method. Table 9. Comparison of results obtained with FHS 3 using fuzzy logic rules for increasing and decreasing using the range 0 to 1 for the two outputs. FHS3 Rules Increase in Range 0 to 1
FHS3 Rules Decrease in Range 0 to 1
Function
Best
Worst
Average
Function
Best
Worst
Average
Spherical Rosenbrock Rastrigin Ackley Zakharov Sum Square
1.44E − 05 5.20E − 11 1.66E − 06 1.70E − 03 5.00E − 05 8.42E − 05
2.33E + 00 5.28E − 06 1.13E + 00 4.04E + 00 8.30E − 01 9.40E − 04
4.96E − 01 1.34E − 07 1.28E − 01 8.59E − 01 6.35E − 02 3.40E − 04
Spherical Rosenbrock Rastrigin Ackley Zakharov Sum Square
1.30E − 03 2.14E − 12 6.60E − 10 1.50E − 03 8.77E − 01 1.74E − 02
4.60E − 01 6.50E − 09 2.63E − 06 4.86E − 01 2.23E + 01 6.79E + 00
1.23E − 01 5.46E − 10 2.80E − 07 1.32E − 01 7.02E + 00 1.34E + 00
Table 10. Comparison of results obtained with FHS 3 using fuzzy logic rules for increasing and decreasing using the range 0.7 to 1 for the two outputs. FHS3 Rules Increase in Range 0.7 to 1
FHS3 Rules Decrease in Range 0.7 to 1
Function
Best
Worst
Average
Function
Best
Worst
Average
Spherical Rosenbrock Rastrigin Ackley Zakharov Sum Square
3.74E − 06 3.55E − 15 3.52E − 11 1.12E − 05 9.73E − 05 6.43E − 05
1.11E − 04 1.08E − 10 1.62E − 07 6.40E − 04 1.14E − 01 2.00E − 03
3.39E − 05 9.52E − 12 2.52E − 08 1.73E − 04 1.69E − 03 6.33E − 04
Spherical Rosenbrock Rastrigin Ackley Zakharov Sum Square
2.03E − 06 2.55E − 14 7.60E − 12 1.53E − 06 3.46E − 05 2.87E − 05
5.68E − 05 8.56E − 11 3.66E − 07 6.25E − 04 1.80E + 00 9.26E − 04
1.59E − 05 9.30E − 12 3.51E − 08 1.68E − 04 8.79E − 02 2.52E − 04
In Table 11, the averages of the 30 experiments for each mathematical function are shown. The best and worst results for each mathematical function and the overall average obtained in each function for each method are also shown. The results are with the original algorithm and the best fuzzy system, in this case FHS3 with rules in increase in the output range from 0.7 to 1. The results obtained in this case are better only in two benchmark functions; other evidence is not significant since similar results are obtained. Table 11. Comparison results obtained with FHS3 and the harmony search algorithm. Simple Harmony Search
FHS3 Rules Increase in Range 0.7 to 1
Function
Best
Worst
Average
Function
Best
Worst
Average
Spherical Rosenbrock Rastrigin Ackley Zakharov Sum Square
2.36E − 05 1.47E − 11 9.31E − 12 8.72E − 06 7.33E − 05 4.82E − 06
1.49E − 04 1.31E − 02 2.24E − 07 4.54E − 04 1.80E − 03 1.05E − 04
6.57E − 05 4.88E − 04 2.26E − 08 1.18E − 04 2.71E − 04 3.59E − 05
Spherical Rosenbrock Rastrigin Ackley Zakharov Sum Square
3.74E − 06 3.55E − 15 3.52E − 11 1.12E − 05 9.73E − 05 6.43E − 05
1.11E − 04 1.08E − 10 1.62E − 07 6.40E − 04 1.14E − 01 2.00E − 03
3.39E − 05 9.52E − 12 2.52E − 08 1.73E − 04 1.69E − 03 6.33E − 04
Algorithms 2016, 9, 69 Algorithms 2016, 9, 69
14 of 19 14 of 19
The results of an analysis of Tables 2 to 11 applying the three proposed fuzzy systems to benchmark mathematical functions using output the range of proposed 0 to 1 with increment decrement The results of an analysis of Tables 2–11the applying three fuzzy systemsand to benchmark rules, as well functions as the range 0.7output to 1 with in 1increment and decrement, are rules, compared in mathematical usingofthe rangerules of 0 to with increment and decrement as well Table 12. as the range of 0.7 to 1 with rules in increment and decrement, are compared in Table 12. Table 12. 12. Comparison of results results obtained obtained with with all all the the proposed proposed methods. methods.
Function Simple HS FHS1 Simple HS FHS1 6.57 − 05 5.28 − 05 Spherical Spherical 6.57E − 05 5.28E − 05 4.88 − 04 6.33 − 07 Rosenbrock Rosenbrock 4.88E − 04 6.33E − 07 1.36 − 08 Rastrigin 2.26E2.26 Rastrigin − 08− 08 1.36E − 08 7.87 − 05 Ackley Ackley 1.18E1.18 − 04− 04 7.87E − 05 Zakharov 2.71E − 04 1.25E − 04 2.71 − 04 1.25 − 04 Zakharov Sum Square 3.59E3.59 − 05− 05 3.72E − 06 3.72 − 06 Sum Square Average 1.63E − 04 4.35E − 05 1.63 − 04 4.35 − 05 Average Function
FHS2
FHS3
1.38 − 05
3.39 − 05
FHS2
1.38E − 05 1.76 − 11 1.76E − 11 1.08 − − 08 1.08E 08 9.55 − − 06 9.55E 06 4.72E 4.72 − − 05 2.53E 06 2.53 − − 06 1.22E − 05 1.22 − 05
FHS3
3.39E − 05 9.52E − 12 2.52 − 08 2.52E − 08 1.73 − 04 1.73E − 04 1.69E − 03 1.69 − 03 6.33E − 04 6.33 − 04 4.22E − 04 9.52 − 12
4.22 − 04
In In Table Table 12, 12, the the overall overall averages averages obtained obtained for for each each mathematical mathematical function function of of the the three three proposed proposed fuzzy Figure 15 15 shows shows the the data fuzzy methods methods can can be be found. found. Figure data plot plot of of the the three three proposals; proposals; it it is is noteworthy noteworthy that of the the PArate PArate that the the best best algorithm algorithm is is the the fuzzy fuzzy harmony harmony search search with with dynamic dynamic adjustment adjustment of parameter (FHS2). parameter (FHS2).
Figure 15. Plot of three proposed fuzzy HS.
Based on these experiments of the proposed methods and the original method (with parameters by trial and error), the conclusion is that, for the best results, the most effective range is from 0.7 to 1 rules in in increase. increase. and with the rules 5. Comparison Comparisonbetween betweenof ofFuzzy FuzzyHarmony HarmonySearch Search Algorithm Algorithm (FHS) (FHS) and and of of Fuzzy Bat Algorithm (FBA) Fuzzy Bat Algorithm (FBA) This This section section presents presents aa comparison comparison between between two two metaheuristic metaheuristic algorithms algorithms that that apply apply fuzzy fuzzy logic to dynamically adapt some of its parameters. In this case it was decided to choose logic to dynamically adapt some of its parameters. In this case it was decided to choose the the fuzzy fuzzy harmony increasing parameters of pitch adjustment since, according to theto three harmony search searchalgorithm algorithmwith with increasing parameters of pitch adjustment since, according the proposals that made in this paper, this one obtained better results. This was tested with six benchmark three proposals that made in this paper, this one obtained better results. This was tested with six mathematical functions and ten dimensions in each of itsinharmonies of vector solution) or benchmark mathematical functions and ten dimensions each of its(number harmonies (number of vector bats that were used; the note results ofthe theresults fuzzy bat algorithm was taken from literature [6]. solution) or bats thatnote werethat used; that of the fuzzy bat algorithm wasthe taken from the The following tables show the behavior of each of the methods. literature [6]. The following tables show the behavior of each of the methods. Table thethe overall averages for each according to the number bats or harmonies Table13 13shows shows overall averages for method each method according to the of number of bats or used, as well as the best and the worst results obtained for the sphere function. harmonies used, as well as the best and the worst results obtained for the sphere function.
Algorithms 2016, 9, 69
15 of 19
Table 13. Experiment results obtained for the sphere function with FBA and FHS algorithms. FBA
FHS
Num. Bats
Best
Worst
Average
Num. Harmonies
Best
Worst
Average
2 5 10 20 30 40
3.47E − 03 1.09E − 04 5.53E − 06 2.77E − 06 9.31E − 06 2.74E − 06
1.54E + 00 9.37E − 01 1.60E − 04 2.30E − 04 4.50E − 04 6.10E − 04
1.10E − 01 1.28E − 01 1.20E − 04 9.82E − 05 9.99E − 05 9.34E − 05
2 5 10 20 30 40
1.01E − 07 1.54E − 09 1.10E − 06 1.86E − 08 1.57E − 08 1.92E − 08
2.64E − 04 1.19E − 05 9.42E − 05 2.48E − 05 1.99E − 05 2.47E − 06
5.84E − 05 9.28E − 07 1.63E − 05 4.17E − 06 2.65E − 06 3.46E − 07
In Table 14, the overall averages for each method according to the number of bats or harmonies used can be observed, as well as the best and the worst results obtained for the Ackley function. Table 14. Experiment results obtained for the Ackley function with the FBA and FHS algorithms. FBA
FHS
Num. Bats
Best
Worst
Average
Num. Harmonies
Best
Worst
Average
2 5 10 20 30 40
3.81E − 05 1.07E − 05 2.76E − 07 4.41E − 07 3.19E − 06 3.91E − 06
9.52E − 01 6.69E − 01 2.00E + 00 3.45E + 00 2.05E + 00 1.56E + 00
4.60E − 01 2.23E − 01 1.13E + 00 9.60E − 01 9.22E − 01 4.17E − 01
2 5 10 20 30 40
2.64E − 08 1.07E − 08 8.46E − 08 1.98E − 08 2.63E − 08 1.40E − 08
1.67E − 04 1.38E − 04 4.28E − 04 6.08E − 05 5.99E − 06 9.02E − 05
1.94E − 05 5.53E − 06 1.62E − 05 4.05E − 06 1.50E − 06 1.05E − 05
In Table 15, the overall averages for each method according to the number of bats or harmonies used can be observed, as well as the best and the worst results obtained for the Rosenbrock function. Table 15. Experiment results obtained for the Rosenbrock function with the FBA and FHS algorithms. FBA
FHS
Num. Bats
Best
Worst
Average
Num. Harmonies
Best
Worst
Average
2 5 10 20 30 40
0.00E + 00 1.67E − 03 0.00E + 00 1.83E − 02 2.39E − 02 3.32E − 02
5.29E − 01 1.71E + 00 1.40E − 03 1.00E + 00 8.69E − 01 1.00E + 00
1.11E − 01 6.60E − 01 6.13E − 04 5.09E − 01 5.31E − 01 3.94E − 01
2 5 10 20 30 40
1.00E − 12 8.86E − 14 4.58E − 13 2.33E − 13 2.33E − 13 5.44E − 14
2.80E − 10 1.20E − 10 6.50E − 11 8.56E − 11 8.56E − 11 1.35E − 10
2.38E − 11 1.42E − 11 1.12E − 11 1.85E − 11 1.85E − 11 1.96E − 11
In Table 16, the overall averages for each method according to the number of bats or harmonies used can be observed, as well as the best and the worst results obtained for the Zakharov function.
Algorithms 2016, 9, 69
16 of 19
Table 16. Experiment results for the Zakharov function with the FBA and FHS algorithms. FBA
FHS
Num. Bats
Best
Worst
Average
Num. Harmonies
Best
Worst
Average
2 5 10 20 30 40
7.84E − 06 8.21E − 06 2.31E − 06 4.44E − 06 2.58E − 07 2.61E − 07
7.81E − 01 6.38E − 01 2.15E − 01 1.55E + 00 8.83E − 01 7.77E − 01
3.42E − 01 2.71E − 01 1.07E − 01 7.01E − 01 3.88E − 01 3.84E − 01
2 5 10 20 30 40
1.40E − 07 1.20E − 10 1.10E − 09 1.10E − 10 1.40E − 09 9.60E − 09
7.55E − 04 7.15E − 04 6.94E − 04 9.95E − 05 9.02E − 05 9.61E − 05
1.59E − 04 4.46E − 05 2.58E − 05 2.73E − 05 1.95E − 05 7.56E − 06
In Table 17, the overall averages for each method according to the number of bats or harmonies used can be found, as well as the best and the worst results obtained for the Rastrigin function. Table 17. Experiment results for the Rastrigin function with the FBA and FHS algorithms. FBA
FHS
Num. Bats
Best
Worst
Average
Num. Harmonies
Best
Worst
Average
2 5 10 20 30 40
1.63E − 05 4.63E − 05 1.43E − 06 1.06E − 05 6.21E − 06 2.98E − 06
9.34E − 01 9.95E − 01 7.29E − 01 3.54E − 01 8.73E − 01 6.86E − 01
3.50E − 01 5.29E − 01 3.64E − 01 1.77E − 01 2.39E − 01 3.32E − 01
2 5 10 20 30 40
1.06E − 10 1.90E − 11 1.08E − 10 1.85E − 10 1.20E − 11 1.43E − 10
6.60E − 08 2.95E − 08 1.28E − 07 3.62E − 08 9.32E − 08 7.42E − 08
9.62E − 09 2.46E − 09 1.91E − 08 4.86E − 09 1.59E − 08 1.27E − 08
In Table 18, the overall averages for each method according to the number of bats or harmonies used can be observed, as well as the best and the worst results obtained for the sum squared function. Table 18. Experiment results for the function sum squared with FBA and FHS algorithms. FBA
FHS
Num. Bats
Best
Worst
Average
Num. Harmonies
Best
Worst
Average
2 5 10 20 30 40
8.67E − 03 9.40E − 03 3.92E − 02 1.39E − 02 1.50E − 02 1.82E − 03
8.39E − 01 7.50E − 01 9.17E − 01 8.51E − 01 9.45E − 01 8.31E − 01
5.20E − 01 4.43E − 01 6.12E − 01 4.46E − 01 3.21E − 01 2.97E − 01
2 5 10 20 30 40
2.60E − 08 2.00E − 07 4.00E − 08 3.10E − 07 3.60E − 07 3.40E − 07
4.20E − 06 5.50E − 06 5.00E − 06 5.10E − 06 4.70E − 06 5.40E − 06
1.74E − 06 2.51E − 06 1.55E − 06 3.12E − 06 3.02E − 06 3.24E − 06
6. Statistical Comparison A statistical comparison is also made between the fuzzy bat algorithm (FBA) and the fuzzy harmony search algorithm (FHS), to evaluate the efficiency of each method on each of the six mathematical functions applied. The statistical test for comparison is the Wilcoxon matched pairs test, which can be used to analyze the data, and whose parameters are given in Table 19.
Algorithms 2016, 9, 69
17 of 19
Table 19. Parameters for the Wilcoxon statistical test. F1
F2
Function
No.
FBA
FHS
Difference
abs (Difference)
Rank
Sign
Signed Rank (+)
Spherical Rosenbrock Rastrigin Ackley Zakharov Sum Square
1 2 3 4 5 6
3.97E − 02 6.85E − 01 3.68E − 01 3.66E − 01 3.32E − 01 4.40E − 01
1.38E − 05 1.76E − 11 1.08E − 08 9.55E − 06 4.72E − 05 1.38E − 05
3.97E − 02 6.85E − 01 3.68E − 01 3.65E − 01 3.32E − 01 4.40E − 01
3.97E − 02 6.85E − 01 3.68E − 01 3.65E − 01 3.32E − 01 4.40E − 01
1 6 4 3 2 5
1 1 1 1 1 1
1 6 4 3 2 5
The alternative hypothesis states that the average of the results of the fuzzy harmony search algorithm is different than the average performance of the fuzzy bat algorithm, and therefore the null hypothesis tells us that the average of the results of the fuzzy harmony search algorithm is equal to the average of the fuzzy bat algorithm. To test the hypothesis, first the absolute values | Zi | . . . | Zn | are sorted and assigned their range rank; the sign column indicates that all values obtained are positive; the signed rank column indicates the order of these values from lowest to highest. The formula of the statistical test is applied: W+ =
∑
Ri
(7)
≈ i >0
That is, the sum of the ranges Ri corresponding to positive values Zi . The value of W + is the sum of the positive ranks, the value W− is the sum of the negative ranks, W is the differences between two data samples, and W0 indicates the value of the table for a two-tailed test using 30 samples. The test to evaluate is as follows: If W ≤ W0, then reject Ho. Table 20 shows a statistical test applied to the two fuzzy methods. In applying the Wilcoxon statistic, with a confidence level of 95% and a value of W = 0 and W0 = 1, the W ≤ W0 condition is satisfied, so the statistical test results are as follows: for the fuzzy harmony search, there is significant evidence to reject the null hypothesis and the alternative hypothesis is accepted stating that the average fuzzy harmony search algorithm is different than the average performance of the fuzzy bat algorithm. In summary, one can state that the fuzzy harmony search outperforms the fuzzy bat algorithm for this set of benchmark functions. Table 20. Values of parameters for the statistical test. W−
W+
W
Level Significance
m = Degrees of Freedom
W0 = W α, m
0
21
0
0.05
6
1
7. Conclusions The harmony search (HS) algorithm is a relatively new method which can solve various kinds of problems in an easy and effective manner, as it requires many complex calculations. HS can handle the discrete and continuous variables and can be applied to linear and nonlinear functions. Currently, the parameters of the algorithms are set by trial and error. In this paper, a new algorithm was proposed to achieve better convergence and not stay in local optima. This paper presents a new algorithm to search for harmony with adjustable fuzzy parameters, in order for the fuzzy system to dynamically move the parameters of this algorithm and subsequently obtain a faster convergence and better results than the original method and others existing in the literature.
Algorithms 2016, 9, 69
18 of 19
The paper proposed three different fuzzy systems to initially move each parameter independently of the algorithm. The harmony memory accepting (HMR) parameter provides exploitation ability to the algorithm, and pitch adjustment (PArate) is controlled by the scanning algorithm; it has a combination of both parameters and each of the changes make mathematical functions applied it to benchmark to test the efficiency of the algorithm. Finally, an analysis of the results of each of the proposed methods led to the conclusion that when using a range between 0.7 and 1 in each of the parameters, and moving them dynamically using a fuzzy system, better results are achieved with the original method and the other existing methods in the literature applied, in this case, to six mathematical functions benchmarks. However, more variations with the rules of the FHS3 are needed to obtain a significant advantage in all function benchmarks. In the future, when the method is applied to more complex math functions and more dimensions, it is expected to achieve good results in the same number of iterations. Future work includes testing the proposed fuzzy harmony search with other functions and real world applications. In addition, type-2 fuzzy logic could be used instead of type-1, as is done in this paper. Acknowledgments: We would like to express our gratitude to CONACYT, Tijuana Institute of Technology for the facilities and resources granted for the development of this research. Author Contributions: Mario Garcia Valdez and Fevrier Valdez Acosta reviewed the state of the art; Oscar Castillo and Patricia Melin contributed to the discussion and analysis of the results; Cinthia Peraza Ramirez analyzed of the original method and applied fuzzy logic for parameter adaptation, and contributed to the simulations and wrote the paper. Conflicts of Interest: The authors declare no conflict of interest.
References 1. 2. 3.
4. 5. 6. 7. 8. 9. 10. 11. 12. 13.
Manjarres, D.; Landa-Torres, I.; Gil-Lopez, S.; Del Ser, J.; Bilbao, M.N.; Salcedo-Sanz, S.; Geem, Z.W. A survey on applications of the harmony search algorithm. Eng. Appl. Artif. Intell. 2013, 26, 1818–1831. [CrossRef] Geem, Z.W. Novel derivative of harmony search algorithm for discrete design variables. Appl. Math. Comput. 2008, 199, 223–230. [CrossRef] Fesanghary, M.; Mahdavi, M.; Alizadeh, Y. Hybridizing harmony search algorithm with sequential quadratic programming for engineering optimization problems. Comput. Methods Appl. Mech. Eng. 2008, 197, 3080–3091. [CrossRef] Geem, Z.W.; Sim, K.-B. Parameter-setting-free harmony search algorithm. Appl. Math. Comput. 2010, 217, 3881–3889. [CrossRef] Vasebi, A.; Fesanghary, M.; Bathaee, S.M.T. Combined heat and power economic dispatch by harmony search algorithm. Int. J. Electr. Power Energy Syst. 2007, 29, 713–719. [CrossRef] Pérez, J.; Valdez, F.; Castillo, O. Bat Algorithm Comparison with Genetic Algorithm Using Benchmark Functions; Springer: Dordrecht, The Netherlands, 2014; pp. 225–237. Wang, C.; Huang, Y. Self-adaptive harmony search algorithm for optimization. Expert Syst. Appl. 2010, 37, 2826–2837. [CrossRef] Mashinchi, M.H.; Orgun, M.A.; Mashinchi, M.; Pedrycz, W. A tabu–harmony search-based approach to fuzzy linear regression. IEEE Trans. Fuzzy Syst. 2011, 19, 432–448. [CrossRef] Jaberipour, M.; Khorram, E. Two improved harmony search algorithms for solving engineering optimization problems. Commun. Nonlinear Sci. Numer. Simul. 2010, 15, 3316–3331. [CrossRef] Wang, G.; Guo, L. A novel hybrid bat algorithm with harmony search for global numerical optimization. J. Appl. Math. 2013. [CrossRef] Yildiz, A.R. Hybrid Taguchi-harmony search algorithm for solving engineering optimization problems. Int. J. Ind. Eng. Theory Appl. Pract. 2008, 15, 286–293. Zhao, S.-Z.; Suganthan, P.N.; Pan, Q.; Tasgetiren, M.F. Dynamic multi-swarm particle swarm optimizer with harmony search. Expert Syst. Appl. 2011, 38, 3735–3742. [CrossRef] Yang, X. Firefly algorithm, stochastic test functions and design optimization. Int. J. Bio-Inspir. Comput. 2010, 2, 78–84. [CrossRef]
Algorithms 2016, 9, 69
14. 15. 16. 17.
18.
19.
20. 21. 22. 23. 24. 25.
26. 27.
28. 29. 30.
19 of 19
Yang, X. Firefly Algorithms for Multimodal Optimization. In Proceedings of the 5th International Symposium on Stochastic Algorithms, Sapporo, Japan, 26–28 October 2009; pp. 169–178. Yang, X. A New Metaheuristic Bat-Inspired Algorithm. In Nature Inspired Cooperative Strategies for Optimization (NICSO 2010); Springer: Berlin/Heidelberg, Germany; pp. 65–74. Yang, X.; Deb, S. Two-stage eagle strategy with differential evolution. Int. J. Bio-Inspir. Comput. 2012, 4, 1–5. Yang, X. Engineering Optimizations via Nature-Inspired Virtual Bee Algorithms. In Proceedings of the First International Work-Conference on the Interplay between Natural and Artificial Computation, Las Palmas, Spain, 15–18 June 2005; pp. 317–323. Valdez, F.; Melin, P.; Castillo, O. Fuzzy Control of Parameters to Dynamically Adapt the PSO and GA Algorithms. In Proceedings of the 2010 IEEE International Conference on Fuzzy Systems (FUZZ), Barcelona, Spain, 18–23 July 2010; pp. 1–8. Abdelbar, A.M.; Abdelshahid, S.; Wunsch, D.C. Fuzzy PSO: A Generalization of Particle Swarm Optimization. In Proceedings of the 2005 IEEE International Joint Conference on Neural Networks, Montreal, QC, Canada, 31 July–4 August 2005; pp. 1086–1091. Chen, C. Design of PSO-based fuzzy classification systems. Rev. Cienc. Ing. 2006, 9, 63–70. Lee, K.S.; Geem, Z.W. A new meta-heuristic algorithm for continuous engineering optimization: Harmony search theory and practice. Comput. Methods Appl. Mech. Eng. 2005, 194, 3902–3933. [CrossRef] Yang, X.; Geem, Z.W. Music-Inspired Harmony Search Algorithm: Theory and Applications; Springer: Berlin/Heidelberg, Germany, 2009. Mahdavi, M.; Fesanghary, M.; Damangir, E. An improved harmony search algorithm for solving optimization problems. Appl. Math. Comput. 2007, 188, 1567–1579. [CrossRef] Omran, M.G.H.; Mahdavi, M. Global-best harmony search. Appl. Math. Comput. 2008, 198, 643–656. [CrossRef] Zou, D.; Gao, L.; Ge, Y.; Wu, P. A Novel Global Harmony Search Algorithm for Chemical Equation Balancing. In Proceedings of the 2010 International Conference on Computer Design and Applications (ICCDA), Qinhuangdao, China, 25–27 June 2010; pp. V2-1–V2-5. Lee, K.S.; Geem, Z.W. A new structural optimization method based on the harmony search algorithm. Comput. Struct. 2004, 82, 781–798. [CrossRef] Melin, P.; Olivas, F.; Castillo, O.; Valdez, F.; Soria, J.; Valdez, M. Optimal design of fuzzy classification systems using PSO with dynamic parameter adaptation through fuzzy logic. Expert Syst. Appl. 2013, 40, 3196–3206. [CrossRef] Štefek, A. Benchmarking of Heuristic Optimization Methods. In Proceedings of the 2011 14th International Symposium En Mechatronika, Trencianske Teplice, Slovakia, 1–3 June 2011; pp. 68–71. Yang, X. Engineering Optimization: An Introduction with Metaheuristic Applications; John Wiley & Sons: Hoboken, NJ, USA, 2010. Yang, X. Nature-Inspired Metaheuristic Algorithms; University of Cambridge, Luniver Press: Cambridge, UK, 2010; pp. 73–76. © 2016 by the authors; licensee MDPI, Basel, Switzerland. This article is an open access article distributed under the terms and conditions of the Creative Commons Attribution (CC-BY) license (http://creativecommons.org/licenses/by/4.0/).