In the best cases churn is predicted a maximum of one month ahead. With limited .... The profiling software methodology performs its analysis in the following ...
A New Neural Network Based Customer Profiling Methodology for Churn Prediction Ashutosh Tiwari, John Hadden, and Chris Turner Decision Engineering Centre, School of Applied Sciences, Cranfield University, Bedfordshire, UK. {a.tiwari, c.j.turner}@cranfield.ac.uk
Abstract. Increasing market saturation has led companies to try and identify those customers at highest risk of churning. The practice of customer churn prediction addresses this need. This paper details a novel approach and framework for customer churn prediction utilising a Neural Network (NN) approach. The methodology for customer churn prediction describes a predictive approach for the identification of customers who are most likely to churn in the future. This is a departure from current research into customer churn which tries to predict which customers are most likely to instantaneously churn. A real life case study from industry is presented here to illustrate this approach in practice. Future research will include the enhancement of this approach for more accurate modelling of collective systems. Keywords: Customer Churn, Churn Prediction Methodology, Customer Profiling, Classification, Neural Network.
1 Introduction For companies operating in mature markets the acquisition of new customers is a difficult task. It has been reported that the acquisition of new customers can be over ten times more costly to a business than retaining existing customers. This is largely because in saturated markets, the acquisition of new customers often involves enticing customers away from competitors through offers of expensive special deals [1]. Facing a market at or near saturation point a company will soon recognise that its greatest asset is its existing customer base. Holding onto existing customers is not an undemanding procedure; a company must understand its customers and their needs. A route that many organisations have chosen to take involves the use of Customer Relationship Management products to boost customer retention and increase selling opportunities to the existing customer base. Customer retention addresses the issue of customer churn, where churn describes the turnover of customers, and churn management describes the efforts a company makes to identify and control the problem of customer churn [2].
There are several modelling techniques available that can aid in the prediction of customer churn. The most common techniques have been identified from literature as: Classification and regression trees (CART) Logistic regression models (LRM) Artificial Neural Networks (NN) Other statistical and classification methods may also apply to the problem domain, however they have either not been widely explored or they have failed to provide satisfactory results [3]. CART (also known as recursive partitioning regression) is a popular classification technique used for predicting events. The work of Bloemer et al. [4], who detail a classification technique for at risk customers, provides further information on this technique. Logistic regression model (LRM) is an extension of multiple regressions. It provides an output that is in the form of a probability between the values 0 and 1 [5]. Related work in this area is limited to authors such as Mihelis et al. [6] who use such regression techniques for the prediction of customer satisfaction. Artificial Neural Networks (NN) consist of basic elements known as ‘neurons’. These neurons consist of three main components: (i) weight, (ii) bias and (iii) activation function. Each neuron receives an input on which it applies a weight value. This weight holds the key to the NN’s overall performance because it provides the strength of the connection to the specific input. Work relating to customer relationship management using NNs has been undertaken by Rygielski [7].Experiments using each of the above mentioned predictive techniques have shown that predictive models alone do not provide a strong enough churn accuracy to make them directly applicable for the capture of future customer churn [8]. To perform churn analysis the predictor variables have to be of sufficient quality. If the predictive model is unable to converge with the data the output predictions will be inaccurate. An examination of literature in this area by the authors reveals that there is only a minimal amount of work in the area of advance churn prediction. In the best cases churn is predicted a maximum of one month ahead. With limited specialist retention staff available to a company, this may be insufficient time for the successful deployment of a retention campaign. A methodology capable of providing a significantly greater time between event and occurrence is therefore required if future customer churn is to be predicted with any accuracy. Literature has also suggested that researchers typically target high churn capture from their models. There has been a lack of documentation that targets the control of misclassification. Misclassifying non-churn as churn add to the numbers that need contacting by the retention department and as customers who never intended to churn are being contacted with expensive retention offers, real churners are left to defect. As mentioned in the previous section demographic, usage and billing data are the most convenient sources for use in predicting customer churn. However, due regulations in place in the case studies industry these sources cannot be used. Instead data collected on repairs and complaints will be used as a basis for this research. Repairs and complaints are common in a huge variety of sectors whereas usage data tends to be industry specific. In many respects the customer churn approach outlined in this paper models the collective behaviour of customers.
2 Customer Profiling Methodology Current research has concentrated on predicting customer churn as it occurs (i.e. predicting customer churn for a month based on that month’s data). The authors’ goal is to determine if a NN could predict churn in the future by offering input data from one month to predict the target churn for the following month. However, the results from experiments using this method were poor and an alternative approach was sought. No previous research could be identified for prediction of future churn so the aim was to use the churn index values that had been determined for each customer in this task. From initial experimentation at this stage it was found that the NN provided the customer’s propensity to churn on a monthly basis. A theory emerged that customers with similar propensity measures over a set period of time would also display similar characteristics with regards to how long it takes them to terminate their contract. This lead to the development of a customer profile based methodology. By analysing churn indices a number of profile classes could be constructed to categorise different customer types. Clustering was used to produce these classes known as master profiles. A description of the proposed methodology is as follows: Prepare the data Ensure the data is numerical, and has no missing or incompatible values and take a time sequence of customer data and split the data by customer, by month. Determine the most suitable for creating the NN model One month of data is required for training the NN. The training set should contain as many churners as possible so an analysis of the available data should be performed in order to determine which month contains the highest churn. This month should be used as the basis for creating the training dataset. Based on the total number of churners in the chosen training month randomly eliminate non-churners from the training set to create a 20:80 churn/non-churn ratio. Create an NN suitable for generating a loyalty index Using the training dataset create 3 NNs (1 neuron, 1 layer), (3 neuron, 2 layers), and (6 neuron, 4 layer). It may be necessary to continue these experiments increasing the number of neurons in each layer? By applying each of the NN architectures to the full month that the training set was originally based on, and then comparing the predicted results against the actual churn data, it is possible to determine which NN architecture has converged best. The NN displaying the best convergence should be used for generating churn index values for all other available months. Generate churn index values Using the best NN, generate churn index values for each individual month for each customer. Compile a database containing all churn indices for each month and all churn information. Apply customer profiling methodology Analyse churn indices to establish master profile classes and customer classification into the determined master profile classes.
Identify the high and low risk profile clusters By determining how many of the customers contained within each profile cluster have actually churned it is possible to rate each cluster into high-risk and low-risk churn groups. Determine churn capture accuracy. Comparing the high-risk profile clusters with future churn data provides a determination of how many future churners have been captured from the resulting methodology. The profiles that have been determined to hold the highest portion of future churn are classified as high risk clusters. The profiles that have small or zero future churn capture classified as low risk clusters. The time frame for the data being analysed is shifted forward. In business the time frame should move on a monthly basis; however for the research it will move forward 3 months to minimise the risk of duplicate capture. This risk would not be a problem in industry as once a customer had churned they would be automatically be removed from the dataset being analysed. The high risk profiles can then be used as future churn predictors and all customers being assigned those profiles classified as churners. Achieve the maximum possible future prediction. The profiling methodology has proven to be capable of predicting churn in the future with the ability of matching customers to master profile clusters to enable early classification, increasing time between classification and the actual churn event. The customer profiling methodology uses several months of data to determine customer churn rather than just 1 month as commonly seen in research. Because of this time window a system could easily be implemented in the form of a continuously moving time window capable of classifying customers to master profiles and flagging churn in advance. Base the framework on data that is available across multiple service sectors and accessible for analysis by any business regardless of size Predictions have been based on customer repairs and complaints data. The benefits of using this type of data source are that it is available for use by any company regardless of the monopoly status and it has proved to be a good source for basing accurate future predictions. Churn connected to repairs and complaints is strategic to the specific business. It is the identification of customers who are contemplating defecting because they are not happy with their service so the business is responsible for their dissatisfaction. Minimise the total number of misclassifications from the predictions to reduce retention costs to the business It has been demonstrated that a lot of thought has gone into how misclassification rates can be improved. The customer profiling methodology achieves this task by eliminating customers who fall into weaker churn categories.
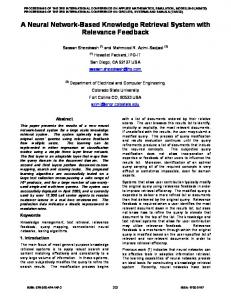
Fig. 1. Customer profiling methodology flow chart
The methodology has been realised in the outline provided in Fig. 1. The key stages to note from Fig. 1 are:
3
Decide best month for NN training - One month of data is required for training the NN Decide best NN architecture for generating a loyalty index – The loyalty index for a customer is a measure of their comparative loyalty to the company. Three alternative NN architectures are evaluated for this stage Generate churn index scores – The churn index indicates a customer’s potential to churn. Churn index values are generated for each individual month for each customer. A churn index database is complied out of the results Apply Customer profiling methodology - Analyse churn indices to establish master profile classes and customer classification into the determined master profile classes Identify high and low risk profile clusters - Analyse churn indices to establish master profile classes and customer classification into the determined master profile classes Determine churn capture accuracy - Comparing the high-risk profile clusters with future churn data provides a determination of how many future churners have been captured from the resulting methodology
Customer Profiling Case Study
A case study, based on real industry data, was used as further validation of the NN customer churn approach. The data set had the following characteristics:
35 variables 8408 Customers 13 Months of data 29:71 Churn\Non-Churn 13 Months Containing Churn Activity
To ensure that the most accurate NN architecture is constructed for the generation of a customer churn index several experiments have been performed for the case study using various NN configurations. The first NN experiment used a simple single layer single neuron NN as keeping the complexity of the architecture to a minimum decreases the analysis time. The second NN experiment had a more complex architecture to that of experiment 1 containing 2 hidden layers, each containing 3 neurons each. The third NN experiment involved a large NN. An NN was constructed with four hidden layers and seven neurons per layer. The third NN was much larger than the previous two. This experiment was performed to establish if the complex problem of determining a customer churn rate required a large NN.
3.1 NN Experiment Results The results obtained from the final NN experiment were very similar to those results of the first single layer single neuron network. The only significant difference between the results was a decrease in the total number of non-churn misclassifications from the four layer six neuron network, however there are over 2.5 times more nonchurn misclassifications generated by NN 3 over NN 2. So that an accurate comparison of the results for all three experiments can be achieved the churn and nonchurn accuracies for each experiment were converted to a percentage and recorded in Table 1:
Table 1. NN prediction accuracy result.
Activation Function
Churn Capture Accuracy
Non-Churn Capture Accuracy
Total Accuracy
NN1
76.50%
94.00%
93.40%
NN2
65.50%
98.40%
97.40%
NN3
73.80%
96.00%
95.30%
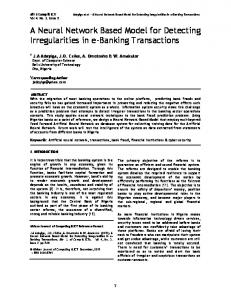
It can be observed from Table 1, NN1 experiment achieved a total prediction accuracy of 93.4%. The total prediction accuracy has been calculated by adding the correct number of classified non-churn with the correct number of classified churn, dividing the number by the total dataset size of 8409 and multiplying by 100. NN2 achieved a 97.4% total accuracy and NN3 achieved a 95.3% total accuracy. From this information it is clear that the NN2 configuration has provided the best overall results for classifying the case study dataset. 3.2 Generating Churn Index Values The results obtained from NN experiment 2 shown in Fig. 2 are appropriate for generating churn index values because they provide a significant number of actual churn matches with a decrease in non-churn misclassifications over those generated from NN 1 and NN 3. The 2nd NN configuration is used to generate churn index values for each customer over each month of the available historical dataset for analysis by the customer profiling methodology. Once the churn index values for each month are generated they are exported out of Matlab and inserted into MS Excel. The first Excel column is the customer ID number, column 2 is the churn index values for April 04, Column 3 May 04, etc. After all the months are inserted, the churn column is added to the worksheet. This column stores as a numerical indicator depending on the month churn occurred. E.g. If the first month of data in the time sequence is April 04 then the corresponding churners for April 04 are stored as the integer ‘1’. May 04 churners are given the integer ‘2’, June 4 the integer ‘3’ etc. This is because the profiling methodology attempts to identify a pattern of how long it takes customers to
churn after their loyalty index values fall below a pre-defined churn threshold. If the churn index value falls below the churn threshold in month 2 and actual churn occurs in month 4 then that particular customer took 2 months to churn. If all customers belonging to a profile take 2 months to churn we have determined that all customers being matched to that profile should also theoretically take 2 months to churn.
ID 1
Apr-04 0.0000
May-04 0.0027
Jun-04 0.9961
Jul-04 0.0156
Aug-04 0.0020
Sep-04 0.0004
Oct-04 0.0000
Fig. 2. Churn index values
An example of the required customer churn index values that are used for analysis by the churn profiling software can be seen in Fig. 2. 3.3 Applying a Customer Profiling Methodology The churn index values such as the ones shown in Fig. 2 are presented to the churn profiling software. The profiling software methodology performs its analysis in the following sequence:
Convert the churn index values to loyalty index values using the formula Loyalty index = 1 – churn index Assess the loyalty index values to see if their has been fluctuating activity for the customer Check to see if loyalty profiles already exists for determined loyalty time series pattern. If the profile exists, assign the customer that profile. If the profile does not exist check to see if the customers loyalty value at any point falls below a given churn threshold (The value 0.3 has been defined as a default value because this value provided best accuracy during the initial methodology experiments). If the loyalty index value has fallen below the churn threshold check to see if the customer is recorded as an actual churner. If the customer has been recorded as an actual churner, add the profile for that customer as a future master profile. If the customer is not an actual churner or the customers loyalty index value has not fallen below the churn threshold then do nothing.
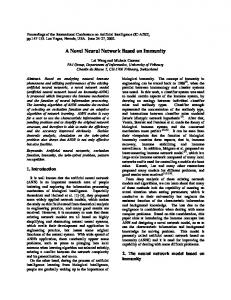
An example result for master profile 11 is shown below in Fig. 3. This profile shows an initial raise in the customer’s loyalty index which then levels off for one month before a major drop that brings the loyalty index below the churn threshold. Only 9 customers fell into this profile, out of which a total of 7 customers actually churned and 5 of these customers churned in the three month future period.
Fig. 3. First most significant profile for future churn capture
Fig. 4. Third most significant profile for future churn capture
As shown from the example master profile in Fig. 3 the profile separates into two sections. A line chart at the top of the master profile display window provides a visualisation of the customer’s loyalty index pattern. In the case of master profile 11 Fig. 3 shows an initial raise in the customer’s loyalty index which remains static for 1 month before a major decline in loyalty value that brings the customer’s loyalty level below the churn threshold. Similarly master profile 38, shown in Fig. 4, begins with an initial decline in customer loyalty although this decline is not significant enough to lead to customer churn. A final major event in month 4 is significant enough to lead to customer churn. The bar chart at the bottom of the window illustrates approximately how long it took the customers who churned within the analysis period to churn after their loyalty index values fell below the churn threshold. This approximation is a calculation based on all customers belonging to that master profile cluster who have
actually churned. It is the average time taken for each customer to churn after their loyalty index value fell below the specified churn threshold This chart shows that for the case of master profile 11 50% of the customers churned within the same month as the event that caused the major fall in customer loyalty and 50% churned 1 month after the significant fall in customer loyalty. Only 2 customers churned within the analysis period for master profile cluster 11. 3.4 Determining Future Churn Capture Accuracy The case study dataset contains 13 months of data. The first 7 months have provided the input to the profiling methodology, while the subsequent 3 months have been used for classification of future churn accuracy for each of the master profile cluster. If, out of all the master profiles generated from this dataset, the master profiles categorised as strong churn classifiers (such as master profile 11 shown in Fig. 4) are aggregated, the future churn captured from these profiles total 189 from 758 customers who actually churn three months future of the analysis period. This is 25% of all churn over the future period. The most important aspect of the research though is the enhancement of the hit ratio, as the hit ratio in essence defines the strength of the predictive methodology. The overall hit ratio achieved from the test phase is 0.64. This means for every 1.5 customer’s contacted 1 customer will be a future churner. 10 months of data has been required to generate the customer profiling predictive model and the dataset contains a total of 13 months of data. The analysis window is moved forward 4 months to fully test the predictive accuracy of eight master profiles that have been identified as being the best for future prediction using months August to February as inputs for generating profiles for the prediction of the final 2 months of the dataset, March and April (two profiles were excluded from this experiment due to their low membership). The actual future churn capture for the dataset is displayed using the confusion matrix in Fig. 5.
Fig. 5. Initial future predictions from the case study dataset
As can be seen from Fig. 5 the initial future predictions have caught 31% of future churn. The results as they are have achieved a hit ratio of 0.22 so basically from every four predictions, one is an actual churner.
4
Discussion of Results
For easy analysis the results obtained from all three methodologies have been compiled into the bar chart shown in Fig. 6. It is evident from the results for each methodology shown in Fig. 6 that the customer profiling methodology has outperformed the NN proposed by Hu [9] and the one proposed by Hwang et al. [10]. Both of these alternative methodologies have similar results for both churn prediction and corresponding non-churn misclassifications. The customer profiling methodology has captured significantly more churners. The misclassifications for the customer profiling methodology are much lower than the other two methodologies and a large proportion of total predictions did actually churn. It should be noted that the average monthly churn has been used for the customer profiling methodology and so has the average monthly non-churn misclassification.
Fig 6. Comparison of methodologies for case study
The total churn capture for each methodology does not define the power of that methodology as prediction accuracy is directly related to the quality of the input data. The power of the model is defined by the hit ratio (the total number of predictions divided by the total number of correct classifications). The hit ratio provides an accurate measure of how well the model has determined predictions. The data used for analysis is not of very good quality which is apparent from the actual churn capture. The fact that the data is of poor quality is reflected through the Hu [9] and Hwang et al. [10] models. These models use general classification techniques and the results would show much stronger if the data was of better quality. The data does however; provide a suitable measure for model performance as the prediction accuracy measured by hit ratio does not require perfect data for churn prediction. Regardless of data quality, the profiling methodology has achieved a hit ration of 2.4 using monthly averages, which is over ten times better than either the Hu [9] results or Hwang et al. [10] results. The validation experiments performed on the case study data have determined that the customer profiling methodology has considerably outperformed the other techniques.
5
Conclusions
This paper has detailed a novel approach and framework for customer churn prediction utilising a Neural Network (NN) approach. A methodology for customer churn prediction and the identification of customers who are most likely to churn in the future has been presented. This is a departure for current research into customer churn which tries to instantaneously predict which customers are most likely to churn. A real life case study from industry has been presented here to illustrate this approach in practice. The results obtained from the case study show promise in the prediction of future customer churn. This research can be located within the framework of a collective evolutionary system. Indeed the collective behaviour of customers can be understood at a greater level of detail using the approach outlined in this paper. The accuracy of the learning stage of the NN approach, detailed in this paper, could be enhanced by its combination with an evolutionary optimisation technique such as genetic algorithms. Further to this concept an intelligent feedback loop may be built into a customer churn system to automatically respond to groups of users likely to churn with an appropriate offer or combination of offers. The modelling of collective systems could be possible with such an enhanced system outlined here. Future research could include the further study of customer behaviour, web based communication systems and even stock markets.
References 1. Seo, D., Ranganathan, C. & Babad, Y.: Two-Level Model of Customer Retention in the US Mobile Telecommunications Service Market. Telecommunications Policy, vol. 32, no. 3-4, pp. 182-196 (2008) 2. Hung, S., Yen, D. C. & Wang, H.: Applying Data Mining to Telecom Churn Management. Expert Systems with Applications, vol. 31, pp. 515-524 (2006) 3. Coussement, K. & Van Den Poel, D.: Churn Prediction in Subscription Services: An Application of Support Vector Machines While Comparing Two Parameter-Selection Techniques. Expert Systems with Applications, vol. 34, pp. 313-327 (2008) 4. Bloemer, J., et al.: Comparing Complete and Partial Classification for Identifying Customers at Risk. International Journal of Research in Marketing. vol. 20, pp. 117-131 (2002) 5. Nefeslioglu, H. A., Gokceoglu, C. & Sonmez, H.: An Assessment on the Use of Logistic Regression and Artificial Neural Networks With Different Sampling Strategies for the Preparation of Landslide Susceptibility Maps. Engineering Geology, vol. 97, pp 171-191 (2008) 6. Mihelis, G., et al.: Customer Satisfaction Measurement in the Private Bank Sector. European Journal of Operational Research, vol. 130, pp. 347-360 (2001) 7. Rygielski, C., Wang, C.J., and Yen, D.C.: Data Mining Techniques for Customer Relationship Management. Technology in Society, vol. 24, pp. 483-502 (2002) 8. Hadden, J.: A Customer Profiling Methodology for Churn Prediction. PhD Thesis, Cranfield University, UK (2008) 9. Hu, X.: A Data Mining Approach for Retailing Bank Customer Attrition Analysis. Applied Intelligence, vol. 22, pp. 47–60 (2005) 10. Hwang, H., Jung, T. & Suh, E.: An LTV Model and Customer Segmentation Based on Customer Value: A Case Study on the Wireless Telecommunications Industry. Expert systems with applications, vol. 26, pp. 181-188 (2004)