APRIL 2005
CAIRES AND STERL
443
A New Nonparametric Method to Correct Model Data: Application to Significant Wave Height from the ERA-40 Re-Analysis S. CAIRES
AND
A. STERL
Royal Netherlands Meteorological Institute, De Bilt, Netherlands (Manuscript received 9 September 2003, in final form 26 June 2004) ABSTRACT A new nonparametric method to correct model data is proposed. At any given point in space and time the correction is determined from “analogs” in a learning dataset. The learning dataset contains model data and simultaneous observations. The method is applied to the significant wave height dataset of the 45-yr European Centre for Medium-Range Weather Forecasts Re-Analysis (ERA-40). Comparison of the corrected data with significant wave height measurements from in situ buoy and global altimeter data shows clear improvements in bias, scatter, and quantiles in the whole range of values. Temporal inhomogeneities are also removed.
1. Introduction The European Centre for Medium-Range Weather Forecasts (ECMWF) has recently completed the computations of the 40-yr ECMWF Re-Analysis (ERA-40) dataset, a reanalysis of global variables, among which ocean surface wind waves from September 1957 to August 2002 (45 yr) are included. The reanalysis was produced by ECMWF’s Integrated Forecasting System, which uses variational data assimilation. In terms of sea state data, this reanalysis was the first in which an ocean wind–wave model was coupled to the atmosphere. Moreover, its final product consists of the longest and most complete wave dataset on a 1.5° by 1.5° latitude– longitude grid covering the whole globe. The ERA-40 wave dataset is intended for studies of the climatology and variability of ocean waves and to predict extreme values of wave parameters over the whole globe. The validation of ERA-40 significant wave height (Hs) data against other reanalysis datasets (Caires et al. 2004) shows that they are of comparable quality in regard to their errors relative to wave observations. The assessment of the ERA-40 Hs data against observations reveals some underestimation of high Hs values (Caires and Sterl 2003b), which results in low estimates of return values (Caires and Sterl 2003a). Besides the underestimation of high peaks, another shortcoming of ERA-40 Hs data is the existence of inhomogeneities in the monthly mean time series due to assimilation of different altimeter Hs datasets; these induce clear Corresponding author address: Dr. Sofia Caires, KNMI, P.O. Box 201, NL-3730 AE De Bilt, Netherlands. E-mail:
[email protected]
© 2005 American Meteorological Society
JTECH1707
jumps and trends in the monthly mean time series, which discourage basing trend and climate variability studies on the dataset. The objective of this paper is to present a complete evaluation of the ERA-40 Hs field and to provide an alternative—corrected—field that is free of apparent inhomogeneities and provides a better description of high wave heights. There has been already some work on the correction of reanalysis datasets. Limitations in the wave data produced by the National Centers for Environmental Prediction (NCEP)–National Center for Atmospheric Research (NCAR) reanalysis winds led Swail and Cox (2000) to kinematically improve the wind fields for the North Atlantic. This involved a reported 10 000 meteorologist hours of effort (Wang and Swail 2002). The corrected wind field was then used to force a thirdgeneration wave model. Validation of the Swail and Cox (2000) wave dataset, the ERA-40 data, and a dataset created by forcing a second-generation wave model using the original NCEP–NCAR reanalysis winds Cox and Swail (2001) show that the Swail and Cox (2000) dataset compares better with observations (Caires et al. 2004). Although kinematically improving the wind fields seems to be quite effective in producing better Hs fields, the high cost involved restricted the study of Swail and Cox (2000) to the North Atlantic. Also, errors in the forcing wind fields explain only some of the deficiencies in the predicted Hs fields; other origins of deficiencies are wave model inadequacies and resolution (see, e.g., Janssen et al. 1997; Sterl et al. 1998; Rogers and Wittman 2002; Cavaleri and Bertotti 2003). To overcome these problems we propose here a new nonparametric method that corrects the ERA-40 Hs
444
JOURNAL OF ATMOSPHERIC AND OCEANIC TECHNOLOGY
fields directly. Roughly speaking, the method predicts the error made by ERA-40 under a particular “scenario” (a particular combination of events pertaining to wave-related variables) by “learning” from what the ERA-40 errors were in datasets containing similar scenarios or “analogs.” Evidently, this requires the availability of “learning datasets”—that is, datasets for which measurements (and hence errors) are known. Moreover, it requires representative learning datasets and, therefore, due to the inhomogeneities present in ERA-40 (hence in its error characteristics), also a judicious choice of which dataset is appropriate to correct which period of ERA-40 Hs data. Accordingly, although the correction method is the same throughout, the learning datasets used will differ. The method has a great flexibility in defining the analog on which to build the correction. Applications to data with error characteristics other than the data considered here will naturally require other choices than those made in this paper. Besides data correction, the method can also be used for other purposes, such as prediction and gap filling. Our results show that our correction method of the ERA-40 Hs data is capable of dealing with both the underestimation of high Hs values and the inhomogeneities.
2. Validation of the ERA-40 data a. Data description and preparation Most of the existing reliable sets of climate observations have been used in the assimilation procedure of ERA-40. Since validation is possible only if good, independent measurements (i.e., not used in the assimilation) are available, the datasets used in the assimilation must be borne in mind. With respect to the reanalysis of wave data, the measurements assimilated were the altimeter Hs fast-delivery product (FDP) data from the ERS-1/2 satellites. • FDP ERS-1 Hs measurements were assimilated from
December 1991 onward. The data are, however, of poor quality during the first 2 yr due to an external processing error. Assimilation of the FDP data was halted as soon as this problem was realized, with production to May 1993. Assimilation was resumed in January 1994 using good but uncalibrated ERS-1 FDP data up to May 1996. • FDP ERS-2 Hs measurements were assimilated from June 1996 onward. This makes all the other available wave measurements suitable for independent validation. For the purposes of validation, we have not only looked for independent but also reliable and established deep-water Hs observations. Only deep-water locations can be taken into account since no shallow-water effects are accounted for in the wave model, and they should not be too close to the coast in order for the corresponding model grid point to be located at sea.
VOLUME 22
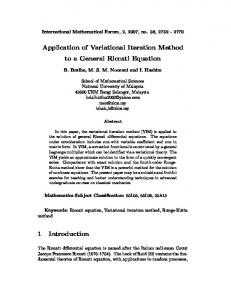
So far, buoy observations are considered the most reliable wave observations, but they are limited to some locations along the coast, mainly in the Northern Hemisphere, and are available only at a small number of locations before 1978. From 1978 onward buoy observations from the United States National Data Buoy Center (NDBC)–National Oceanic and Atmospheric Administration (NOAA) off the coast of North America are available; due to their high quality they will be used here as the “true” sea state. Comparisons for the period before 1978 were made just at one location (the Seven Stones Light Vessel, hereafter SSLV) in the Northern Atlantic. Global validations are made only for periods when reliable satellite wave observations are available, and therefore are restricted mainly to the last decade of ERA-40 data. We have assessed the ERA-40 Hs data against Geosat altimeter measurements of 1988, against TOPEX altimeter measurements from 1993 onward, against ERS-1 offline (OPR) altimeter observations for June to December 1993, and against ERS-2 OPR for June 1995–May 1996. In these two periods the respective ERS-1/2 measurements have not been used in the ERA-40 data assimilation. The buoy, altimeter, and ERA-40 data represent different time and space scales. The ERA-40 data comes on a 1.5° by 1.5° grid at synoptic times. The data are representative of the average condition in the area occupied by a grid box. Buoy measurements are available hourly and come from the processing of 20-min records at a single location. Altimeter measurements are available every second and at distances of about 10 km apart. In the following we will briefly describe how the observations were processed in order to make the time and space scales of the different systems compatible. More details, including the quality controls applied and collocation procedure, can be found in Caires and Sterl (2003b) and Bidlot et al. (2002). From all the NDBC–NOAA data buoy locations available during this period, we have selected a total of 18 locations for these comparisons (see Fig. 1). Qualitychecked buoy Hs hourly time series are used to produce a new time series at synoptic times by averaging the data over 3 h around synoptic times. This averaging over time is expected to bring the temporal and spatial scales closer to each other: the model output at a given synoptic time is an estimate of the average condition in a grid cell of 1.5° by 1.5° (the wave model resolution), which long waves take on average 3 h to cross. The Geosat, TOPEX, and ERS-1/2 along-track altimeter measurements of H s were obtained from Southampton Oceanography Center (SOC; GAPS interface, available online at http://www.soc.soton.ac.uk/ ALTIMETER/; Snaith 2000). From these we form satellite “superobservations” by grouping together the consecutive quality checked deep-water observations crossing a 1.5° by 1.5° latitude–longitude region (observations at most 30 s or 1.5 公2° apart).
APRIL 2005
CAIRES AND STERL
445
FIG. 1. Locations of the NDBC–NOAA buoys used in the validation studies.
There are several corrections available to bring the altimeter Hs measurements closer to the buoys. We have applied no correction to the ERS-2 data. The TOPEX wave height observations for 1997–99 (cycles 170–235) have drifted; the drift is corrected according to Challenor and Cotton (1999). Once the drift is corrected, we assume the TOPEX Hs measurements to be consistent from January 1993 to December 2001. Caires and Sterl (2003b), using a functional relationship model, found that TOPEX data relate to the buoy data ⫽ 1.05HTOPEX ⫺ 0.07; we have according to Hbuoy s s made the TOPEX observations used here compatible with the buoy observations by applying the previous linear relationship. The Geosat altimeter data used are increased by a factor of 1.065 according to Cotton and Carter (1996). The differences between the reanalysis data and the observations will be quantified in terms of the bias, y ⫺ x, the root-mean-square error rmse ⫽ 公1/n兺(yi ⫺ xi)2, and the scatter index, SI ⫽ 1/x公1/n兺[(yi ⫺ y) ⫺(xi ⫺ x)]2. In all these formulas the xi’s represent the observations, the yi’s represent the reanalysis products, and n is the number of observations. We have validated the ERA-40 dataset against observations using these statistics, as well as others not mentioned here. (Detailed comparisons can be consulted in the ERA-40 ocean wave product validation and analysis Web site online at http://www.knmi.nl/ onderzk/oceano/waves/era40/index.html.). These validations led to the conclusions given in the following section. Due to space limitations, and also to ease the flow of the presentation, only some illustrating and
summarizing plots and statistics will be shown. For practical reasons—specifically to avoid duplication— these are presented later in the article when the corrected ERA-40 dataset is also validated.
b. Validation Due to changes in the HS datasets assimilated into the ERA-40 system, the ERA-40 wave data needs to be divided into four sets according to their error characteristics: P1: Data for the periods from September 1957 to November 1991 (P1a) and from June 1993 to December 1993 (P1b), which had no altimeter waveheight data assimilation. P2: Data from December 1991 to May 1993, which had faulty ERS-1 FDP wave-height data assimilated. P3: Data from 1–1994 up to 5–1996, which had good but uncalibrated ERS-1 FDP wave-height data assimilated. P4: Data from June 1996 onward, which had ERS-2 FDP wave-height data assimilated. Figure 2 shows the time series of the global average of ERA-40 Hs monthly means. The data are averaged using latitude corrections; there is no physical interpretation of this global average, nor are there climatological values indicating the range of values such an average should take. The global average is presented here to give a synthesized picture of the data. The periods
446
JOURNAL OF ATMOSPHERIC AND OCEANIC TECHNOLOGY
VOLUME 22
FIG. 2. Time series of the ERA-40 monthly means as computed from 6-hourly fields between 81°S and 81°N.
associated with the four sets identified above can clearly be pointed out in the figure. The jump in period P2 is especially visible; this increase in the monthly means occurs because the faulty data that was assimilated had a density function with two peaks, one of the peaks being sharp and located around 2 m (see Bauer and Staabs 1998, their Fig. 11c). Period P4 can also be easily identified: it starts with a positive trend and then levels off. Validation of the data against the observations referred to above leads to the following conclusions for the different periods. P1: In this period the monthly mean wave fields compare well with observations, but the analysis exhibits peaks in synoptic Hs time series that are lower than those observed, and there tends to be also some overestimation of the low troughs (validations for the period prior to 1978 were only done at the SSLV location, and the only thing that can be said about it is that the errors between the ERA-40 data and SSLV observation prior to 1978 are similar to the ones from 1978 to November 1991). The upper half of Table 2 presents statistics comparing the ERA-40 data and the buoy observations. The statistics are given for the different periods according to the changes in the error characteristics of the ERA-40 data described above. Obviously, the comparisons for period P1a start only from January 1978, the date when the buoy observations start being available. The main feature revealed by the statistics for this period is the high values of SI as compared with the other periods. The corresponding 1%–99% quantile–quantile (Q–Q) plots of the ERA-40 data versus the buoy observations are presented in Fig. 7. The two top panels refer to data from the P1 period. The underestimation of the quantiles is clearly seen in the plots. This is also visible in the left panels of Figs. 9 and 13, which show Q–Q plots of the ERA-40 versus the TOPEX collocated data for a chosen month of P1, June 1993, and Geosat data for 1988, respectively. Table 3 presents the error statistics of the ERA-40 data versus the Geosat data for 1988. From the
table we can see that the characteristics of the errors change with latitude with underestimation being lower in the Tropics where the mean value of Hs is lower. P2: In this period the Hs values below 3 m are overestimated and those above are underestimated. The quality of the waves with heights above 3 m is similar to that in the period with no wave data assimilation. The Q–Q plot of ERA-40 data versus the TOPEX data in the left panel of Fig. 8 clearly exemplifies this behavior with data from May 1993. This is also clearly seen in the middle left panel of Fig. 7; the comparisons between the buoy and the ERA-40 quantiles present an overestimation bump for values between 1 and 3 m. In Table 2 we can see that this is the only period for which the bias in the monthly means and synoptic values is positive. P3: In this period the known calibration correction to the ERS-1 FDP data was not applied because, although it would have improved the analyzed Hs data, it would have given poorer, too high mean wave periods. The quality of the wave height data is therefore similar to that of the data in period P1, though it has a lower SI; this will be further shown in section 2c. Compare the left panels of Figs. 9 and 10 where Q–Q plots of the ERA-40 versus the TOPEX collocated data for a chosen month of each of the P1b and P3 periods exemplifies this. P4: The assimilation of the ERS-2 FDP measurements of wave height during P4 has improved the analyzed Hs, especially in the Tropics. The underestimation of high wave heights and the slight overestimation of low wave heights by the ERA-40 dataset, however, continues in this period, as is clearly seen in the two examples presented in the right panels of Fig. 6 and also in the Q–Q plots of Figs. 7 (bottom left) and 11.
c. Study of the impact of the assimilations of ERS-1 altimeter Hs observations For a period of 6 months, January–June 1994, we have performed an ERA-40 parallel experiment. The experiment ran from KNMI using ECMWF’s PrepIFS
APRIL 2005
CAIRES AND STERL
447
FIG. 3. Q–Q plots of TOPEX altimeter observations vs original ERA-40 data (asterisks) and the results of our experiment (circles) for Jan–Jun 1994.
application (available online at http://www.ecmwf.int/ services/prepifs/learn/help/prepIFSUserGuide/ prepIFSUserGuide.html). The run was a copy of the ECMWF’s ERA-40 run for that period, but without the assimilation of the ERS-1 FDP altimeter Hs data. Note that during this period correct ERS-1 altimeter observations were assimilated (period P3). The objective was to have an overlapping ERA-40 period with and without altimeter assimilation in order to be able to quantify and maybe mimic the effect of the assimilation. Figure 3 shows the Q–Q plots of the original ERA-40 data and the results from our ERA-40 experiment versus collocated TOPEX altimeter measurements. Apart from what happens with the data for January, the differences between using and not using data assimilation are small. The dataset produced with no data assimilation shows slightly less underestimation but, on the other hand, it has an SI about 0.02 larger than that of the dataset with data assimilation. The failure of the ERS-1 altimeter data assimilation to improve the error between the ERA-40 dataset and observations is due to the fact that the ERS-1 altimeter measurements for the period considered are underestimated. This can clearly be seen in Caires and Sterl (2003b) where the ERS-1 Hs observations from June to December 1994 are compared with collocated buoy and TOPEX observations. The decision of the ERA-40 production team not to linearly increase the assimilated ERS-1 measurements was due to the fact that the increase
in the significant wave heights also produced an unwanted increase in the respective mean wave periods. Another thing to note in the comparisons between the original ERA-40 data and that from our experiment with no data assimilation is that the reported problem in the ERS-1 FDP data from December 1991 to December 1993 also seems to be present in the January 1994 data, though to a lesser extent. Compare the top left panel of Fig. 3 with the left panel of Fig. 8 shown later. Both plots show a bump at low wave heights that is absent in the other periods. The bump in Fig. 8 is, however, larger than that in Fig. 3, indicating that the assimilated ERS-1 FDP data are probably less corrupted in January 1994. Indeed, at ECMWF it was established that the problem with the Hs of ERS-1 FDP was present in the data until 25 January 1994, and not until the end of December 1993 as initially thought, although it is not known whether the magnitude of the errors was smaller in January 1994 (J.-R. Bidlot 2003, personal communication).
3. Nonparametric correction a. The problem As shown in section 2b, the main problem with the ERA-40 Hs data is the underestimation of high peaks, which has not been overcome by the assimilation of the ERS altimeter data. Because the occurrence of underestimation is, to a certain extent, random, this problem cannot be solved by simply applying a parametric cor-
448
JOURNAL OF ATMOSPHERIC AND OCEANIC TECHNOLOGY
rection to the data. For example, linearly correcting the data will not be effective because not all the peaks need to be corrected, and not all peaks require the same amount of correction (see Fig. 6). A solution to the problem would be to somehow learn or understand how the underestimation process works in a range of situations, and then use this knowledge to predict the underestimation that would result in new situations, which consequently would enable an appropriate correction. A natural way to learn how underestimation takes place is to gather a large amount of observed and predicted data and quantify the statistical behavior of the corresponding underestimates according to the particular context in which they occurred. In statistical terms, our problem can thus be translated into that of predicting the value of one variable (an appropriate correction) conditionally on the information provided by other variables (the values of certain wind- and wave-related variables conditionally upon which the need for the correction arose), and hence to the problem of regression. The apparently difficult aspect of the proposed solution lies in two facts: first, the data we are interested in are dependent and nonstationary; second, it seems difficult to come up with a parametric function that would fit and explain the data in all situations (linear regression, for instance, would appear as unrealistic at the outset). Fortunately, there exist already very natural statistical tools tailored to deal precisely with our problems: nonparametric regression estimators. Nonparametric regression methods have been around for some time in the statistical literature, but they are not yet very well known in applied areas, in particular in oceanography. The books by Györfi et al. (1989) and Bosq (1998) provide many references and overviews of the main methods, which include estimation of conditional means as a special case and apply not only to random samples but also to general classes of time series. More recently, Caires and Ferreira (2005) have proved the consistency of estimators of the conditional distribution function, of estimators of conditional quantiles, and estimators of conditional means, for sequences of certain conditionally stationary random variables, a class of processes that includes stationary as well as Markov processes. Roughly speaking, a conditionally stationary process is a process that behaves at all times in the same way conditionally on the same information. As illustrated by the application of Caires and Ferreira (2005) to Hs time series, wave data seems to conform approximately to the hypotheses of a conditional stationary process.
b. Heuristic explanation of the method Applied to our problem, the natural prediction method suggested by nonparametric regression estimators (and advocated in particular by Caires and Ferreira 2005) consists of predicting the required correction of an Hs value of ERA-40, HE s , at a certain time given m
VOLUME 22
consecutive HE s values, in terms of the conditional distribution and conditional mean of the correction as estimated from a learning dataset—that is, a dataset containing both ERA-40 and measurements, and hence also corrections. To predict the correction that should be applied given the knowledge of a vector of m consecutive HE s values, which we may refer to as the conditioning vector, the method consists in the first place of looking in the learning dataset for other vectors of m consecutive HE s values that are close, componentwise, to the conditioning vector. Figure 4 exemplifies how this is done for a fictitious ERA-40 Hs time series: The two enveloped sequences of three observations correspond to events that are in some sense close to each other; specifically, the distance between each of the three components in the first enveloped sequence and the analogous component in the second enveloped sequence is less than a certain h ⬎ 0. Accordingly, if the process is conditionally stationary, the error between the last value of the first enveloped sequence and the corresponding measurement (the distance marked by the black arrow) can be used to predict the error between the last values of the second enveloped sequence and the corresponding measurement. Of course, this prediction would be based on a single analog (the first enveloped sequence) and therefore might be quite inaccurate. However, if more analogs can be found, then a more accurate forecast can be obtained by averaging the errors associated with each analog. The corresponding formulas are given in the next section. In our applications we are using the above estimators with one variable (Hs) to obtain corrections of ERA-40 values. The method is, however, general, and can be used with several variables simultaneously, as for instance with Hs and U10, and for other purposes, such as forecasting (Caires and Ferreira 2005) or filling gaps.
c. Formal description of the method To introduce our estimators, we denote V as the correction to be applied to an HE s value at a particular time and location, and U as a vector of dimension m containing the HE s value at that time and the m ⫺ 1 previous HE s values (all at the particular location). To predict V on the basis of the knowledge that U ⫽ u we need to know the conditional mean of V given U ⫽ u, R共u兲 ⫽ E共V | U ⫽ u兲, and the conditional distribution function of V given U ⫽ u, F 共 | u兲 ⫽ P共V ⱕ | U ⫽ u兲. Although these items are unknown, we can estimate them using a sample of pairs (Ui, Vi), i ⫽ 1, . . . , n, where Ui and Vi are analogous to the above U and V variables. This sample of pairs can be obtained from
APRIL 2005
449
CAIRES AND STERL
FIG. 4. Example of the nonparametric prediction of a correction. The asterisks indicate measurements, and the circles the uncorrected time series values.
ERA-40 data and buoy/altimeter measurements whenever the two are available at the same time and location, so that the corrections are also available. Write S(u, h) ⫽ {uⴕ 僐 ⺢m: | uj ⫺ u⬘j | ⬍ h, j ⫽ 1, . . . , m} for h ⬎ 0, and let hn ⬎ 0 be a given number depending on the sample size n. Then the estimator of R(u) is called the empirical regression function and is defined by
hn ⫽ 共cn␣⫺1 logn2兲1Ⲑm,
n
Rn共u兲 ⫽
兺
Vi1关Ui僐S共u,hn兲兴
i⫽1
n
兺1 i⫽1
,
共1兲
关Ui僐S共u,hn兲兴
n
Fn共 | u兲 ⫽
兺1
关Viⱕ,Ui僐S共u,hn兲兴
n
兺1 i⫽1
共3兲
where c and ␣ are constants, which just like m have to be determined empirically.
d. Application to the correction of Hs data
and the estimator of F( |u) is called the empirical conditional distribution function and is defined by
i⫽1
find a prediction interval for V with a specified approximate probability of containing it. Besides the choice of m, the application of the method now outlined requires the specification of hn, which is called the smoothing parameter. In theory, hn should tend to 0 as n tends to infinity, and in most applications one may suppose that (see Caires and Ferreira 2005)
, 僐 ⺢.
共2兲
关Ui僐S共u,hn兲兴
Here, the notation 1A, where A is an event, means 1 if A occurs, and 0 otherwise. Thus, each value of both Rn(u) and Fn( | u) is an average whose terms include only those values of Vi for which Ui 僐 S(u, hn). The motivation for using these estimators is that they both converge (as n grows) in some sense and in certain conditions to their theoretical counterparts, R(u) and F(| u) (see Caires and Ferreira 2005 and references therein). Once Rn(u) is available, one can estimate an unˆ : ⫽ R (U). known value of V on the basis of U by V n Similarly, using Fn( | u) one can estimate the probability that the unknown value of V falls in a particular interval (a, b) by Fn(b | U ) ⫺ Fn(a | U ), and consequently
In the following we will try to correct the ERA-40 Hs fields based on sequences of m ⫽ 3 observations and on the error between the last value in the sequence and the corresponding measurement. Referring to Fig. 4, once a match of three observations is found we gather the error between the last value and a corresponding measurement. More precisely, recalling that the ERA-40 time resolution is 6 h, given a dataset of pairs [HE s (x, t), E (x, t)] we match the sequence [H (x, t ⫺ 12), Hmeas s s E E HE s (x, t ⫺ 6), Hs (x, t)] with sequences [Hs (xi, ti ⫺ 12), E HE s (xi, ti ⫺ 6), Hs (xi, ti)], and gather the errors between the last ERA-40 values and the corresponding mea(xi, ti) ⫺ HE surements, [Hmeas s s (xi, ti)]. Assuming that p matches were gathered, the corrected value of Hs, HC s (x, t), is given by HsC共x, t兲 ⫽ HsE共x, t兲 ⫹
1 p
p
兺 关H
meas 共xi, ti兲 s
⫺ HsE共xi, ti兲兴.
i⫽1
共4兲 Two sequences are said to match or to be each other’s E E E analog if |HE s (xi, ti) ⫺ Hs (x, t)| ⬍ hn, |Hs (xi, ti ⫺ 6) ⫺ Hs (x, E E t ⫺ 6)| ⬍ hn and |Hs (xi, ti ⫺ 12) ⫺ Hs (x, t ⫺ 12)| ⬍ hn.
450
JOURNAL OF ATMOSPHERIC AND OCEANIC TECHNOLOGY
TABLE 1. Periods covered by the datasets used in the creation of the C-ERA-40 dataset. The dates in italics correspond to periods where the data used come from our parallel experiment. Descriptor P1* P2 P3* P4
Periods covered by the data being corrected
Periods covered by the learning dataset
Jan 1958–Nov 1991, Jun–Dec 1993, and Jan 1994 Dec 1991–May 1993 Feb 1994–May 1996 Jun 1996–Dec 2001
Jun–Dec 1993 and Jan–Jun 1994 Jan 1993–May 1993 Jan 1994–Dec 1995 Jan 1997–Dec 1998
* Note the slight change in the periods covered by P1 and P3.
Here hn is given by (3), with c ⫽ 0.3m/(700␣⫺1 log 7002) and ␣ ⫽ 0.2. (⌻his choice of c allows two sequences to be considered as analogs if the maximum absolute difference between them is of at most 30 cm, when the sample size of possible analogs is n ⫽ 700.) The choices of m, c, and ␣ were based on some performance checks. The use of the same constraint (⬍hn) on the three components as a criterion for including or excluding analogs reflects the fact that all components pertain to the same variable, and also the lack of reliable information as to which constraints, if any, should be slackened or made tighter. In Eq. (4) we are considering analogs at locations xi, ti other than those where the correction is to apply. Naturally, this requires some restrictions on the distances | x ⫺ xi | and t ⫺ ti, which will be defined in the following section.
4. Nonparametric correction of the ERA-40 data a. Correction methodology We have corrected the full 45-yr ERA-40 Hs dataset using the procedure described in the previous section. We will refer to the corrected Hs dataset as C-ERA-40. The measurements used to estimate the conditional mean and distribution functions were collocated TOPEX measurements. At each location the learning set is composed by sequences that are within a 10° circle
VOLUME 22
centered at the location for which the values are being corrected. We have carried out many trials and sensitivity tests in order to decide which dataset should be used in the creation of the C-ERA-40 dataset, the amount of past observations to be taken into account, which parameter(s) should be used to define the conditional mean, and how big the learning dataset should be. We have started by correcting the ERA-40 Hs values at a buoy location based on a learning dataset consisting of sequences of ERA-40 Hs values and the errors between the ERA-40 and buoy observations at that location for periods other than the period being considered. The results were quite encouraging, and independent of whether the period being corrected was or was not included in the learning dataset. We then tried to generalize our procedure by correcting the ERA-40 Hs values at a buoy location using a learning dataset obtained at locations other than the one being considered. The results were also encouraging and sometimes even better than those obtained by a learning dataset with only buoy data from the location at which the data was being corrected. From this experiment we learned that the most effective learning set would consist of data from buoys at latitudes not very far from those being considered, while distances in longitude seemed to have no effects. Since the distance in latitude between the locations of the data being corrected and the data considered for the learning dataset have an effect on the quality of the correction, and since buoy locations are mainly at high latitudes and in the Northern Hemisphere, it would not be optimal to correct the whole ERA-40 dataset by a learning dataset containing only buoy observations. We thus turned our attention to the TOPEX dataset, which is the longest Hs altimeter dataset available and covers almost the whole globe (from 63°S to 63°N). We began by building a learning set with data at a distance of at most 10° in latitude from the location of the data point being corrected and putting no constraints on distances in longitude. This, however, resulted in poor results in the Gulf of Mexico. Better results were obtained by also restricting the longitudinal distance. The final
FIG. 5. Time series of the ERA-40 and the corrected ERA-40 datasets monthly means as computed from 6-hourly fields between 66°S and 66°N. ERA-40 (solid line), C-ERA-40 (dashed line).
APRIL 2005
CAIRES AND STERL
451
FIG. 6. (left) Observations of 6-hourly buoy (solid line), C-ERA-40 (circles) values, and the corresponding 95% confidence bands (dashed lines) and errors (dotted line). (right) Observations of 6-hourly buoy (solid line), ERA-40 (dotted line), and C-ERA-40 (dashed) values. (top) Aug 1996 and (bottom) Dec 1996.
learning dataset contains data from a 10° circle around the point in question. From our assessment of the ERA-40 data we had noted that one of the important variables in the underestimation of the high peaks of Hs is the presence or absence of swell. High peaks are more likely to be underestimated when the sea state is a mixture of swell and wind sea. We have therefore tried to look for analogs where not only the last three consecutive observations of HS are within certain margins but also such that the ratio between the significant wave height of wind sea and Hs at the time at which we want to predict the corrections is within a certain margin. This extra restriction decreased the number of values contributing to the conditional mean estimate, increased the computational effort, and only gave marginal improvements in
some situations. We have therefore decided to consider only Hs. The learning dataset thus consists of sequences of three ERA-40 Hs values and the error between the ERA-40 data and the TOPEX observations. Next, we conducted some sensitivity studies as to how big the learning dataset should be. Our results have shown that a 2-yr dataset is the most effective, although the performance is not much better than that obtained from a 1-yr dataset. Datasets longer than 2 yr increase the computational costs significantly while providing no visible improvements. As specified in section 2b the error characteristics of the ERA-40 data vary in time and therefore we have to change the periods covered by the learning sets accordingly. TOPEX observations are available during the
452
JOURNAL OF ATMOSPHERIC AND OCEANIC TECHNOLOGY
VOLUME 22
TABLE 2. Comparative statistics between buoy measurements and (top) ERA-40 and (bottom) C-ERA-40 data. Synoptic values
Monthly means
Monthly variances
n
Bias
Rmse
SI
Bias
Rmse
SI
Bias
Rmse
SI
ERA-40 P1a P1b P2 P3 P4 All
226 858 14 407 34 176 54 778 102 085 432 304
⫺0.21 ⫺0.20 0.08 ⫺0.30 ⫺0.17 ⫺0.19
0.53 0.46 0.45 0.50 0.42 0.49
0.23 0.21 0.20 0.18 0.18 0.21
⫺0.21 ⫺0.18 0.07 ⫺0.29 ⫺0.17 ⫺0.19
0.35 0.30 0.30 0.34 0.25 0.32
0.13 0.12 0.13 0.08 0.09 0.12
⫺0.35 ⫺0.25 ⫺0.30 ⫺0.31 ⫺0.29 ⫺0.32
0.51 0.35 0.46 0.45 0.44 0.48
0.50 0.47 0.50 0.45 0.48 0.49
C-ERA-40 P1a P1b P2 P3 P4 All
226 858 14 407 34 176 54 778 102 085 432 304
0.00 0.00 ⫺0.02 ⫺0.01 ⫺0.04 ⫺0.01
0.42 0.35 0.40 0.35 0.35 0.39
0.20 0.18 0.18 0.16 0.16 0.19
0.01 0.01 ⫺0.03 0.00 ⫺0.03 ⫺0.01
0.22 0.14 0.24 0.15 0.16 0.20
0.10 0.07 0.11 0.07 0.07 0.09
⫺0.12 ⫺0.10 ⫺0.16 ⫺0.12 ⫺0.07 ⫺0.11
0.31 0.17 0.34 0.27 0.25 0.29
0.38 0.27 0.42 0.32 0.36 0.37
whole P3 and P4 periods and therefore we have defined in each case learning sets of 2 yr of overlapping periods. For the P2 period the overlap with the TOPEX data is only 5 months, January–May 1993; these are less than optimal conditions, but as we will see the results are still impressive. For the P1 period the overlap with the TOPEX data is only 7 months, June–December 1993; these are again less than optimal conditions. The learning dataset can, however, be increased by including the dataset generated by our experiment with no ERS-1 altimeter data assimilation described in section 2c. In doing so, the learning dataset extends from June 1993 to June 1994, covering more than a whole year, a clearly desirable extension taking into account the fact that the P1 period is by far the largest one. Table 1 indicates the periods covered by the learning sets used to correct the ERA-40 data and the corresponding periods that were corrected. Since the TOPEX data are only available from January 1993 onward, the learning sets start only from that date. The dates in italic correspond to periods where the ERA-40 data used is not the official ERA-40 data but the one generated by our experiment described in section 2c. As shown in section 2c error characteristics of the ERA-40 data for January 1994 are different from those of the rest of the P3 period and also from those on the P2 period. We have therefore replaced the ERA-40 January 1994 data by that coming form our ERA-40 run and corrected it as if it belonged to the P1 period. Another aspect worth mentioning, which also results from our sensitivity studies, is that accounting for the differences in the error characteristics of the ERA-40 Hs dataset in the choice of the periods of the corresponding learning datasets is of the utmost importance for the effectiveness of the correction of the ERA-40 data. For example, correcting an ERA-40 field belonging to the period P1 with the learning set assigned to the period P4 (January 1997–December 1998) leads to less improvement of the original fields and in some cases
even to their deterioration (mainly for low values of Hs). Figure 5 shows the time series of the global mean of the C-ERA-40 field and compares it with the time series of the global mean of the ERA-40 Hs field. It is immediately obvious from the figure that • the C-ERA-40 data does not have the inhomogene-
ities present in the ERA-40 data (the transition from P1 to P2, the trend in P4), and • the mean of the C-ERA-40 time series is higher than that of the corresponding ERA-40 data. In the following two subsections we will validate the C-ERA-40 dataset against in situ buoy observations and global altimeter observations.
b. Validation of the C-ERA-40 data against in situ buoy measurements Figure 6 compares buoy observations from a location off southwest Alaska with the corresponding ERA-40 and C-ERA-40 data; the top (bottom) panels illustrate the comparison for August (December) 1996. Figure 6 (left panels) shows the 6-hourly time series of buoy observations (full line), the C-ERA-40 time series (circles) along with its 95% confidence bands (dashed lines), and the difference between the two (dotted line), that is, the series of biases of the C-ERA-40 data. The C-ERA-40 represents a clear improvement for the ERA-40 data. Specifically, the C-ERA-40 shows less underestimation of the high peaks and less overestimation of the low values, and still remains close to the ERA-40 data whenever the latter compares well with the buoy observations. However, the nonparametric correction method is powerless in correcting mismatches due to lack or extra features in the ERA-40 data. For example, the noise or small-scale features of the buoy observations during the first days of August (Fig. 6, top right) are absent in the ERA-40 time series,
APRIL 2005
CAIRES AND STERL
453
FIG. 7. Graphs comparing the quantiles of buoy Hs observations against original ERA-40 data (asterisks) and C-ERA-40 data (circles) for different periods.
and the nonparametric correction cannot reproduce the buoy variations. It only adjusts the values to a level closer to the observations. This can be further seen in the small peak on 28 August. In the ERA-40 data this
peak occurs 12 h earlier, and the nonparametric correction cannot shift it. In August 1996 the correction of the ERA-40 reduces the bias from 0.04 to ⫺0.03, the rmse from 0.25 to 0.19,
454
JOURNAL OF ATMOSPHERIC AND OCEANIC TECHNOLOGY
VOLUME 22
FIG. 8. (left): Q–Q plots comparing the TOPEX Hs measurements against ERA-40 data (asterisks) and C-ERA-40 data (circles). (right) Bias in the ERA-40 and C-ERA-40 data monthly means. Data for May 1993 (period P2).
and the SI from 0.16 to 0.11; moreover, the confidence band covers 100% of the true values. In December 1996 the bias changes from ⫺0.50 to 0.03, the rmse from 0.79 to 0.51, and the SI from 0.13 to 0.11; the confidence band covers 96.77% of the true values. Table 2 presents statistics (bias, rmse, SI, sample size) quantifying and comparing the quality of the ERA-40 and C-ERA-40 data relative to buoy observations in terms of synoptic values, monthly means, and monthly variances over the several periods considered. The results show that the C-ERA-40 data always compare better with the observations than the ERA-40 data. By virtue of the correction the biases are reduced by about 20 cm, and the rmse by 5–20 cm; the SI statistics also become smaller. This improvement of the C-ERA-40 data on the ERA-40 data is visible in the synoptic values, monthly means and variances.
Figure 7 shows Q–Q plots of the ERA-40 and CERA-40 data versus the buoy observations for the periods considered in Table 2. The plots show that the nonparametric corrections work effectively in the whole range of Hs values and for periods with different error characteristics. Specifically, compare the middleleft panel (period P2) with the top-right panel (period P1b). The error characteristics of the ERA-40 data are quite different in these two periods. In the P2 data there are an overestimation for wave heights around 2 m, which is easily identified in the plot by a bump in the ERA-40 data. This bump is nonexistent in the C-ERA40 data. On the other hand, in the P1b ERA-40 data there is a bump of underestimation of data around 1.5 m. This bump also does not exist in the C-ERA-40 data and the underestimation of the high quantiles is also substantially reduced. From these plots it is apparent
FIG. 9. The same as Fig. 8, but for Jun 1993 (period P1).
APRIL 2005
CAIRES AND STERL
455
FIG. 10. The same as Fig. 8, but for May 1994 (period P3).
that the C-ERA-40 still underestimates high Hs values, although less so than the ERA-40 data does. Also, for very low wave heights (below 1 m) the C-ERA-40 data compare slightly worse with the buoy observations than does the ERA-40 data.
c. Validation of the C-ERA-40 data against global altimeter measurements We now look at some spatial fields to see how the data are being corrected in different ocean basins and regions. Figures 8–11 present the biases between the ERA-40 and C-ERA-40 data monthly means (right panels) and the Q–-Q plots of the corresponding ERA40 and C-ERA-40 data versus TOPEX observations. The figures are for a selected month in each of the periods for which different learning sets were consid-
ered: May 1993 (P2), June 1993 (P1b), May 1994 (P3), and June 1996 (P4). The Q–Q plot comparisons are similar to those for the in situ data (Fig. 7) and identify the same problems in the quantiles—for example, the overestimation of waves around 2 m in the P2 period and a general underestimation of high quantiles. The comparisons between TOPEX and the C-ERA-40 data show that these mismatches have been substantially reduced. Looking in more detail at the geographical differences between the ERA-40 and C-ERA-40 data, it can be observed in Fig. 8 (right) that the monthly means of the ERA-40 data, for this example of P2, are too high in the regions where the mean values of Hs are low, especially in the Tropics, and are too low in the Northern and Southern Hemisphere storm track regions and at some semi-enclosed regions, such as the Gulf of Mexico
FIG. 11. The same as Fig. 8, but for Jun 1996 (period P4).
456
JOURNAL OF ATMOSPHERIC AND OCEANIC TECHNOLOGY
VOLUME 22
FIG. 12. Monthly statistics of the comparisons between the ERA-40 and the corrected ERA-40 datasets collocated with the TOPEX data: (top) monthly means (computed using no latitude correction), (middle) rmse, and (bottom) scatter index.
and the Sea of Japan. From Fig. 9 we can see that the ERA-40 monthly means for P1 are almost everywhere too low except for some regions in the tropical Pacific and off the western coast of America. This behavior is similar to that for period P4, as illustrated in Fig. 11. Figure 10 shows that the underestimation of the ERA-40 data for P3 is global, the biggest corrections
occurring, as for the other periods, in the storm track regions. For the whole period for which TOPEX data are available, Fig. 12 compares monthly statistics of the ERA-40 and C-ERA-40 data with the collocated TOPEX observations. The top panel presents the monthly means of the TOPEX data versus the respec-
TABLE 3. Comparative statistics between Geosat measurements and the ERA-40 and the C-ERA-40 data. The x column represents the mean of the observations. Data for 1988.
TABLE 4. Comparative statistics between ERS-2 measurements and the ERA-40 and the C-ERA-40 data. The x column represents the mean of the observations. Data for Jun 1995–May 1996.
ERA-40
C-ERA-40
ERA-40
C-ERA-40
Region
x
Bias
Rmse
SI
Bias
Rmse
SI
Region
x
Bias
Rmse
SI
Bias
Rmse
SI
20°–80°N 20°S–20°N 80°–20°S Global
2.55 1.92 3.21 2.65
⫺0.20 ⫺0.01 ⫺0.22 ⫺0.15
0.54 0.32 0.59 0.51
0.20 0.17 0.17 0.18
0.09 0.07 0.10 0.09
0.46 0.31 0.53 0.45
0.18 0.16 0.16 0.17
20°–80°N 20°S–20°N 80°–0°S Global
2.35 1.82 3.15 2.51
⫺0.19 ⫺0.06 ⫺0.29 ⫺0.19
0.46 0.26 0.52 0.43
0.18 0.14 0.14 0.15
0.13 0.12 0.12 0.12
0.39 0.26 0.41 0.36
0.16 0.13 0.12 0.13
APRIL 2005
CAIRES AND STERL
457
FIG. 13. Graphs comparing the Q–Q plots of altimeter collocated Hs observations against ERA-40 (asterisks) and C-ERA-40 data (circles) for different periods: (left) Geosat data for Jan–Dec 1988, and (right) ERS-2 data for Jun 1995–May 1996.
tive ERA-40 and C-ERA-40 data. As for the buoy comparisons, the C-ERA-40 data have a bias very close to zero and about 20 cm lower than that of the ERA-40 data. The middle and bottom panels of the figure show the ERA-40 and C-ERA-40 rmse and SI time series, respectively. The reduction in rmse reaches 20 cm, and that of SI is at least 0.02. The largest discrepancies between the TOPEX and the C-ERA-40 data are for data from the P1 period and for February 2001. The higher error statistics in the P1 (1993) period can be explained by the fact that the training set for this period is about half the size of the one used in the following periods. The discrepancies in February 2001 are due to some changes in the errors characteristics of the ERA-40 data from 9–14 February due to the assimilation of faulty ERS-2 FDP data (J.-R. Bidlot 2003, personal communication). From these plots it is clear that the inhomogeneities of the ERA-40 data are not present in the C-ERA-40 data. Also worth noting is the fact that the nonparametric correction works well irrespective of whether there is an overlap between the learning dataset and the data; compare the statistics of the CERA-40 for the last 3 yr (1999–2001, when there is no overlap) with the 2 yr before (1997–98, when there is an overlap). The global validation presented so far was in comparison to the TOPEX data. The data, however, are not independent of the C-ERA-40 dataset (especially in the periods overlapping the learning set periods) since it was used in its creation. Therefore, it is desirable to validate it with independent observations other than buoy since these are not global. We have therefore validated the C-ERA-40 data against Geosat and ERS-2 global observations. Tables 3 and 4 give statistics comparing measurements from Geosat and from ERS-2 with the ERA-40 and the C-ERA-40 data over different latitudinal
bands. The Geosat data are from 1988, and those from ERS-2 for June 1995–May 1996, the period that ERS-2 was not assimilated into ERA-40. The negative bias in the ERA-40 data becomes positive in the C-ERA-40 data, except for in the Tropics where the magnitude is lower. In terms of rmse and SI, the C-ERA-40 dataset compares better with observations everywhere. Figure 13 shows the Q–Q plots of the ERA-40 and C-ERA-40 data versus the Geosat (left) and the ERS-2 (right) altimeter observations. The plots testify to the superiority of the C-ERA-40 dataset relatively to the ERA-40 dataset for Hs values above 1.5 m. The comparison between the data and the Geosat observations is very similar to that with the ERS-2 observations. The plots show no underestimation of the high Hs values by the C-ERA-40 data, but show some overestimation of the Hs values below 5 m. This is in contradiction with the validation of the C-ERA-40 data against buoy and TOPEX data and may indicate a small underestimation of Hs by the Geosat and ERS-2 data. As we mentioned before a 1.065 correction factor was applied to the Geosat data, and no correction was applied to the ERS-2 data. In more recent work Cotton et al. (1997), again using buoy data as reference, postulate a linear correc⫽ 1.069HGeosat ⫹ 0.089 tion to the Geosat data of Hbuoy s s and also a linear correction to the ERS-2 data of Hbuoy s ⫽ 1.053HERS-2 ⫹ 0.189. The application of this positive s increments to the Geosat and ERS-2 data would make their comparison with the ERA-40 and C-ERA-40 data compatible with their comparisons with the buoy and TOPEX data.
5. Conclusions Limitations in the ERA-40 Hs data seriously discourage its use for direct studies of climate variability and
458
JOURNAL OF ATMOSPHERIC AND OCEANIC TECHNOLOGY
trends. The two main limitations of the data are the existence of inhomogeneities in time that are due to the assimilation of different altimeter Hs datasets in the ERA-40 computations, and the underestimation of high Hs values that discourages the use of the data in design studies where the good description of the data in all ranges is important. We have presented results of the data validation against high quality measurements and have assessed the effects of the assimilation of one of the altimeter datasets by presenting results of an ERA-40 parallel experiment with and without ERS-1 altimeter data assimilation. Our results have shown that one of the reasons for the poor results given by the data assimilation was the bad quality of the data being assimilated, and that even in periods when the data being assimilated are supposedly of good quality (the period when ERS-2 altimeter HS observations have been assimilated) the results are still far from good. We then proposed a new approach to improve the ERA-40 Hs fields based on nonparametric estimation, the idea being to estimate for each ERA-40 Hs value the error between the ERA-40 value and the “true” Hs value and then correct the data using the estimate, thus creating a new 45-yr global 6-hourly dataset: the C-ERA-40 dataset. This was achieved by taking into account the changes in the error characteristics of the ERA-40 data, using the differences between certain ERA-40 values and the corresponding TOPEX measurements, along with the behavior of the ERA-40 time series at that location from 12 h before the time of the observation. Comparisons of the C-ERA-40 data with measurements from in situ buoy and global altimeter data show clear improvements in bias, scatter, and quantiles in the whole range of values and the removal of the inhomogeneities present in the ERA-40 dataset. The success of the application of the nonparameteric method to correct the ERA-40 Hs is in the first place due to the flexibility and generality of the method, and in the second place to the existence of global TOPEX measurements in all the periods during which the errors of the ERA-40 data have different characteristics. Limitations are the necessity of having a learning dataset (TOPEX measurements) in all the periods with different error characteristics and the prerequisite knowledge of the periods with a given type of error characteristics. There were some caveats in the ERA-40 data that remain in the C-ERA-40 dataset. • ⌻he ERA-40 model does not account for shallow-
water effects and therefore the data are only valid in deep-water regions. • Due to resolution, tropical cyclones are not resolved by the ERA-40 system. Therefore, the data for the regions of the tropical storms may be too low. Acknowledgments. We are indebted to our data sources, namely, the ERA-40 team for the ERA-40 data; Helen Snaith of SOC for the altimeter data; and
VOLUME 22
the United States National Oceanographic Data Center for the buoy data. We are also indebted to José Ferreira for statistical advice and comments, to our colleague Camiel Severijns for the Field Library and technical support, and to Dominique Lucas and Jean Bidlot at ECMWF for technical support in the running of the ERA-40 parallel experiment presented here; we thank Jean further for a careful revision of our initial manuscript and for useful suggestions. We also thank INTAS (Grant 96-2089) for facilitating discussion with Sergey Gulev, David Woolf, and Roman Bortkovsky. This work was funded by an EU-funded ERA-40 Project (No. EVK2-CT-1999-00027). REFERENCES Bauer, E., and C. Staabs, 1998: Statistical properties of global significant wave heights and their use for validation. J. Geophys. Res., 103, 1153–1166. Bidlot, J.-R., D. J. Holmes, P. A. Wittmann, R. Lalbeharry, and H. S. Chen, 2002: Intercomparison of the performance of operational wave forecasting systems with buoy data. Wea. Forecasting, 17, 287–310. Bosq, D., 1998: Nonparametric Statistics for Stochastic Processes. Lecture Notes in Statistics 110, 2d ed., Springer-Verlag, 231 pp. Caires, S., and A. Sterl, 2003a: On the estimation of return values of significant wave height data from the reanalysis of the European Centre for Medium-Range Weather Forecasts. Safety and Reliability, T. Bedford and P. H. A. J. M. van Gelder, Eds., Proc. of the European Safety and Reliability Conference, Lisse. Swets & Zeitlinger, 353–361. ——, and ——, 2003b: Validation of ocean wind and wave data using triple collocation. J. Geophys. Res., 108, 3098, doi:10.1029/2002JC001491. ——, and J. A. Ferreira, 2005: On the nonparametric prediction of conditionally stationary sequences. Stat. Inf. Stoch. Proc., 8, 151–184. ——, A. Sterl, J.-R. Bidlot, N. Graham, and V. Swail, 2004: Intercomparison of different wind wave reanalyses. J. Climate, 17, 1893–1913. Cavaleri, L., and L. Bertotti, 2003: The characteristics of wind and wave fields modelled with different resolutions. Quart. J. Roy. Meteor. Soc., 129, 1647–1662. Challenor, P., and D. Cotton, 1999: Trends in TOPEX significant wave height measurement. [Available as a pdf document online at http://www.soc.soton.ac.uk/JRD/SAT/TOPtren/ TOPtren.pdf.] Cotton, P. D., and D. J. T. Carter, 1996: Calibration and validation of ERS-2 altimeter wind/wave measurements. Southampton Oceanography Centre Int. Doc. 12, 119 pp. ——, P. G. Challenor, and D. J. T. Carter, 1997: An assessment of the accuracy and reliability of GEOSAT, ERS-1, ERS-2 and TOPEX altimeter measurements of significant wave height and wind speed. CEOS Wind and Wave Validation Workshop, ESA WPP-147, Noordwijk, Netherlands, ESTEC, 81– 93. Cox, A. T., and V. R. Swail, 2001: A global wave hindcast over the period 1958–1997: Validation and climate assessment. J. Geophys. Res., 106, 2313–2329. Györfi, L., W. Härdle, P. Sarda, and P. Vieu, 1989: Nonparametric Curve Estimation from Time Series. Lecture Notes in Statistics, No. 60, Springer-Verlag, 161 pp. Janssen, P. A. E. M., B. Hansen, and J. Bidlot, 1997: Verification of the ECMWF wave forecasting system against buoy and altimeter data. Wea. Forecasting, 12, 763–784. Rogers, W. E., and P. A. Wittman, 2002: Quantifying the role of wind field accuracy in the U.S. Navy’s global ocean wave
APRIL 2005
CAIRES AND STERL
nowcast/forecast system. CD-ROM 7th Int. Workshop on Wave Hindcasting and Forecasting, Banff, Alberta, Canada, U.S. Army Engineer Research and Development Center, Coastal and Hydraulics Laboratory, the Fleet Numerical Meteorology and Oceanography Center, and the Meteorological Service of Canada, CD-ROM. Snaith, H. M., 2000: Global Altimeter Processing Scheme user manual, V1. Southampton Oceanography Centre Tech. Rep. 53, 44 pp. Sterl, A., G. J. Komen, and P. D. Cotton, 1998: Fifteen years of
459
global wave hindcasts using winds from the European Centre for Medium-Range Weather Forecast reanalysis: Validating the reanalyzed winds and assessing the wave climate. J. Geophys. Res., 103, 5477–5494. Swail, V. R., and A. T. Cox, 2000: On the use of NCEP–NCAR reanalysis surface marine wind fields for a long-term North Atlantic wave hindcast. J. Atmos. Oceanic Technol., 17, 532–545. Wang, X. L., and V. R. Swail, 2002: Trends of Atlantic wave extremes as simulated in a 40-yr wave hindcast using kinematically reanalyzed wind fields. J. Climate, 15, 1020–1035.