A Parallel Debugger with Support for Distributed Arrays, Multiple Executables and Dynamic Processes Peter Fritzson, Roland WismiJllerl,Olav Hansen 2, Jonas Sala 3, Peter Skov PELAB, Dept. of Computer and Information Science Link6ping University, S-581 83 LinkOping, Sweden Email:
[email protected]; Phone: +46-13-281000; Fax: +46-13-282666
In this paper we present the parallel debugger DETOP with special emphasis on new support for debugging of programs with distributed data structures such as arrays that have been partitioned over a number of processors. The new array visualizer within DETOP supports transparent browsing and visualization of distributed arrays which occur in languages such as High Performance Fortran. Visualization of sparse arrays is supported through an array mapper facility, as well as transparent visualization of arrays which have been partitioned by hand for applications in C or Fortran77. Color coding makes the visualization more expressive and easier to read. DETOP provides a graphical user interface that is simple to use even for inexperienced users and supports not only static data parallel programs, but also dynamic programs and parallel applications based on functional decomposition. The combination of support for applications that include dynamic process creation, multiple executables, processes and threads, and distributed data structures, makes DETOP rather unique among parallel debuggers. DETOP has been implemented for Parsytec PowerPC based multicomputers with Sparcstation frontends. Ongoing efforts include portable versions of DETOP for PVM and MPI run-time environments. Abstract.
1 Introduction The state of the art in programming large scale parallel applications are programs with explicit parallelism. The parallelism is either defined in a programming model with explicit message passing or by giving data distributions like those in High Performance Fortran. To achieve more effective development of correct and efficient parallel programs, support must be provided for all phases of the program design and implementation. In this paper, however, we focus on the support of the debugging process of programs that have been implemented and are being executed on parallel hardware platforms. Existing tools in this area have deficiencies that limit their usability to a subclass of typical applications. Easy-touse debugging tools have so far been limited to single threaded programs or to programs that have a static process structure. Programs that dynamically create new processes and consist
1. Department of Computer Science, University of Technology, Munich, D-802 90 M~nchen, Germany. Email: wismuell @informatik.tu-muenchen.de 2. Affiliationduring this work: PELAB; Current affiliation: Parsytec Gmbh, JiJticher Strasse 338, D-52070 Aachen, Germany. Email:
[email protected] 3. Parallel Systems, Dalv/igen 8, S-171 23, Solna, Sweden
342
of multiple executables are not supported by most other debugging tools. We present the parallel debugger DETOP which is available for Parsytec PowerPC based parallel computing systems (PowerXplorer, GC/PowerPlus, CC) running the PARIX operating system. DETOP supports debugging of applications containing both functional and data parallelism. Applications may consist of multiple threads and multiple program modules. Visualization of distributed arrays partitioned over multiple processes is supported. Prototypes of DETOP [BeWi94] were developed at LRR, the Technical University of Munich. The new support for visualization of distributed arrays was developed at PELAB, Link~Sping University, Sweden. The run-time debugging support (similar to the Unix Ptrace mechanism) within PARIX was implemented by Parsytec. The DETOP effort is thus an excellent example of both European cooperation between universities, and successful cooperation between universities and industry. In the next section we give a brief overview on existing debugging tools including their limitations. In section 3 we present the primary design goals that should be satisfied. Section 4 introduces the user interface and command set of DETOP, while the next section gives some details on the implementation. A short conclusion and future plans are presented in section 6.
2
Related Work
To support the process of detecting and locating bugs in a program, a debugger must provide functionality to watch the internal execution of that program. There are two different methods how to gather, analyze and present run time information: the off-line and the online approaches. Most parallel computing platforms provide tools that allow recording and viewing event traces, e.g. ParaGraph [Heath93]. Though mostly aimed towards performance analysis, these tools can, to some extent, also be used for correctness debugging. However, the way in which event traces are visualized is not suitable for massively parallel or dynamic systems. Ariadne [CFH+93] uses event abstractions to deal with the difficulty of presenting large amounts of events to the user. Instead of visualizing the raw event streams, Ariadne allows the user to define abstract events and to ask if and where these abstract events occur. DARTS [TGL93] even goes further and transforms event streams into Prolog fact bases. In this way, the trace can be automatically related to the program's source code. Furthermore, Prolog can be used as a very powerful query language. Although these tools avoid the problem of displaying large event traces, they still need a global event trace that cannot be gathered in a scalable way. Furthermore, they only allow monitoring of a very restricted set of events, usually only communication events. Thus the obtained information is often too coarse grained to track down the cause of a bug in the source code. On-line debuggers allow a more detailed view on program execution. They provide functions to stop threads at given locations in the source code, to view or modify data structures, to determine the source code position where threads are stopped and to execute threads in a controlled fashion, e. g. in single steps. Usually, the user is allowed to specify a group of processor nodes, processes or threads. A command is then executed independently for each element in that group. Some of these tools, like ndb or ipd [BCS93] are based on pure textual interfaces that
343
are difficult to use for non-computer scientists. However, debuggers using graphical interfaces, e. g. Prism [Sist92] are becoming more common. There are also a number of graphical interfaces built on top of text-based debuggers, e.g. xipd [Ries93] or Panorama [MaBe93]. These tools usually provide visualization of arrays and thread states to simplify debugging of complex applications. However, such advanced features are only usable for data parallel or SIMD-style programs. Current debuggers don't support applications that create or delete threads dynamically or are composed of multiple executables due to dynamically loaded codes. Most debuggers even require a one-to-one mapping between threads and processing nodes, i. e. they support only one thread per node, due to the way breakpoints are implemented and since the visualization of thread states is often based on a fixed hardware topology. The array visualization functionality of DETOP described in Section 4.1 has both similarities and differences compared to the numeric visualizers of the Prism [Sist92] programming environment for the Connection Machine. DETOP provides a general mapping (also suitable for sparse arrays) of array partitions distributed on processors of MIMD machines/workstation clusters into a single logical array, whereas Prism lacks such a general mapping and is oriented towards SIMD computers. The DETOP visualizer integrates color coding into the numeric visualizer, whereas Prism provides several separate types of graphic visualizers. Both systems show multidimensional data through selected two-dimensional projections, and provide panning up/down and left/right.
3 Primary Design Goals The design goals for DETOP are to create an easy-to-use and comprehensive tool that can handle most aspects of explicitly parallel application programs, including more difficult aspects such as dynamic process creation, multiple executables and large volumes of data. Here we briefly review some important goals. 9 E a s e o f use. Graphical interfaces and guided user interaction can help inexperienced users. A systematically designed user interface is another important aspect. The system should support a systematic bug localization strategy, e.g. top-down by first localizing bugs in coarse-grained context (processes, procedures) and later conveniently observing single statements, messages or variables. 9 G l o b a l s y s t e m - o r i e n t e d o v e r v i e w . The debugger should provide information on the system as a whole and on the interaction between system components. This implies a need for global event detection, global breakpoints and monitoring of communication and synchronization. 9 D e t a i l e d a n a l y s i s . The debugger should provide detailed information that is needed to locate bugs. For example, to inspect single threads or messages; or single statements, procedures or source lines. 9 D a t a o v e r v i e w . The system should allow convenient inspection and browsing of large application data structures that often occur in parallel applications. 9 L o w i n t r u s i o n . T h e monitor part of the debugger should have minimal intrusion on the application program. This can be partly achieved by only monitoring those events that are of current interest for the user, which is practical using an on-line mode of operation. 9 D y n a m i c a p p l i c a t i o n s . The system should be able to handle applications consisting of
344
multiple executables and also support debugging for applications with dynamic process and thread creation, and dynamic loading of code. Multiple parallel programming models. Debugging of parallel programs using different forms of parallelism should be supported, e.g. processes, threads, message-passing style, data-parallel style. Scalable data handling. Handling and presentation of data collected during monitoring should be scalable, i.e. some data-reduction might be performed during on-line operation. Data representations and presentation methods useful for hundreds or thousands of processors should be selected. 4
The Parallel Debugger DETOP
DETOP provides a graphical user interface whose main component is a debugger window as shown in Figure 1. For data parallel applications, a single window is often sufficient and offers the most convenient and comprehensive way to debug all threads of a program. For data viewing of large objects, separate windows such as the array visualizer (see Figure 3), are created. However, in order to also support other paradigms of parallel programming, especially functional decomposition, DETOP has been designed to allow multiple debugger windows. ~
~top
I
II iii
I IIIIIIIIIIIIIllll
I
F_He _~Faulta Global ~tlor~ Threads t.px,ParI~in, !
~t.px,SendProc,Oi t.px,~ndProc,04 t.px,Send~oc,O t.px,SendProc,O t.px,SendProc,O
79 S ~
Line:
64
t.px,Parix~ain, ~ i r t.px,SendProc,O] t.px,SendProc,O
H_elp File: kmrk,c
65 ~ 67 0
int l, sz" oh~ buf[lO0] :
--> ]Breakpoint ~3 at line 6B (disabled) --> Threeds nO.c3.tO, rtl.c3.tO, n2.o3.tO, n3.c3.tO -> Action: atop all E8 f ~ (t:=O: i~O; I++) ( 69 az = RecvLink(lir~,buf,100)" 70 PPirlte(l'No~ 1: received %d l:watea ( ~ ) from r
71
3"
U
l
73 74 ~id nodelO 75 76 77
State of thr.ed no c, it0: -~ State: STOPI:~II Calls: I SendProcat work.c:19 I _PX_u~rFune.~a (no line info)
LinkCILt *link: |nt e~ = O:
78 -> Thread n3.c3.tO (last stop in call) 79 B i l l = Conrmcttink (0, I, ~,err)" -> Threed nl.c3.tO (stopped) -> ~raskpolnt 111 at line 80 (enabled) -> T h ~ n1.~.tO, n2.c3.tO ~-) l~tlon: atop thread 80 if (err I: O) { 81 printe("Error node I ~ ' ) ; 82 return-
u
t
~
thread no.c3.tlO has been stopped .....
> print [no.c3.tlO] "uork.c:SendProc* *
Step Next Continue Breakpoint
.
Value of "uoPk.c:SendProc" Sargptr in t ( link = NULL. ~s9 = OxE4aOaO; Ion = 78433E8~ )
Print > contlnue [no.e3.t10]
T~oeof Set
Thread nO.c3,tlO has terminated > print [n2.C3.gO n3.c3.tO no.c3.ZIB nO.
klhare
Sh(~ Line
iine break ~oPk.c:25 atop node
Find
-'-]
[]
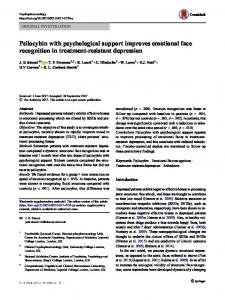
Fig. 1. DETOP debugger window Each of these multiple debugger windows may be associated with an arbitrary set of threads. Thus, for data parallel programs a single window can be used for all threads, while separate windows can be used for different parts of applications according to their functional decomposition. Multiple windows also makes it possible to let one window show a coarse
345
grained overview of the whole application, while another is used for detailed inspection of one selected thread. The center of each window shows a listing of the threads' source code. The currently active locations of the threads associated with this window and the breakpoints that have been set for these threads are indicated in the listing by small icons and additional descriptions inserted into the source code (see Figure 1). The listing subwindow is also used for quick and intuitive command input. We use an input scheme that is object oriented in some sense: the user may select an object in the listing, e.g. a line, a variable name or a breakpoint marker. Based on the type of this object, he or she will then get a popup menu containing commands appropriate for the selected object. Thus, if a line or variable is selected, the menu will allow setting of a breakpoint or printing the type or contents of the variable. If a breakpoint marker has been selected, the menu will show items for deleting or modifying this breakpoint. In contrast to other debuggers providing graphical input, commands use both the selected piece of text and the position of this text in the source code. Thus, if a variable 5. is selected in a procedure f o o , the p r i n t command will print the value of C in this procedure, even if it is not on top of the call stack. This is what users expect intuitively, which substantially simplifies usage. In addition to menu input there is also a command line for more experienced users and complex commands. Command line syntax supports both C and Fortran 77. The left side of the debugger window displays the list of threads currently associated with that window. The list may be changed at any time using a separate window (see Figure 2) that allows selection of a new thread from the list of currently existing threads. In this list a subset of threads may also be selected. All commands entered in the debugger window will then be applied to all selected threads. In addition, there are global commands that always affect the whole application, e.g. a global stop. Thread seleotlo~
Imlm Ill
nO.c3.t3 (t.px.SendProc.OxB3a;[[]
Node 3
nO.c3.t6 (t.px,SendProc,Ox630;[| I nO.c3.t7 (t. px,gendProc ,0xg2d~ [ | I
n2.c3.tO (t .px,PaPt xHatn,Ox6~. I I~1 i
D,
nO.c3.tO ( t opx,ParixHain,OxG4243( nO.c3, tlO ( t .p• ,0x62480~ n1.c3.tO ( t .px, Parlxlla| n, Ox658b9( n2.c3.tO ( t . px,Par ixMa| n, OxrE;93~E nO.c~.t9 ( t . px ,Ser~IProc,OxS277eB:
igzJ
~.t,
i[
H,]p
Fig. 2. DETOP thread selection window DETOP provides two different forms of command output. Output may either be appended to a log file or updated in-place. The first mode is used for all unconditional commands, but may also be used to generate traces of events or other data. The second mode is, for example, used to display the state and the procedure call back-trace of threads. Each time a thread is stopped, the state display (in the upper right of Figure 1) is updated and shows the current stopping point.
346
The debugging commands offered by DETOP fall into six major groups:
1. Execution control: It is possible to start, stop and single step any thread at any time. In addition, there is also a global start and stop. 2. Inspection ofprogram state: These commands retrieve information about the program's current state, e.g. the list of all existing threads, the point of execution and procedure traceback of threads and the types and values of variables or expressions, including visualization of arrays. 3. Modification of program state: Currently only modification of variables is supported. 4. Events and actions (breakpoints): Breakpoints may be set on source code lines or procedure entries for an arbitrary set of threads. A breakpoint consists of an execution event and an associated stop action. The event is raised whenever one of the selected threads reaches a given position in the source code. The stop action can either stop the thread that raised the event, the thread's processing node or the whole application. The latter modes are essential in order to obtain consistent views of shared variables or the program's global state. Additionally, there are several types of events that are always monitored by DETOP, e.g. exceptions or termination of a thread. It is also possible to define a special breakpoint that will stop dynamically created threads immediately before they start executing. 5. Miscellaneous: There are also commands to display a source file, to set defaults, e.g. a default action for breakpoints, and to configure the user graphical interface.
6. Help: DETOP also provides full context sensitive on-line help. Since support for dynamic applications has been a major design goal, there are also special features that simplify debugging of programs that dynamically create new threads. Threads are identified by a combination of a global identifier and additional information related to the source code. The global identifier consists of the node number, a context number and a thread number. The context number is used to distinguish between threads having different executable files. The thread number starts at 0 for the initial thread and is incremented for each dynamically created thread. Additional information is used to make identification easier for the user: 9 For applications that dynamically load new code, the name of the executable file is given for each thread. 9 The name of the thread's root function is given in order to support applications based on functional decomposition. 9 Finally, the pointer to the thread's control block, as returned by the C r e a t e T h r e a d library call is shown. If the pointer has been stored in some program variable, the corresponding thread can be identified in this way. Threads are always selected from lists displaying global identifiers and additional information (see Figure 2). Once a thread has been selected for debugging, its symbol table is automatically loaded into the debugger, if it is not already available. Thus, only the symbol tables needed for the current debugging session are loaded; there is no need for the user to explicitly specify the symbol tables to be used. DETOP also supports two additional event types that are essential for debugging
347
dynamic applications. Termination of debugged threads is always monitored. When a thread terminates, a message is printed and the thread is removed from all thread lists. A special option requests the debugger to also monitor creation of new threads. When a new thread is created, a message containing the thread's identifier is printed, and the thread is stopped immediately before it starts executing. It is then possible to select this thread for debugging, to set breakpoints in this thread and to start it. Thus, even a dynamically created thread can be debugged from the very beginning of its execution.
4.1 Visualization of Distributed Arrays For parallel programs on MIMD computers with distributed memory, large arrays with massive amounts of data are typically partitioned and distributed over several processors. DETOP allows a separate window, called a visualizer, to be created for each array to be visualized. Visualizers give the user an efficient way to navigate through and interpret large amounts of data typically found in parallel programs. Visualizers are designed to view multi-dimensional arrays of data, but due to the twodimensional nature of computer screens, two dimensions at a time are selected for visualization. Data is fetched using the DETOP monitoring mechanism, which means that programs do not have to be modified to display a visualizer. The user simply runs a program to a breakpoint and specifies the array to be visualized. The visualizer displays a twodimensional slice of the data, and the user may pan around in this slice using simple mouse commands to the scroll bars.
Fig. 3. Two array visualizer windows, one numeric and one graphic. Combined numeric-graphic is also possible.
348
Figure 3 shows two typical array visualizers. The data is shown in numeric format. Color coding can be applied to the displayed values, which allows faster the user easier overview of many numbers, and quick visual detection of any numbers with strange values. Threshold or range conditions may also be specified, which causes the visualizer to only display those values that fulfill the conditions. Future extensions may include purely graphic visualizers, e.g. displaying fields of 2-D or 3-D vectors as arrays of small graphical arrows. Other extensions are animations, i.e. visualizing a sequence of snapshots of the same array, and observing modifications over time. A variation of the animation theme is to only display the array elements that change value between different iterations of some application algorithm. The array visualization functionality of DETOP described here has both similarities and differences compared to the numeric visualizers of the Prism [Sist92] programming environment for the Connection Machine. DETOP provides a general mapping (also suitable for sparse arrays) of array partitions distributed on processors of MIMD machines/ workstation clusters into a single logical array, whereas Prism lacks such a general mapping and is oriented towards SIMD computers. The DETOP visualizer integrates color coding into the numeric visualizer, whereas Prism provides several separate types of graphic visualizers. Both systems show multidimensional data through selected two-dimensional projections, and provide panning up/down and left/right.
4.2 Mapping for Array Visualization The array mapping facility of the array visualizer allows the user to specify a mapping from the distributed parts that comprise the array, to a single array that is presented as one logical entity to the user. The example below shows how every other column from the array part in processl is combined with every other column from the array part in column 2, corresponding to a cyclic distribution in the first dimension of the combined array. A~ayin process 1
Array in process 2
Logically combined array
11
12
13
21
22
23
11
21
12
22
13
23
14
15
16
24
25
26
14
24
15
25
16
26
17
18
19
27
28
29
17
27
18
28
19
29
Fig. 4. Example of two distributed array pieces presented transparently as one array. The mapping can be specified in a general way, column by column, by filling in a number of Entry Definitions as shown in Figure 5 applied to the above example. The mapping can also be specified in the High Performance Fortran way, by filling in (CYCLIC,*) in the Dimension field, thus avoiding the need for a general specification of the mapping. Mappings need to be specified when debugging C or Fortran77 code with explicitly programmed data distributions.
349
Fig. 5. The arraymapper window, when specifying a general mapping. In this case the cyclic distribution shown in Figure 4 is specified. For High Performance Fortran, mapping information could automatically be obtained from the compiler generated symbol table. There are plans to integrate DETOP with the PREPARE High Performance Fortran compiler [BCSK95]. The general way of specifying a mapping is however still needed for non-standard data distributions, e.g. sparse arrays, for which the Zerofill button of the array mapper window can be checked, which means that all array elements which are not explicitly mapped are assumed to be zero. W e explain the array mapping example in Figure 5 in somewhat more detail. Process 1 is specified as thread: (nl,c3,t0), i.e. processor node 1, context 3 (process address space), thread 0; Process 2 as thread: (n2,c3,to) on processor node 2. There are 6 mapping entry definitions specified; the fields of the entry currently selected for editing are visible in the upper right part of the form. The Var.Dim field describes which elements from the local array should be mapped into corresponding elements in the combined array, as specified by the Map.Dim field. For example, in entry No 3 for process 1, Var.Dim = 1,0..2 and Map.Dim = 2,0..2, which means the elements indexed 0..2 in column 1 of the local array (column 1 = the second column, for which in this case the first array index = 1) are mapped into column 2, elements 0..2 of the combined array.
5 Implementation The debugger has been designed in an hierarchical way in order to simplify portability and maintenance. The debugger's basis is a distributed monitoring system that consists of one monitor on each of the parallel computer's nodes. DETOP itself can be executed on any
350
workstation allowing network access to the parallel computer. The host part is again divided into two layers: the graphical user interface and an underlying transformation layer. The main tasks of this layer are transformation between source language level and machine level, i e. symbol table management, distribution of commands to the appropriate monitors and management of events and actions. The transformation layer is connected to a communication server via T C P / I P . This server, which is part of the monitor on Node 0 for the GC/PowerPlus and PowerXplorer implementation, acts as a bridge between the TCP/IP network and the monitoring system's internal communication network. Communication between the monitor system and debugger is completely asynchronous, so in contrast to sequential and most other parallel debuggers neither the debugger interface is blocked while a monitor is busy on some command, nor it is necessary to interrupt the whole application in order to issue debugger commands. In the following, we will discuss four aspects of DETOP's implementation: the array visualizer, the monitoring system, symbol table management and the user interface in more detail.
5.1 Array Visualizer The array visualizer and mapper is implemented as an independent Unix process, see Figure 6, that communicates with the main debugger process via ToolTalk. It is also possible to connect the array visualizer directly to an application, if that should be desired. The user interface parts of the visualizer are implemented in Tk/Tcl with a number of call-back routines in C, which keep track of what parts of the array data that have been transferred to the visualizer process. Data is transferred either on demand, depending on the scrolling and panning actions of the user, or all data at once for a whole array if a snapshot is desired. The main debugger process can initiate some actions, for example refreshing of the array data in the visualizer process. DETOP Target Monitor
DETOP Main User Interface Module
~
ToolTalk
~. Array Mapper "l Array Visualiser
Fig. 6. Communication structure between parts of DETOP.
5.2 Monitoring System The task of the monitoring system is to provide the tools with adequate information. Since monitoring is also needed for other tasks beside debugging, a universal and flexible monitoring system is used. All other members of the TOPSYS tool family [BeBo91], such as the performance analyzer PATOP [Hans94] and the visualizing tool VISTOP [BeBr93] are based on this monitoring system. The structure of the monitoring system for one node is depicted in Figure 7. In order to
351
perform data reduction, monitor processes are present on each node of the multicomputer system. The monitor process collects information, condenses this information, and combines it with information from adjacent nodes, e.g. to form average values. For example, in the Parsytec/PARIX implementation information is sent to Node 0, and reduced, before being communicated to the host. The monitor itself is programmable, in order to be flexible to the needs of different debugging and performance analysis tasks. Small pieces of programs in a simple language are downloaded to the monitor. Another important function performed by the monitor is to recognize events and to initiate the corresponding event handling.
I
TOOL(e.g.DETOP)
1
\ TCP/IP
: R:
::= ::I
~..........
.....
: ~ ]
P~
[::' : A
o ii
::: L
ocal communication
~
J.Vl
:i:
~
R
>fi:~ ! ~
:!il ~t
net ronous
N
I ..-2/,
~
synchronous ~
~ ~
"'
R
information PTrace
Fig.
7. M o n i t o r on one node
5.3 Symbol table management When a program is compiled for debugging, compilers emit a symbol table that is stored in the program's executable file. The symbol table is used to link machine addresses to source code items, e.g. variables, procedures or lines in a source file. Though this information is mainly needed for correctness debugging, it is also important for performance analysis, if performance values have to be related to the source code, e.g. by restricting a measurement to a some procedure. There are a couple of different symbol table formats and also a variety of extensions for different source languages. In order to keep our tools portable, we have developed a symbol table management library that can read various formats and offers a uniform interface for accessing symbol table information that is independent of format and source language. Since the library is able to manage several symbol tables at the same time, it allows us to support both applications where code is loaded dynamically, i.e. applications consisting of more than one executable, as well as programs on heterogeneous systems, where there are different executables for the different types of node processors. Mixed language programs, e.g. written in C and Fortran, are also supported.
352
debugger, transformation layer
I
common reader machinel format[
byte-[
~ /
J[
r [COFF [ a~.out'(dbx)__L
f reader,or ]
access routines
1
internal representation p
r
o
~
prog.
:aD
lype
"~ - -~
o
Fig. 8. Structure of Symbol Table Manager Figure 8 shows the structure of this symbol table manager. A common reader first opens the executable file and determines the target machine, its byte order and the symbol table format used. Next, a format-specific reader is called, building up an internal representation that is independent of format and programming language. The internal representation is a tree-like structure where each node represents a symbol. The interface to access this structure acts like a pattern matcher. Given a start node representing a context, e.g. a source file or procedure, all symbols matching the given specification are returned. A specification consists of symbol name or address, symbol class (e.g. procedure, variable, type) and subclass (e.g. global symbol, parameter), where wildcards are possible for each component. Several search types are available, e.g. to search for all descendent symbols, for local symbols only, or for symbols within scope of the program structure represented by the start node. Thus, the interface provides a uniform support for both searching specific symbols and retrieving the set of all symbols with a given class, e.g. a list of all procedures in an application. 5.4 User interface
The main user interface window has been built on top of X Windows using the Motif widget set. We have used C++ and the Widget Creation Library (Wcl) for rapid prototyping of the main debugger window. The array visualizer was implemented more recently, using Tk/Tcl (versions 4.0/7.4) and ToolTalk for communication between the array browser and the main debugger process. The Motif look and feel is used by all window types to provide a consistent user interface.
353
6
Conclusion and Future Work
We have presented the parallel debugger DETOP with special emphasis on new functionality for debugging of programs with distributed array data structures, combined with support not only for static data parallel programs but also for applications with dynamic process creation and programs based on functional partitioning. Thus, DETOP provides a rather unique combination of debugging facilities covering most aspects of explicitly parallel programming. An earlier version of the debugger [ObWi95] is distributed by Parsytec for their GC/ Powerplus and PowerXplorer systems since Dec. 1994. It is complemented by the performance analysis tool PATOP [Hans94], developed by the group in Munich. The smooth cooperation between the PELAB group at Linkrping University and the group at the Technical University of Munich is another nice aspect of this effort. The performance of the monitoring system that is used by both DETOP and PATOP appears to be reasonable. For example, when using PATOP do online drawing of a few curves of properties of threads or processes, the overhead is usually around 10-15% for the application. The overhead of using DETOP is much less, except, of course, when hitting a breakpoint. Future work on DETOP includes more graphic support in the array visualizers, e.g. showing arrays of small arrows; options for snapshots of whole arrays and animation of array contents over time, etc. Other possible future extensions involve integrating distributed dynamic slicing [KKF96] into the debugger. Slicing can trace data dependencies through messages between processes and through statements and procedure calls, which gives the debugger capabilities to answer queries about which parts of the parallel program influences the computation of a certain (faulty) data item. There are also future plans to integrate DETOP with the PREPARE High Performance Fortran compiler so that data distribution information for distributed arrays in that language can be automatically obtained from the symbol table instead of being specified in the array mapper. Other future plans include extending the capabilities of DETOP for debugging communication between threads, e.g. by allowing breakpoints to be set on links. A thread sending to or receiving from the link will then be stopped before it completes communication. Thus, it is possible to watch communication on a link. This type of breakpoint also allows to stop the receiver of a message, so processing of that message can be debugged. It is also planned to port both DETOP and PATOP to the PVM and MPI parallel programming models, both for execution on networks of workstations and for a version running on top of PARIX for Parsytec parallel computers.
7
Acknowledgements
The main debugger functionality (except for the distributed array visualization and mapping reported.here) has been designed and implemented by the group at the Lehrstuhl fiir Rechnertechnik und Rechnerorganisation, Technical University of Munich (TUM), including Roland Wismtiller, Michael Oberhuber (until Dec 1994, the TUM group also included Olav Hansen, who was at PELAB during the work reported here, but since Nov 95 is affiliated with Parsytec), and some more people. The nanokernel Ptrace-like debugging support mechanism used by the monitor has been implemented by Parsytec. Support for the
354 visualizer work has been obtained from the European Commission through the Esprit-3 PREPARE project, from NUTEK - the Swedish Board for Technical Development, and for the main debugger work from the German Science Foundation special research grant SFB 342.
References [BeWi94]
T. Bemmerl and R. WismiJller. On-line Distributed Debugging on Scalable Multiprocessor Architectures. In W. Gentzsch and U. Harms, editors, HighPerformance Computing and Networking, Volume II: Networking and Tools, volume 797 of Lecture Notes in Computer Science, pages 394-400, MiJnchen, April 1994. Spdnger-Verlag.
[BCS91]
D. Breazeal, K. Callaghan, and W. D. Smith. IPD: A Debugger for Parallel Heterogeneous Systems. In Proceedings of ACM/ONR Workshop on Parallel and Distributed Debugging, pages 216-218, Santa Cruz, CA, May 199 I.
[BeBo91 ]
T.Bemmerl and A. Bode. An integrated tool environment for programming distributed memory multiprocessors. Distributed Memory Computing, 487 of LNCS: 130 - 142, 1991.
[BeBr93]
T. Bemmerl and P. Braun. Visualization of Message Passing Parallel Programs with the TOPSYS Parallel Programming Environment. Journal of Parallel and Distributed Computing (Special Issue on Tools and Methods for Visualization of Parallel Systems and Computations, 18(2):118 - 128, June 1993.
[BCSK95]
Peter Brezany, Olivier Chrron, Kamran Sanjari, Erik van Konijnenburg. Efficient Translation of Irregular Code by the PREPARE HPF Compiler. In Proc. of Fifth Workshop on Compilersfor Parallel Computers, Tech. report .UMA-DAC_95/09, Dept. of Computer Science, University of Malaga, Malaga, June 23-30, 1995.
[CFH+93]
J. Cuny, G. Forman, A. Hough, J. Kundu, C. Lin, L. Snyder, and D. Stemple. The Ariadne Debugger: Scalabe Application of Event-Based Abstraction. In Proceedings of the ACM/ONR Workshop on Parallel and Distributed Debugging, pages 85-95, San Diego, California, May 1993. ACM.
[Hans94]
Olav Hansen. A tool for optimizing programs on massively parallel computer architectures. In W. Gentzsch and U. Harms, editors, High-Performance Computing and Networking, Volume I1: Networking and Tools, volume 797 of Lecture Notes in Computer Science, pages 350 - 356, Munich, April 1994. Springer-Verlag.
[Heath93]
Michael T. Heath. Recent Developments and Case Studies in Performance Visualization using ParaGraph. In G. Kotsis and G. Haring, editors, Proc. of Workshop on Monitoring and Visualization of Parallel Processing Systems, pages 175 - 200, Moravany and V,Shom, CSFR, October 1992. Elsevier, Amsterdam, 1993.
[KKF95]
Madam Kamkar, Patrik Krajina, Peter Fritzson. Distributed Dynamic Slicing. In Proc of EuroMicro'96, Braga, Portugal, 1996.
[MaBe93]
J. May and F. Berman. Panorama: A Portable, Extensible Parallel Debugger. In Proceedings of the ACM/ONR Workshop on Parallel and Distributed Debugging, pages 96-106, San Diego, California, May 1993. ACM.
[ObWi95]
Michael Oberhuber, Roland Wismfiller.DETOP - An Interactive Debugger for PowerPC Based Multicomputers. In (P. Fritzson, L. Finmo, Eds.) Proc. of ZEUS'95 - Workshop on Parallel Programming and Applications, LinkOping, May 17-18, 1995. lOS Press, Amsterdam, 1995.
[Ries93]
B. Ries, R. Anderson, W. Auld, D. Breazeal, K. Callaghan, E. Richards, and W. Smith. The Paragon performance monitoring environment. In Proc. of Supercomputing '93, pages 850-859, Portland, Or., November 1993. IEEE.
355
[Sist92]
Steve Sistare, Don Allen, Rich Bowker, Karen Jourdenais, Josh Simons, Rish Title. Data Visualization and Performance Analysis in the Prism Programming Environment. In N. Topham, R. lbbett and T. Bemmerl (Eds), IF1P Working Conference on Programming Environments for Parallel Computing, Edinburgh, Elsevier Science Publishers B.V. (North-Holland), April 1992.
[TGL93]
M. Timmerman, F. Gielen, and P. Lambrix. High Level Tools for the Debugging of Real Time Multiprocessor Systems. In Proceedings of the ACM/ONR Workshop on Parallel and Distributed Debugging, pages 151-157, San Diego, California, May 1993. ACM.
[TI'941
Thomas Treml. Monitoring Paralleler Programme. PhD thesis, Munich University of Technology, 1994.