Available online at www.sciencedirect.com
ScienceDirect Procedia CIRP 62 (2017) 400 – 404
10th CIRP Conference on Intelligent Computation in Manufacturing Engineering - CIRP ICME '16
A performance test for a fringe projection scanner in various ambient light conditions Feng Lia,*, David Stoddarta, Iwona Zwierzaka a Nuclear AMRC, University of Sheffield, Advanced Manufacturing Park, Brunel Way, Rotherham, S60 5WG,United Kingdom * Corresponding author. Tel.: +44(0)1142229908. E-mail address:
[email protected]
Abstract Optical triangulation based scanners have been widely used in industry, mainly for reverse engineering applications and freeform inspection tasks. Error contributions of these optical scanners include many influencing factors like surface quality and material properties of measurand, orientation and scan depth of sensors, ambient light changes, etc. This paper presents a performance evaluation test for a commercially available structured light scanner, under different ambient light conditions. The freeform reference standard developed by National Physical Laboratory is used to identify the influence of ambient light changes to the measurement accuracy. © Published by Elsevier B.V. This ©2017 2016The TheAuthors. Authors. Published by Elsevier B.V.is an open access article under the CC BY-NC-ND license (http://creativecommons.org/licenses/by-nc-nd/4.0/). Selection and peer-review under responsibility of the International Scientific Committee of “10th CIRP ICME Conference". Peer-review under responsibility of the scientific committee of the 10th CIRP Conference on Intelligent Computation in Manufacturing Engineering Keywords: Metrology; Optical scanner; Freeform; Ambient light
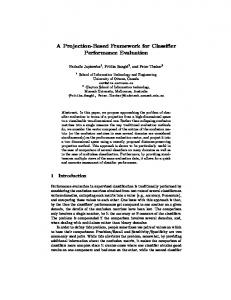
1. Introduction Acquiring 3D point data from physical objects is increasingly being adopted in a variety of product development processes, such as quality control and inspection, reverse engineering and many other industrial fields. A variety of sensor technologies, such as the tactile method and optical techniques, have been developed to meet the requirement of surface digitization. The existing tactile methods which are represented by CMMs (coordinate measuring machines) [1] have been widely used for industrial dimensional metrology, but the digitisation process is time-consuming. An alternative noncontact approach is represented by non-contact digitisation of surfaces based on optical triangulation techniques, for example laser scanner [2] and FPS (fringe projection scanner) [3]. The FPS method projects a grating stripes field which is modulated by a periodic function onto the surface of the objects (see Fig. 1). A DLP (digital light processing) projector has been commonly adopted for projecting phase stripe patterns owing to its easy availability, low cost, and high flexibility. The phase is used to describe the cycle distribution of grating field and the coordinates of points are
obtained by calculating the phase of the fringe image. The phase of the grating stripes offset occurs due to variation in the height of the object surface. Through calibration of the scanner, camera coordinates are linked with coordinates in the grating stripes field. By capturing the shape of the projected intersection stripes with a digital camera, the coordinates of the points on the measuring surface are determined by triangulation. 3D coordinates of points can then be calculated by comparison of the relationship of phase shift offset and the height of surface.
(a) Original stripes
2212-8271 © 2017 The Authors. Published by Elsevier B.V. This is an open access article under the CC BY-NC-ND license (http://creativecommons.org/licenses/by-nc-nd/4.0/). Peer-review under responsibility of the scientific committee of the 10th CIRP Conference on Intelligent Computation in Manufacturing Engineering doi:10.1016/j.procir.2016.06.080
401
Feng Li et al. / Procedia CIRP 62 (2017) 400 – 404
The aim of this work is to investigate the influences of ambient lighting conditions on the measuring accuracy by using FPS in an AM (additive manufacturing) cell (Fig. 2). However, to the best of the author’s knowledge, there is no relevant work that explores this type of problem. As controlled lighting conditions can be implemented to maintain consistency, it is necessary to study how the environmental lighting affects the measuring accuracy. (b) Workpiece surface
(c) Projection grating Fig. 1. FPS scanning process.
(a) AM cell exterior
The main advantages of FPS, in comparison with conventional tactile probes, are the capability to measure contactless and to capture a large number of points in a short period of time. This makes them especially useful for digitising freeform surfaces and reverse engineering applications. The FPS method can directly measure the overall surface of the object by a single projection because the phase in the space is continuously distributed, which is a prominent advantage of the phase method. Additionally, a higher resolution can be achieved by using the “Phaseshifting” algorithm compared to the 1D and 2D triangulation sensors.
(b) Schematic view
The most important disadvantages of FPSs, at this moment, are the limited measuring accuracy and low repeatability. Today state-of the-art FPSs can achieve the same order of magnitude of the accuracy in comparison with conventional tactical probes – but is greatly dependant opon the quality of surfaces to be measured. The accuracy of FPSs is difficult to define because standardised procedures to evaluate CMM tactile probes are not appropriate for optical scanners due to different working principles. The increasing use of FPSs implies a growing need for reliable accuracy evaluation tests to analyse and improve the accuracy of the scanners. The quality of point clouds, obtained from laser line scanners, has been extensively investigated by Lartigue, Contriand and Bourdet [4,5]. Van Gestel, et al. [6] presented an extensive performance evaluation test for laser line scanners. In their work, the scanning depth, scanning angle with respect to the surface normal, thermal stability of scanner were investigated and tested. Bešić, et al. [7] introduced a method for improving the output of a CMM mounted laser line scanner for metrology applications.
Fig. 2. AM cell.
2. Elements of the test The commercially available FPS, GOM ATOS III Triple Scan (Fig. 3 (a)) is used for data acquisition and the FreeForm reference standard WP-150 (Fig. 3 (b)) is exploited to test the scanning accuracy in different ambient light conditions.
(a) GOM ATOS III Triple Scan
402
Feng Li et al. / Procedia CIRP 62 (2017) 400 – 404
2.2. Artefact for tests
(b) NPL-WP-150 FreeForm standard
The FreeForm reference standard WP-150 [8] is developed by National Physical Laboratory (NPL). This artefact is manufactured with high accuracy and has been calibrated by NPL using a high precision CMM with maximum permissible measurement error of (MPE =1.3 + L/400) μm (L in mm, ISO10360-2:2009). The CAD model for this standard is shown in Fig. 3 (c) and its characteristics can be found in Table 2. Table 2. NPL-WP-150 characteristics. Design
NPL National FreeForm Centre
Material
6082-T6 – Aluminium Dural
Coefficient of Linear Expansion
22.5 μm m-1 K-1
Dimensions
150 mm × 150 mm × 40 mm
This artefact bears several geometrical forms that are blended to form a single surface, therefore is an ideal object to evaluate the measuring accuracy of FPS. (c) CAD model of NPL-WP-150
(d) Test setup Fig. 3. Equipment and artefact.
2.1. Scanner configurations The main system configurations for GOM ATOS III Triple Scan are shown in Table 1. The software platform ATOS Professional V7.5 SR2 software is used for data capturing and pre-processing. Table 1. The configurations of GOM ATOS III Triple Scan. Camera Pixels
2 × 8 Megapixel
Measuring Volumes
38 × 29 × 15 - 2000 × 1500 × 1500 mm3
Point Spacing
0.01 - 0.61 mm
Working Distance
490 - 2000 mm
Sensor Positioning
industrial sensor stand, automatic robot
Operating Temperature
5 - 40 °C
3. Test setup This study aims at studying the influences of ambient lighting conditions on the measuring accuracy for an optical scanner. As the AM cell has been built in the research factory shop-floor, tight control of temperature would be unlikely. In addition, passing lifting equipment and machinery operating closed by the AM cell could also introduce variation. To avoid the errors contributed by these factors, the test has been arranged in the temperaturecontrolled metrology room. Both artefact and equipment have been soaked in the metrology room for at least 24 hours, with the environmental temperature controlled to 20±0.5 °C. Scanner has also been running more than 20 minutes to warm up before calibration and scanning. Laser pointers are used to adjust the optimal scanning distance between cameras and surface of object (see Fig. 3 (d)). The artefact WP-150 is horizontally placed on the granite measuring table. The scanner is aligned perpendicular to the table surface and always fixed when the cameras are capturing images. Firstly we switch all lights on in the metrology room; secondly we keep half of the lights on; finally we switch all lights off. Then the lighting levels have been controlled to three values: 660, 280, and 0 Lux (values are ±20 Lux), which has been recorded with UKAS certified light meter. 4. Evaluation method To validate the accuracy of point data after registration, we use the RMS (root mean square error) to evaluate the systematic and random error. In practice, the actual CAD model of artefact may be difficult or even impossible to obtain. As the NPL-WP-150 reference standard has been manufactured with high accuracy and calibrated, its CAD model can be exploited as the reference surface and used to compare with the scanned point cloud data. The RMS can be calculated by
403
Feng Li et al. / Procedia CIRP 62 (2017) 400 – 404
n
¦ ª¬d ( pis , pic ) º¼ i 1
RMS where
-
2
(1)
n
pis is the scanned point, pic is the projected point to
the surface of the CAD model c . distance between
d ( pis , pic ) is the
6
7
8
9
10
660 Lux
0.0699
0.0623
0.0627
0.0687
0.0601
280 Lux
0.0774
0.0616
0.0603
0.0708
0.0643
0 Lux
0.0773
0.0680
0.0599
0.0539
0.0663
Fig. 5 shows the comparison of RMS errors under different lighting conditions. The vertical axis represents the RMS and the abscissa refers to scanning sequences.
pis and pic , and n is the number of
sampled points. 5. Results In this paper GOM Inspect V7.5 SR2, which has been tested and certified by NIST (National Institute of Standards and Technology) and PTB (The National Metrology Institute of Germany), is used to align the scanned meshes to the NPL-WP-150 reference standard CAD model by using the ‘Best-fit’ option. Best-fit alignment involves computation of the optimum rigid rotation and translation by minimising the distance between each dataset to the reference CAD model. After alignment, we can compare the RMS results under different lighting conditions. An example of the colour map displaying the difference between scanned point datasets and CAD model is shown in Fig. 4.
Fig. 5. Measuring accuracy under different lighting conditions.
From Fig. 5 we can see that the measuring results are very close under different ambient lighting levels, which indicates the lighting condition does not affect the measuring accuracy in this case. However, obvious random errors have been observed between two scans under same lighting condition although all measurements have been performed within a short time period.
6. Conclusion In this paper, the scanning accuracy under three levels of lighting conditions have been evaluated and tested with a series of real point cloud data sets. A state-of-the-art structured light 3D scanner GOM ATOS III Triple Scan is used to obtain the point cloud data. The NPL FreeForm reference standard WP-150 is the artefact used to test the influence of ambient light using a series of series real images; the systematic and random errors of the scanner have also been observed (see Fig. 5).
Fig. 4. Sample colour map.
All scanned points have been kept and compared with the CAD model. The results can be found in Table 3. Table 3. Scanning accuracy evaluation. 1
2
3
4
5
660 Lux
RMS (mm)
0.0614
0.0738
0.0707
0.0620
0.0639
280 Lux
0.0586
0.0620
0.0807
0.0631
0.0654
0 Lux
0.0650
0.0554
0.0771
0.0580
0.0637
Overall, the experiments have demonstrated that the scanner provides the similar performing in terms of accuracy for this artefact under different lighting conditions. The systematic errors are 66 macros when the intensity of illumination is 660 Lux and 280 Lux, and 65 microns when we switch off all lights in the room (0 Lux). Experimental results indicate that the ambient light does not contribute obvious systematic errors in terms of accuracy in this case. However, remarkable random errors have been observed when we scan the artefact in different scan sequences and under the same lighting condition - even though all point data are captured within very short period of time. The experiments results reveal that the measurement repeatability is still a significant problem for the optical triangulation and active scanning techniques based methodologies. Multiple scanning and taking the average could be a solution – hopefully more convenient and
404
Feng Li et al. / Procedia CIRP 62 (2017) 400 – 404
implementable solutions for this type of problems can be solved in the future research. References 1. Weckenmann A, Estler T, Peggs G, McMurtry D. Probing Systems in Dimensional Metrology. CIRP Annals Manufacturing Technology 2004; 53 (2):657-684. 2. Wang Y, Feng H-Y. Effects of scanning orientation on outlier formation in 3D laser scanning of reflective surfaces. Optics and Lasers in Engineering 2016; 81:35-45. 3. Zhang C, Zhao H, Gu F, Ma Y. Phase unwrapping algorithm based on multi-frequency fringe projection and fringe background for fringe projection profilometry. Measurement Science and Technology 2015; 26 (4):045203 4. Contri A, Bourdet P, Lartigue C. Quality of 3D digitised points obtained with non-contact optical sensors. CIRP Annals-Manufacturing Technology 2002; 51 (1):443-446 5. Lartigue C, Contri A, Bourdet P. Digitised point quality in relation with point exploitation. Measurement 2002; 32 (3):193-203 6. Gestel NV, Cuypers S, Bleys P, Kruth J-P. A performance evaluation test for laser line scanners on CMMs. Optics and Lasers in Engineering 2009; 47 (3):336342 7. Bešić I, Gestel NV, Kruth J-P, Bleys P, Hodolič J. Accuracy improvement of laser line scanning for feature measurements on CMM. Optics and Lasers in Engineering 2011; 49 (11):1274-1280 8. NPL high precision traceable FreeForm reference standard. Retrieved from http://www.npl.co.uk/upload/pdf/freeform-highprecision.pdf; 2016.