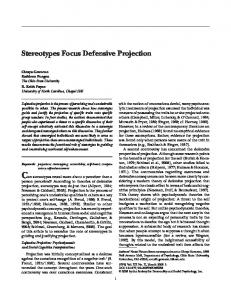
tions, which may vary from points on a plane to graphs, ... jection Explorer â a visualization tool for mapping and ex- ..... search API to recover a query search.
The Projection Explorer: A Flexible Tool for Projection-based Multidimensional Visualization Fernando V. Paulovich Maria Cristina F. Oliveira Rosane Minghim Instituto de Ciˆencias Matem´aticas e de Computac¸a˜ o, Universidade de S˜ao Paulo Av. Trabalhador S˜ao-carlense, 400 S˜ao Carlos, SP, Brazil e-mail: {paulovic,cristina,rminghim}@icmc.usp.br Abstract Multidimensional projections map data points, defined in a high-dimensional data space, into a 1D, 2D or 3D representation space. Such a mapping may be typically achieved with dimensional reduction, clustering, or force directed point placement. Projections can be displayed and navigated by data analysts by means of visual representations, which may vary from points on a plane to graphs, surfaces or volumes. Typically, projections strive to preserve distance relationships amongst data points, as defined in the original space. Information loss is inevitable and the projection approach defines the extent to which the distance preserving goal is attained. We introduce PEx – the Projection Explorer – a visualization tool for mapping and exploration of high-dimensional data via projections. A set of examples – on both structured (table) and unstructured (text) data – illustrate how projection based visualizations, coupled with appropriate exploration tools, offer a flexible set-up for multidimensional data exploration. The projections in PEx handle relatively large data sets at a computational cost adequate to user interaction.
1. Introduction Handling high-dimensional data poses many problems to researchers and data analysts in general. Visualization techniques seek to bridge the gap between user visual perception and reasoning capabilities and analytical techniques. Nonetheless, finding intuitive ways of visualizing large high-dimensional data sets is a difficult problem. Traditional multidimensional visualizations, such as scatter plot matrices, parallel coordinate plots or pixel-based techniques [8] operate by mapping each data attribute into a corresponding visual axis or other representation. As such, they can only handle well a limited number of attributes,
and therefore are not directly applicable to complex data consisting of many attributes (dimensions) [6]. A widely explored alternative is to reduce dimensionality prior to visualization, e.g., by projecting the highdimensional data points into a lower dimensional space (1D, 2D, 3D) that is more amenable to user interpretation. Various techniques can perform such a mapping, mostly based on dimensionality reduction or dimension clustering. The resulting projection can be displayed through a suitable visual representation – e.g., points placed on a plane, graphs, surfaces or volumes – that can be navigated and explored by a data analyst. Different criteria can be adopted to create projections, but typically they strive to preserve distance relationships amongst data points, as defined in the original space. Information loss is inevitable, and the extent to which this distance preserving goal is achieved depends on the precision of the projection. In this paper we introduce the Projection Explorer (PEx), a publicly available multidimensional visualization tool (see http://infoserver.lcad.icmc.usp.br/) targeted at interactive exploration of high-dimensional data via fast high precision projections. It incorporates multiple projection techniques and offers a range of functionalities for creating visual representations and interacting with them in search for interesting data relationships. We describe how PEx can be employed to visualize both structured (table) and unstructured (text) data sets. The examples illustrate how projection-based visualizations offer a flexible alternative to clustering large high-dimensional data for data analysis, helping users to identify patterns of local behavior, as well as to form a mental model of the whole data set. Projections implemented in PEx are scalable, meaning that they handle relatively large data sets (on the order of a few thousand to ten thousand data points) at a computational cost adequate to interaction, without sacrificing precision.
2
Multidimensional Projections
Considering each data attribute as a dimension, a data instance with m attributes may be interpreted as a vector placed in a m-dimensional definition space. In order to handle high dimensionality for data visualization in lower dimensional spaces, Multidimensional Projections operate by mapping the m-dimensional data points into a 1D, 2D, or 3D space, retaining, to a feasible extent, distance relationships between the data items calculated in their original definition space. From that mapping one can derive a graphical representation (e.g. a graph or a surface) that benefits from the human visual ability to recognize structures or patterns based on similarity, such as clusters of elements and neighborhoods. A formal definition of multidimensional projection follows: let X = {x1 , x2 , . . . , xn } be a set of m-dimensional data instances, with δ(xi , xj ) a defined dissimilarity (distance) measure between two instances i and j. Let also Y = {y1 , y2 , . . . , yn } be a set of points defined in a pdimensional space, with p = {1, 2, 3}, and d(yi , yj ) a (Euclidean) distance between two points i and j in the pdimensional space. A multidimensional projection technique is described as a injective function f : X → Y that attempts to minimize the difference between δ and d, i.e., to make |δ(xi , xj ) − d(f (xi ), f (xj ))| approach zero, ∀xi , xj ∈ X. Many such techniques have been described in the literature. Overall, they can be organized into two major groups, based on whether function f is linear or non-linear. Linear projection techniques derive linear combinations of the data attributes, defining them in a new lowdimensional orthogonal basis. A widely known example is Principal Component Analysis (PCA) [4]. PCA operates by decomposing the covariance matrix of the data into m eigenvectors with m eigenvalues, and selecting the first p eigenvectors with the largest eigenvalues to transform the m-dimensional space into a p-dimensional space. Data variance is successfully captured even if p � m. Linear techniques, despite performing well on normally distributed (Gaussian) data, typically fail to capture relevant patterns in data that present nonlinear structures, such as clusters of arbitrary shapes or curved manifolds. In such cases, nonlinear projection techniques are more capable of generating good projections. Nonlinear techniques handle the problem as an optimization process, attempting to minimize a function of the information loss (distance relations) incurred in the projection. Handling projections as an optimization process has some advantages in a visualization scenario. One is their iterative nature, which allows a user to observe and interfere in the process when convenient. Of course, this possibility imposes constraints on the computational performance of the projection algorithms. Another useful feature is that the
process is incremental, i.e., adding new subsets of instances only requires a limited number of additional iterations. Linear techniques, on the other hand, demand a new execution of the entire process. Finally, as long as the function to be minimized depends only on the distance relations, the original data points may not need to be represented as vectors, as in the linear approaches. Multidimensional Scaling (MDS) [3] comprises a whole class of nonlinear projection with the distance preserving common goal mentioned above. One MDS technique is Sammon’s Mapping [12]. It applies an iterative nonlinear optimization method based on the function’s gradient to find a (local) minima. A relevant class of MDS techniques is comprised by projections based on Force-Directed Placement (FDP) [2]. Originally proposed as a graph drawing heuristic, the FDP model attempts to bring a system composed by instances connected by imaginary springs into an equilibrium state. After an initial placement, spring-generated forces iteratively push and pull them until reaching an equilibrium. To apply the FDP model as an MDS technique, spring forces must be proportional to the difference between the dissimilarities δ(xi , xj ) and the distances d(f (xi ), f (xj )). Faster versions of the FDP algorithm have been recently proposed [7, 5], but since they rely on approximations to reduce computational complexity, the quality of resulting projections can be severally impaired. In addition to well-known techniques such as PCA and Sammon’s Mapping, PEx incorporates three recently introduced nonlinear projections, namely, Interactive Document Map (IDMAP) [6], Projection by Clustering (ProjClus) [9], and Least-Squares Projection (LSP) [10]. IDMAP customizes an earlier FDP strategy [13] to handle highdimensional spaces. ProjClus employs fast clustering algorithms to reduce the computational complexity of IDMAP, whereas LSP generalizes a technique originally introduced for mesh reconstruction to handle multidimensional data projections. A major advantage of these recent techniques over earlier approaches is the balance attained between scalability and precision. They are fast enough to handle reasonably large data sets and preserve interactive rates in generating the projections, while attaining very high precision. Unlike some optimized FDP strategies, scalability is not achieved at the expense of sacrificing precision. Resulting maps provide a good approximation to both the overall data space and closer neighborhoods. Few systems for general multidimensional visualization add projections in their tool suite. The Hybrid Information Visualization Environment (HIVE) [11], however, implements clustering and layout algorithms to enable exploratory visualization of multidimensional data. An intuitive configuration process by the user is its main strength.
Nevertheless, the layout algorithms implemented are approximations of the original FDP model, which may fail to generate visualizations that group (separate) the data items based on their similarity (dissimilarity). Projections have been intensively explored in the context of visualizing unstructured data, particularly text document collections. Two typical layout approaches in this context are Infosky [1] and Galaxies [16, 15], the later one is incorporated into the IN-SPIRET M system1 . Both systems display documents as points in 2D space following a similarity-based layout. Clustering and projections are employed to position groups of documents and to reduce the number of distance calculations. Infosky also creates a hierarchical display by embedding structure into the similarity relationships, so a user can focus in and out analogously to manipulating a telescope. In addition to implementing a suite tool to handle and explore projections, PEx also incorporates many tools for text manipulation, being appropriate for the analysis of various types of textual data sets.
3
PEx: Projection Explorer
PEx handles mapping and visual exploration of several types of data sets that lend themselves to similarity calculations by means of classical or specific metrics. In its current version it supports the following data types: (i) structured (table) data, that is, data points with numerical attributes, and their labels; (ii) distance data, that is, triangular matrices whose elements describe similarity values between data points; (iii) text data sets; and (iv) web search results. Projections onto the 2D space output a set of points placed on a plane, where every point represents a data element, and point proximity indicates likelihood of a close relation among the corresponding data elements, according to the chosen similarity measure. For exploration purposes each data point is exhibited as a circle, usually called a node. Connections can be displayed between nodes to convey some sort of relationship between the data points, forming a graph or a triangulation. In the following we provide an overview of PEx’s major functionalities by creating a multidimensional projection (or a data map) of a collection of textual documents. Since mapping of text collections was the initial target application for PEx, it incorporates several text manipulation tools. Two possible approaches can be employed to create a visualization from a set of textual documents. The classical approach, widely adopted in text retrieval, builds a vector representation of the text corpus, which is then handled as table data to derive the required similarity information. An alternative approach employs a similarity measure computed by directly comparing text against text. PEx 1 see
http://in-spire.pnl.gov/
supports both approaches: it offers a technique for direct comparison between textual documents, called Normalized Compression Distance (or NCD) [14], and it also offers tools to extract vector representations of text data, discussed in the following. Creating the vector representation is a – sometimes very elaborate – preprocessing procedure that requires varying degrees of user intervention, depending on data characteristics. It starts by removing context irrelevant words, called stop-words, such as articles, prepositions and, if application knowledge is available, words that carry little information for the domain. The preprocessing then carries out a frequency counting of the remaining words (or bag-of-words), for the whole document set, a procedure usually followed by some type of weighting of the words. PEx incorporates tools to perform all these steps, so it can be tuned to different domains. The resulting vector representation is a multidimensional data set that can be displayed and explored using one of the many currently existing multidimensional visualization techniques. As in PEx visualizations are based on projections, the multidimensional data feeds into the projection pipeline. Since text corpora typically results in a very high dimensional data table with many attributes, several dimension reduction processes are available, namely PCA, clustering and Fastmap. In any case, PEx can handle a fair amount of dimensions. Figure 1 shows a PEx window depicting a document map built from 2,684 RSS news collected from four online news agencies (BBC, CNN, Reuters and Associated Press) for two days in April 2006. This projection was computed using the LSP technique. This is a difficult data set to handle, since RSS news feed articles are small, and determining document similarity under these circumstances (many small documents) poses quite a few challenges. The vector representation computed after preprocessing had 2,242 dimensions. Figure 1 also illustrates other features of PEx: • informative labels are shown on top of the nodes; • users can search the map for occurrence of a particular word, or set of words: documents containing the expression will be colored based on how frequently it occurs; • once a node is user selected, its neighbors on the projection are highlighted in different colors, and so are their corresponding labels on the left window region; • functionality is provided to automatically detect and display topics over groups of documents; • several tools are available (icons on the right side of the main window) to explore the visualization graph, e.g., for highlighting, selecting, searching, repositioning and coloring nodes;
Figure 1. Main window of Projection Explorer (PEx): document map depicts a collection of online news.
• multiple maps can be created or loaded simultaneously, and a selection on a map can be coordinated with all the other maps open. Different neighborhood relationships between documents may be displayed as edges between nodes, helping users exploring document similarity on the map. A user may choose to connect nodes either with their nearest neighbors on the 2D plane, or with their nearest neighbors on the original multidimensional space. In Figure 1 one observes the two types of connection. Connections appearing on the highlighted regions of the bigger map were built by connecting every dark colored node to its nearest neighbor in the original domain (called RN connection). The detail map on the top right is connected according to a Delaunay Triangulation of the points, to form a point mesh. Neighborhood connections may be determined from the similarity relationships that generated the projection, from proximity computed on the projection itself, or from an external, user loaded similarity matrix. Such flexibility is interesting in that users can, for example, build the map employing one similarity relationship and verify point distribution according to another one. Once a node is selected with a single mouse click its neighboring connections are highlighted and a list is displayed of its nearest neighbors according to the current edge connection. This can be ob-
served at the bottom left sub-window in Figure 1, where the highlighted node (shown in red) is identified (‘marked point’) and its neighbors listed. Mouse rolling on top of a node causes a corresponding label to appear that identifies that data instance. A double click over a node displays additional information about its data point and its neighbors. Such additional information for display can be optionally fed into the system as a ‘zipped’ ASCII file – in the case of document maps this information is the document itself. Labels can also be automatically created for groups of documents. Figure 2 illustrates this and other capabilities of PEx on different regions of the same map depicted in Figure 1. Extra information represented as a scalar field associated to the nodes can be visually mapped to their color and size. A user can create such an attribute in several ways, e.g., selecting a particular point and have its similarity to all other points computed (as shown in Figure 2(a)); performing a hierarchical or a k-means clustering (see Figure 2(b)); or yet loading an external scalar field. Figure 3 depicts the overall process to generate interactive visual representations of multidimensional data in PEx. The user may feed the system with (1) a document collection, a structured data table, (2) or a distance matrix (3). In the first case, documents are converted into a vector repre-
Figure 3. Generating projection maps of multidimensional data with PEx.
(a) Label shows title of a news item, color depicts similarity between this document and all the others.
(b) 2D clustering helps locating groups of related news
Figure 2. Details of the News data map sentation, from which distance calculations are performed. Alternatively, distances may be calculated directly from the text set, or a distance matrix may be fed into the system. From distance relationships a 2D projection is generated and users can interact with its visual representation to gain insight in the data. PEx incorporates many additional functionalities to assist exploration of multidimensional projections of both general table data and text collections. Many of those will be further demonstrated in the following section, as we exemplify exploratory visualizations conducted on different data sets.
4
Exploring High-dimensional Data
Constructing a document map is, in itself, an information gathering procedure aimed at adjusting the display to answer user’s questions. The goal is to obtain a display that reflects an organization of the document set capable of supporting the user’s quest for knowledge acquisition. We continue to illustrate the capabilities of PEx for text mapping using the example introduced in the previous section, now highlighting the interactive nature of the tool and how
it supports a user driven exploratory process. To explore document maps, users need both an overview of the various topics being addressed by the documents and proper mechanisms to locate interesting material for further in-depth examination. Users can navigate and search the overview map and gradually identify relevant or irrelevant material or groups of related texts, then focus on specific regions of the map and on relationships between documents and groups of documents. Users can focus by filtering documents in or out the initial overview map. Documents may be filtered out by selecting a particular region or by removing highlighted documents. Figure 4(a) shows a view of the News map in which documents containing both the words ‘full’ and ‘details’ are highlighted. These are news items with no content, except the title. The map in Figure 4(b) was generated from the text collection after removing those news (from the original 2,684 documents 2,450 remained in the collection). Groups of documents can be labeled automatically to help users identify their underlying topics. To compose a label for a selected group of documents, the system first chooses the pair of words with the highest covariance in the vector representation of the group. Then, for each remaining (non-selected) word it computes the mean of the covariances relative to these first two words. If this is a significant value relative to the highest covariance, e.g., above a defined percentage threshold (in this paper we used 50%) the word is added to the label. The same process can be employed to generate topic labels for groups of documents obtained from a (k-means) clustering of the projected points. Figure 4(b) shows each cluster displayed with a different color and its individual label. Users can focus on particular regions and then further locate new groups and topics within them. Figure 4(c) shows topics generated for several user selected regions. Some of these topics had already appeared in the previous map, but new ones were found in the exploration, indicating a ‘(minor) topic within a (major) topic’ or a specific topic caught in-between groups of news addressing more frequent
themes. We are also developing novel techniques for topic detection based on association rules that support progressive coverage of maps, some of which are already available in the system. The functionalities provided allow one to explore the News maps to locate pockets of subjects (themes) that were highly popular during the two days in which the news corpus was collected (late April, 2006). The major news (identified in the map in Figure 4) were: the ‘bird flu’ (a swan found dead in Great Britain and later confirmed to have the disease), discussions on White House leaks on Iraq, Iraq bombings, Elections in Peru, Trial on ‘Da Vinci Code’, discussion of Palestinian aid after Hamas victory, immigration laws discussed in USA senate, and so on, as indicated by the labels. Two further examples illustrate PEx’s functionalities to map and explore multidimensional data, departing either from computed data similarity relationships (expressed as a distance matrix), or from attribute-value tables. In either case the map reflects similarity amongst data elements by neighborhood in 2D space. Figure 5 presents a projection of a time series data set that describes stream flow measurements taken at different power plant reservoirs located on the Paran´a river basin (Brazil) along year 2005. A distance metric suitable for time series was employed to compute similarity between series of different reservoirs, and the projection was created with the IDMAP technique. Node colors identify geographical position of the plant in the different river sub-systems that comprise the whole basin. Their distribution suggests that stream flow behavior of geographically close reservoirs is, in most cases, very similar, which was confirmed by a specialist. Figure 6 illustrates the exploration of a table data set containing information on the Human Development Index of countries worldwide, for year 2006, made available in the Human Development Report 2006 (http://hdr.undp.org/hdr2006/statistics/) of the United Nations Development Programme. It includes comparative measures of life expectancy, literacy, education, and standard of living – in total eight variables measured for 177 countries. The HDI indicates whether a country is a developed, developing, or underdeveloped country and also provides a measure to assess the impact of economic policies on quality of human life. Two different maps were built from this data, one using the LSP (Figure 6(a)), and the other using the IDMAP technique (Figure 6(b)). All data attributes, except the UN assigned index, were used to generate the maps. Both projections clearly reflect groups of countries with similar quality of life, in close consonance with the UN index value, mapped to color. By coordinating user selection on both maps (user selected nodes in the LSP map, outlined in black, are also highlighted in the other
(a) Highlighting news containing words ‘full’ and ‘details’
(b) News map after removal of documents highlighted in Figure 4(a). Cluster labels displayed
(c) Selecting and labeling groups of news.
Figure 4. Further exploring maps of the News data
(a) Triangulation view
(b) Surface view
Figure 7. Different views of HDI map (IDMAP)
Figure 5. Streamflow measurements at power plants from the Parana´ river basin. Colors identify plant geographical region; nodes connected by Delaunay triangulation.
map) one observes similar groupings located at relatively similar positions in both maps. Alternative visual representations of the projections can be generated, e.g., projected points are triangulated to build a surface mesh. Surface attributes such as point height, color, isolines and others offer additional visual dimensions to map multiple scalar fields associated with the data. Figure 7 illustrates a triangulation of the HDI projection and a corresponding 3D surface.
Figure 8. ProjClus Map of the results of a web search on ”Visual Analytics”.
the acronym ‘PNL’ (for Pacific National Laboratory). Maps of very large table data or document collections can be very cluttered. Nonetheless, PEx incorporates several tools for focusing on interest areas, while maintaining an overview of the complete data set. (a) LSP map: locating a group of countries
(b) IDMAP: position coordination
Figure 6. Projections of 2006 HDI data PEx also generates projections from web search results, a particularly troublesome type of data. It employs Google search API to recover a query search. Figure 8 shows a map of 570 results from a web search with the query ‘visual analytics’. Color reflects the k-means clustering of the projection, and node size shows documents whose body contain
5
Discussion and Conclusions
PEx provides integrated tools and techniques to build, explore and coordinate multiple data maps of high dimensional data, using effective projections. The examples given illustrate how the techniques are capable of grouping and separating pre-classified test data sets with very high precision. Indeed, as long as a similarity measure is found that can group highly correlated data instances, high precision projection-based displays provide a powerful framework to improve user performance in analyzing large highdimensional data sets, including document collections. The maps afford exploration at multiple levels, from a global overview, through detailed examination of sub-groups, up to inspecting individual elements. Unlike clustering, which separates data elements into unrelated pockets, precise projections can reveal intra-group relationships, providing additional insight. Map formation, for the examples shown, happens in realtime in a fast desktop computer. As an illus-
tration, considering the Quadruped Mammals data set (artificially generated multidimensional table data with dimensionality 72), with 100,000 instances, generating its ProjClus projection on a Pentium IV 3.2GHz, 2GB RAM, takes 82.843s. Considering the same data set with 30,000 instances, generating the LSP projection on the same machine takes 227.672s. As compared to conventional clustering, data preparation required to generate maps is minimum. For text data, a reasonable amount of text body (a couple of paragraphs) is sufficient to generate good projections, as shown in the RSS news feed and web results examples. Departing from an appropriate stop-words list for a given collection is advisable, and deriving such a list thus require some user interaction prior and along the map generation process. Alternatively, PEx also incorporates the NCD measure, which avoids the vector model and reduces user intervention considerably. Projection-based interactive visualizations highly integrated with user views and mining algorithms are useful in many application domains other than text, as long as the same principles hold, that is, meaningful data exploration is enabled by similarity analysis by proximity of groups and neighborhoods. If this is the case, maps offer an intuitive metaphor for user driven exploration, and PEx provides a unified framework to handle high dimensional data in general, offering a valuable and accessible tool for interactive exploration of complex data sets. Scalability is one issue to be handled to enable this framework to be applied to much larger data sets. We strongly believe that a hierarchical organization can be conceived that allows employing projections to explore data instances at multiple abstraction levels, and multiple levels of detail. Moreover, a proper data structure can avoid unnecessary similarity calculations and work incrementally. Text similarity measures for homogeneous data sets also deserve further investigation.
Acknowledgements This work has been partly supported by FAPESP Grants 03/02815-0, 04/01756-2, 04/09888-5 and 04/07866-4, and CNPq Grants 304758/2005-1 and 305861/2006-9. We acknowledge our collaborators and research students for their contributions to PEx and the InfoVis2 project.
References [1] K. Andrews, W. Kienreich, V. Sabol, J. Becker, G. Droschl, F. Kappe, M. Granitzer, P. Auer, and K. Tochtermann. The InfoSky visual explorer: exploiting hierarchical structure and document similarities. Information Visualization, 1(3/4):166–181, 2002.
[2] M. Chalmers. A linear iteration time layout algorithm for visualising high-dimensional data. In Proc. of the 7th IEEE Visualization, (VIS)’96, pages 127–132, Los Alamitos, CA, USA, 1996. IEEE C.S. Press. [3] T. F. Cox and M. A. A. Cox. Multidimensional Scaling. Chapman & Hall/CRC, 2 edition, 2000. [4] I. T. Jolliffe. Principal Component Analysis. Springer, 2 edition, 2002. [5] F. Jourdan and G. Melancon. Multiscale hybrid MDS. In Proc. of 8th Inf. Visualization Int. Conf. (IV’04), pages 388– 393, Washington, DC, USA, 2004. IEEE C.S. Press. [6] R. Minghim, F. V. Paulovich, and A. A. Lopes. Contentbased text mapping using multi-dimensional projections for exploration of document collections. In Vis. and Data Analysis 2006, Proc. SPIE-IS&T Electronic Imaging, volume 6060, page 60600S, San Jose, California, 2006. SPIE. [7] A. Morrison and M. Chalmers. A pivot-based routine for improved parent-finding in hybrid mds. Information Visualization, 3(2):109–122, 2004. [8] M. C. F. Oliveira and H. Levkowitz. From visual data exploration to visual data mining: a survey. IEEE Trans. on Vis. and Comp. Graphics, 9(3):378–394, 2003. [9] F. V. Paulovich and R. Minghim. Text map explorer: a tool to create and explore document maps. In Proc. of 10th Inf. Visualization Int. Conf. (IV’06), London, 2006. IEEE C.S. Press. [10] F. V. Paulovich, L. G. Nonato, R. Minghim, and H. Levkowitz. Visual mapping of text collections through a fast high precision projection technique. In Proc. of 10th Inf. Visualization Int. Conf. (IV’06), London, 2006. IEEE C.S. Press. [11] G. Ross and M. Chalmers. A visual workspace for constructing hybrid multidimensional scaling algorithms and coordinating multiple views. Information Visualization, 2(4):247– 257, 2003. [12] J. W. Sammon. A nonlinear mapping for data structure analysis. In IEEE Trans. on Comp., volume C-18, pages 401– 409, May 1964. [13] E. Tejada, R. Minghim, and L. G. Nonato. On improved projection techniques to support visual exploration of multidimensional data sets. Information Visualization, 2(4):218– 231, 2003. [14] G. P. Telles, R. Minghim, and F. V. Paulovich. Normalized compression distances for visual analysis of document collections. Computer & Graphics, Special Issue on Visual Analytics (to appear), June 2007. [15] J. A. Wise. The ecological approach to text visualization. J. of the American Soc. for Inf. Sci., 50(13):1224–1233, November 1999. [16] J. A. Wise, J. J. Thomas, K. Pennock, D. Lantrip, M. Pottier, A. Schur, and V. Crow. Visualizing the non-visual: spatial analysis and interaction with information for text documents. In Readings in inf. vis.: using vision to think, pages 442–450, San Francisco, CA - USA, 1995. Morgan Kaufmann Publishers Inc.