wireless sensor networks, on the other hand, can gather sensorial data values .... Forest fire monitoring system, presented in the paper, is ..... good performance.
1
A Prototype for Wireless Sensor Networks to the Detection of Forest Fires in Large-Scale Yassine SABRI,Najib EL KAMOUN STIC Laboratory, Chouaib Doukkali University, B.P: 20 , El Jadida MOROCCO Email: {sabriyassino|elkamoun}@gmail.com
Abstract—Location determination is an important problem for almost all WSN applications. However, obviously becomes an important target in the case of surveillance systems for forest fires do not have to support real-time monitoring of each point of an area at any time location early threat of fire.Solutions applying wireless sensor networks, on the other hand, can gather sensorial data values, like temperature and humidity, from all points of a area incessantly, day and night, and allow for fresh and precise data to the fire-fighting center rapidly.In this paper, we present the pattern and implementation of a model for the detection and localization of forest fires and the control environment. In order to know precisely and almost in real time the risk of forest fires, we design and are implementing a protocol type "Range-based" for a large-scale deployment based on convex hull. The efficiency of the method is demonstrated by simulations, we show that our framework can supply quick response to forest fires while consuming energy efficiently. Index Terms—W IRELESS SENSOR NETWORK (WSN); L O ; S CALABILITY ; M ONITORING S YSTEM .
CALIZATION
I. I NTRODUCTION The rapid progress of wireless communication and the availability of many lightweight, small-size, and portable computing devices have made a great impact on community. These technologies have made the dream of communication anytime and anywhere possible. People using a mobile device can surf the web as well as talk with their friends while they are moving all over the world. To provide more value-added applications, such as geographical navigation for tourists, advertising messages for local potential customers, 911 emergency service for subscribers, etc., we need to acquire the location information of a mobile user (MU) with a mobile device. Among the WSNs applications, forest fire detection can be very helpful in avoiding human and material losses. For instance [1],the average annual number of forest fires throughout the Mediterranean basin is now close to 50 000,twice that during in the Seventies.In Morocco only, almost 500 forest fires were registered in 2010.In the last five years the average of fire occurrences was 540 with an area 4500 ha, with an estimated annual loss of $ 2,902,667 USD [3]. Since forest fire detection has been a main concern in many countries, diverse techniques have been devised to monitor forest fires. One of the most traditional methods is the use lookout towers located at high points. Unfortunately, this method has limitations due to the unreliability of human observations. For this reason, some techniques based on the use of technology have been proposed, as the Automatic Video
Surveillance System [2] or the use of NASA satellite images . However, the low spatial and temporal resolution of the satellite images may cause a delay in the fire detection process. One of the key features in a WSN is the location awareness in the information. When a WSN is deployed to monitor a wide area (for instance fire prevention or surveillance) the value of the data retrieved requires associated geographical information. If action is to be taken in response to a detection (send a helicopter, send a squad), it is necessary to know where the detected event is located and forest fire detection. A simple way to ensure this is to equip every node in the WSN with GPS. This solution is very likely to be unfeasible due to economical issues. The GPS hardware is rather expensive, WSN typically contain very high amounts of nodes, and are generally cost constrained. Therefore, only a small subset of the network can affordably be equipped with GPS; such nodes are called anchor nodes, or anchors. An automatic localization process is required for the rest of the nodes in the network, using the anchor nodes as reference points. This process is commonly known as location discovery . For this, distance measurements between sensor nodes are employed, and a multilateration system can be defined. There exist several techniques to estimate the distance between two sensor nodes, some of which will be described in much more details. Some proposals have been published that consider the use of WSNs to monitor and detect forest fires [3]. The use of multiple sensor sources, and the deployment of the sensor nodes in areas not visible to the satellite, increase the probability of a more accurate and early fire detection. WSNs event detection applications are in essence fusion information processes [4]. Fusion information can be defined as the use of the theory, techniques and tools created and applied to exploit the synergy in the information acquired from multiple sources (sensor, databases, information gathered by humans, etc.), in such a way that the resulting decision or action is in some sense better (qualitatively or quantitatively, in terms of accuracy, robustness, etc.) than would be possible if any of these sources were used individually without such synergy exploitation . Two algorithms for forest fire are proposed and evaluated. Both algorithms are based on information fusion techniques. The first algorithm to detect the forest fires is used a threshold method and nodes equipped with temperature, humidity and light sensors. The second algorithm uses for
localization of forest fires. Evaluation results show that both methods are able to efficiently detect fires in their initial stages. The rest of this document is organized as follows. The related work is presented in Section 2. In Section 3,introduces basic notions for this problem . In Section 4, we introduce the proposed localization algorithm based on convex hull. In Section 5, we introduce the proposed algorithm based on a threshold method. In Section 6, we evaluate the proposed schemes through comprehensive simulation studies. Finally, in Section 5 the conclusions and future work are presented. II. R ELATEDW ORK Forest fire monitoring system, presented in the paper, is created as a forest fire monitoring observer network. It is system for real time data monitoring, storage and processing. Collected data is used in information fusion for forest fire detection in initial stage similar to human observers network. Traditional forest fire monitoring systems are mostly based on human observers, located in monitoring stations on monitoring spots, creating the human observers network responsible for early detection of forest fires in certain monitoring area. Human observer collects data using natural sensors, particularly vision, and artificial sensors like weather stations. Based on previous experience, human observer merges collected data to detect a forest fire in an early stage and to predict enhanced forest fire risk. For example, past experience is knowledge about specific weather conditions that can enhance forest fire risk resulting in increased human observer attention. When human detects the fire, the appropriate fire alarm is raised and the fire fighters activated. A study on the location errors in several applications for WSN is done in [5]. The work focuses on exposure, bestand worstcase coverage, and shortest path routing. The norm functions are used in this work as the objective functions for location discovery. The process is incremental: at each step, all nodes that can triangulate their locations using distance measurements from anchors determine their locations, and become anchors themselves for the rest of the nodes. The sources of errors are identified and modeled, and the propagation and effect of the errors are studied. A different focus is adopted in [6], where the main stress is put on the robustness of the localization. A robust localization is defined as one that avoids flip ambiguities. A distributed algorithm for beaconless network localization is proposed, in which nodes use noisy distance measurements only. Thus, locations are determined up to a global rotation and translation. The concept of robust quadrilaterals is introduced, representing quads of nodes that can be unambiguously located even in the presence of measurement noise; when a node cannot be included in such a quad, its location is not determined and is considered unknown. The algorithm is implemented on a physical WSN, and supports localization of mobile nodes. One of the first proposals of the use of wireless communication for fire detection was the SIGMASPACE system, that uses smoke detectors [7]. In [8], Chen et al. proposed a method based on data fusion. The algorithm used temperature, smoke density and CO density values, and neural networks and fuzzy
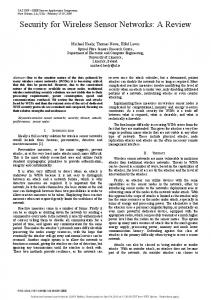
inference to determine if a fire has occurred. However, none of these proposals are based on the use of WSN technology. Doolin and Sitar described in [9] a system to monitor forest fires, based on the use of WSN. The nodes of the system were able to sense temperature, humidity and barometric pressure, and were equipped with GPS units. However, the authors did not describe any method to detect fires. Yu et al. proposed in [10] a paradigm for forest fires detection that use a WSN. It considered that the motes included temperature, relative humidity, smoke and wind speed sensors. The nodes of the WSN are organized in clusters, and assign a node as a cluster leader. Processing the data sensed by the nodes, the cluster leader calculates a weather index using a neural network. This index is sent by each cluster leader to the manager node, which determine if there is a risk of a fire. FireWxNet was proposed by Hartung et al. in [11], a multi-tiered portable wireless system for monitoring weather conditions in rugged wildland fire environments. The motes of the WSN sensed temperature, relative humidity, and wind speed and direction. FireWxNet was designed to provide a better comprehension of the weather conditions related with the presence of fire, and did not consider its detection. In all the studies discussed above [12][13], the sensor nodes are deployed to have quite large distances between each other and the sensory data gathered at a center is supported with visual data obtained with cameras. Our proposed system, however, considers a densely deployment strategy where the distances between neighboring sensor nodes are quite short. In this way, we are aiming to detect forest fires in a much faster way and send the related information to a center as quickly as possible. Our aim in this work is to consider the above goals as much as we can in designing a wireless sensor network for fire detection. Besides these goals, there may be some other crucial requirements for a WSN designed for fire detection, such as providing security, coping with vandalism, incorporating selfhealing mechanisms, and being able to self-organize. We do not consider these requirements in this work and leave them as future work issues. Our proposed framework as shown in 1 is composed of two modules: Localization and Detection. III. METHODOLOGY In this paper, we focus on mobile sensor network. Moreover, we assume that all the sensors have identical transmission radius r. however, it is easy to adapt our method with sensors having different transmission radius. We represent a wireless sensor network as a graph G(V, E) where V is the set of n nodes representing sensors and E is the set of m edges representing communication links. If two nodes u, v are neighbors, then they are linked and the distance between u and v is smaller than r. We assume also that some anchors have a priori knowledge of their own positions with respect to some global coordinate system (GPS) (black nodes in figures). We consider scenarios where nodes and anchors are mobile. For example, in a military context, soldiers can be equipped with sensors and tanks with anchors. Soldiers use tank positions in order to obtain their positions. Finally, we should take into account functionalities of each sensors:
A framework for use of WSN
Localization
IV. LOCALIZATION TECHNIQUE
Detection
Position demand Trigger
Alarm
Fig. 1.
representing the position error. The node knows that derr . By using a predefined threshold, if derr ≤ threshold then the node has an estimation close to its real position. In this case the node becomes an estimated anchor and broadcasts its position .
The components of platform
for example, methods like RSSI or ToA/TDoA and AoA described in previous section. A wireless sensor networks is represented as a bidirectional graph G(V, E) where V is the set of n nodes representing sensors and E is the set of m edges representing communication links. If two nodes u, v ∈ V are neighbors, then they are linked that means distance between u and v is smaller than r. The set of neighbors for a node u ∈ V is noted N (u). Anchor nodes have knowledge of their location through some other means, such as GPS or simply explicit programming. The set of anchors is noted Λ. The set of neighbor anchors for a node u is noted NΛ (u)(NΛ (u) = N (u) ∩ Λ) and the set of non-neighbor anchors is noted NΛ (u)(NΛ (u) = Λ/NΛ (u)). Note that all identical nodes (anchors or others nodes) have the same capabilities (energy, processing, communication, ...). The coordinate of a position of node u is noted (xu , yu ).P is the set of all possible positions in a network. Our method construct the convex hull of a point cloud Su for each node u,this convex hull is noted conv(Su ). The localization modules (eg, GPS or Galileo) are expensive and consumers of energy,for this our method seeks to use the least possible anchors with the Nodes can use technology measures distances as ToA, RSSI, AoA. So, when it receives a signal from a transmitter, a node deduces that it is located on the circle centered on the transmitter. The exact distance between two nodes u and v is noted duv . Two neighbor nodes u, v know duv (via ToA, ...). The estimated distance is noted dˆuv . The following section explains how to obtain these estimated distance. the set of circles built from the knowledge of anchor neighbors is noted CNΛ ,the set of circles built from the knowledge of non-anchor neighbors is noted CNΛ . � is the distance between the estimated position (xuestmi , yuestmi ) of the sensor u and the summit furthest from convex hull Conv(S). Let derr being the distance between the estimated position of a node and its real position,
Initially, each anchor broadcasts its position. A node can therefore be deduced the distance between each of the anchors We use the technique SumDist (Savvides et al., 2002) for estimating distances adding the distances between separated sensor nodes of an anchor.Upon receiving the position of a anchor, a node considers the following cases: • If it receives directly the position of the anchor, he deduces they are neighbors and therefore it located on the circle centered at the anchor or radius of a circle is r. • If it receives the position by an intermediate node, it concluded that it is not neighbor of the anchor and therefore it is not inside the circle of radius r centered in anchor . So,when a node u receives a position of an anchor A, it estimates the distance to this anchor with Sum-Dist and draws one or two circles. In fact, if (A ∈ NΛ (u)), u knows dAu and deduces that it is on the circle CAu of radius equals to dAu and centered in A. If (A ∈ / NΛ (u)) then u knows that it is not inside the circle of center A and radius r otherwise A and u would be neighbors. Moreover, u knows the estimated distance to A, dˆAu deduced by Sum-Dist. By triangular inequality, dˆAu ≤ dAu . u applies this technique to each received anchor position. So, u is inside the circle CAu of center A and radius dˆAu . Thus, the intersection of circles defines a cloud of points Su . the center of gravity of the convex hull of this cloud conv(Su ) represents the estimated position of u. The main
Fig. 2.
State machine diagram for Sensor node not estimated
design of SLSN our localization method , which is a simple finite state machine. As shown in figure 2, a node running SLSN is in one of four states at any time: (i) Sensor not estimated, (ii) Sensor estimated, (iii) estimated Anchor,and (iv) improve the accuracy. Transitions between the states are triggered by events. After the SLSN protocol is initiated, the node enters the Sensor not estimated state,whenever the node receives a broadcasting ProbePacket packet, the node enters the sensor not estimated state and uses this packet to estimate
its postion,after this stage of estimation the node switches to another state is depending on the value of the estimation error found,if espilon tr_threshold
tr_ratio > tr_threshold
lr_ratio ≤ lr_threshold
lr_ratio > lr_threshold
tr_ratio ≤ tr_threshold lr_ratio ≤ lr_threshold
tr_ratio ≤ tr_threshold
Sb
Sc hr_ratio ≥ hr_threshold
hr_ratio ≥ hr_threshold
D E dAXA XG1 � F
Sf
dˆBX B
hr_ratio < hr_threshold tr_ratio > tr_threshold lr_ratio > lr_threshold hr_ratio < hr_threshold
hr_ratio < hr_threshold tr_ratio > tr_threshold tmp-tmp_s0 > tmp_threshold hr_ratio < hr_threshold activated the alarm
dˆCX
C
Sd
Se Sj
Fig. 3. Example of estimating the position for X at the reception of localization information from C anchor
anchors A, B and C. It estimates distances dˆAX , dˆBX , dˆCX with Sum-Dist. Since all an- chors are not neighbors of X then X is not inside circles centered respectively in A, B, C with a radius equals to r but it is inside circles with radius equal to dˆAX , dˆBX , dˆCX . The intersection of these circles defines the cloud points SX for a node X .X computes the center of gravity of the convex hull conv(SX ) of this cloud and estimates its position in G2 . V. M ETHOD FOR F OREST F IRE D ETECTION In order to devise an algorithm to detect forest fires using a WSN, it was important to understand the prevailing environmental conditions when a fire occurs.According to the work performed by [14] We found that in normal conditions, the temperature, light and relative humidity values show a cyclical behavior. The temperature and relative humidity values maintain an inversely proportional relationship among them. That is, when the temperature increases, the relative humidity decreases. The light intensity shows a stable and high level during the day, and a stable and very low level during the night. The light values show a sudden change during transition period of day to night, and vice versa. When a fire occurs, the temperature shows a rapid increment, whereas the relative humidity decreases fast. Besides a fire, the exposition of the mote to a direct sunshine is the event that causes a drastic change on these values. The light intensity does not show a
significant change in the presence of a fire, unlike the results reported by da Penha et al. in [14]. If a bigger source of fire is used to conduct the experiments, perhaps the sensed light values may show an important increment. However, since we want to detect the fire in its early stage, we used a small torch. Using these observations, we defined two algorithms to detect forest fires. The first algorithm uses a fusion information method known as the threshold method [4]. The algorithm is based on the state machine shown in Fig. 2, which defines five states. The transition from one state to another is generated when a relevant change in the values of temperature, light or relative humidity is detected, indicating the probable existence of a fire. The initial state is the Sa and represents the normal (i.e. no fire) environmental conditions. The states Sb and Sc are transitional states, since they indicate the probable occurrence of a night fire or a day fire, respectively. The Sd may represent the sunrise, whereas the Se may indicate that the mote was exposed to direct sunshine. Finally, the Se represents the presence of a fire. In normal conditions, the state machine is in Sa . Even though the values of the temperature, light and relative humidity are collected, in the Sa only the temperature value is evaluated. Every time the temperature is registered, the ratio between the average of the values of a sliding window of size WT and the new temperature value, is calculated. The sliding window contains the most recent WT temperature values recorded. If this ratio is greater than tr_threshold, it means a large change in the temperature value and a that possibly a fire has been detected. To determine if it is night fire,
VI. EVALUATION To evaluate our framework, we designed and implemented a custom simulator based on the J-Sim simulator [15] and performed extensive simulation experiments. In this section we first describe our simulator and then provide our experimental results and discussions.We developed a custom simulator that can simulate a wireless sensor network monitoring a forest and detecting fires. A. Our simulator The simulator is developed in JAVA based on the J-Sim simulator [15] and using netbeans 7 development environment. It can accept a set of input parameters from the user before a simulation run. When a simulation run is started, the simulator can simulate the actions of the sensor nodes, the protocol operations, the transfer of sensory data and events to a center, the occurrence of a fire and spread of fire, and the operations of the network to detect the fire and inform the center about the fire and fire spread. When a simulation run is completed, results are produced into a file that can be used to evaluate the proposed system components and protocols.
0.6 error mean
the rate of change of the light is evaluated, in a similar way as we did with the temperature. Therefore, if the ratio between the average of the values of the sliding window of size WL and the most recent light value is greater than tl_threshold, the machine changes to the Sb . Otherwise, it changes to the Sc . It is important to note that while in Sa , in temp_s0 we store the last stable temperature value; that is, the value before the machine moved from Sa . If the machine is in Sb , we calculate the ratio of the average of the values of the sliding window of size WH and the most recent value of the relative humidity. If this ratio is less than th_threshold, the machine moves to Sd ; otherwise, it goes back to Sa . While the machine is in Sd , the ratios are still computed, and if they are greater (or smaller, in the case of humidity) than their respective thresholds (i.e., the temperature is still increasing while the relative humidity is decreasing), the machine moves to Sf to determine the localization of fire,and systematically moves to Sj and an alarm is activated, indicating the probable occurrence of a fire.
0.4
δ = 5% δ = 10% δ = 20%
0.3 1
2
3
4
5
confidence Fig. 4.
Impact of the confidence threshold
increases when the percentage of range errors is higher than 15. In the next experiences the value of confidence is equal to 2. The positions to estimate are generated randomly on a surface A = L × L with dimensions of experimentation varying between 100 × 100 to 800 × 800 and a density of sensor α = 20, each configuration obtained is repeated for each of the two methods.the range of the sensors was set at 14. Globally, the positions determined by a localization algorithm represent a geometrical layout of the physical positions of the sensors. This layout must be compared to the ground truth, or known layout of the sensors. It is important therefore that not only the error between the estimated and real position of each node is minimised, but also that the geometric layout determined by the algorithm matches well the original geometric layout. In order to have a unified approach for evaluate the accuracy of our technique and a solid frame for analysis of the scalability,we propose to use two metrics. •
B. Simulation results We performed extensive simulation experiments to evaluate our framework. Since our framework consists of many schemes, we evaluate each scheme and its design decisions in a separate sub-section below. 1) Localization scheme: In figure 4 When the value of confidence is equal to 2, the obtained error mean is the best. In fact, when the value of confidence is higher than 2, the voting process is very strict and nodes cannot deduce their positions. Conversely, when the value of confidence is lower than 2, the voting process assigns in some times bad positions to sensors because it uses a few number of anchor positions and some wrong informations can be used. This comment is confirmed when increases. But, it is possible that this value
0.5
•
MAE(Mean Absolute Error): The simplest way to describe localization performance is to determine the residual error between the estimated and actual node positions for every node in the network, sum them and average the result. Broxton et al in [16] do this using the mean absolute error metric (MAE), which, for each of n nodes in the network, calculates the residual between the estimated nodes and actual coordinates. Pn (xi − x ˆi )2 − (yi − yˆi )2 M AE = i=1 (1) n with (xi , yi ) the real position and (ˆ xi , yˆi ) the estimated postilions . GDE (Global Distance Error): As discussed briefly at the start , it is important for the accuracy metric to reflect not only the positional error in terms of distance, but also in terms of the geometry of the network localization result. GDE in [17] takes the RMS error over the network of n nodes and normalises it using the constant R. In Ahmed et als context, R represents average radio range, meaning
Mean Absolute Error (R)
δ = 5% 1.5 1 0.5 0
(GDE)Global Distance Error (R)
with dˆij The estimated distance between i and j and dij The actual distance between i and j. Subsequently, the simulations will highlight the influence of following parameters on the performance of our method: • The density of network and dimension of the network; • Measurement errors δ that will take the values 0%,5%,10% ; • The percentage of anchors noted α,are selected randomly among the network nodes .
0.2 0.15 0.1
5 · 10−2 200
10
15
20
600
800
Fig. 6. Global Distance Error with δ = 0% and density of anchors α = 15%
140 120 100 80 5
5
400
Dimension of networks (m)
Average Detection Time (sec)
the localization results are represented as a percentage of the average distance nodes can communicate over. v u Pn Pn dˆij −dij 2 u 1 t i=1 j=i+1 ( dij ) GDE = (2) r n(n − 1)/2
10
15
20
Density of node
percentage of anchors Fig. 5.
Rate of the average error (MAE) with a dimension L = 400 (m)
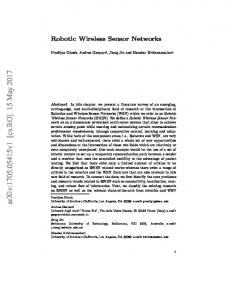
The graph of figure 5 represents the performance of SLSN in a scale (L ≤ 400) , when range errors are introduced, the behavior of average error rate MAE of our method related to percentage of anchors. These curves indicate the accuracy of localizations when δ is equal to δ = {0, 5, 10}% . Without surprise, performances of SLSN decrease when range errors increase and keeps a good estimation of positions. Note also that after 10% of anchors the average error rate decreases slowly. Figure 6 shows the impact of the dimension of network on the behavior of average error rate GDE. When the dimension of network increases, the average error GDE remained stable for SLSN . In fact, a large scale, the comportemente of our technique based on Jarvis’s March remains stable and capable of operating. C. Average Detection Time Finally, In 7 compares our threshold method against the base scheme for various density of node . Again our scheme performs much better when density of node is increased. As mentioned above, in our scheme, in case of a fire, a sensor node immediately broadcasts an emergency packet without much delay based on thresholds detection with temperature, humidity and light sensors.
Fig. 7. Fire detection durations of environment aware and base models as the number of density of node varies.
VII. C ONCLUSION In this paper, we present a general framework for a wireless sensor network to be used for forest fire localization and detection. Our framework considers all parts of the life cycle of a wireless sensor network system that is specialized for forest fire detection with localization. The algorithm based on the thresholdmethod was simpler to implement and showed a good performance. As future work, we plan to develop a new algorithm to detect forest fires based on the use of evolutionary programming. R EFERENCES [1] F. F. Paper, Réunion de la FAO sur les politiques nationales ayant une incidence sur les incendies de forêt. FO, 1998. [Online]. Available: http://www.fao.org/docrep/003/x2095f/x2095f00.htm [2] E. D. Breejen, M. Breuers, F. Cremer, R. Kemp, M. Roos, K. Schutte, and J. S. D. Vries, “Autonomous forest fire detection,” in Proceedings of AusWeb 2000, the Sixth Australian World Wide Web Conference, 1998, pp. 167–181. [3] M. Bahrepour, N. Meratnia, and P. Havinga, “Automatic fire detection: A survey from wireless sensor network perspective,” Enschede, the Netherlands, December 2008. [Online]. Available: http://doc.utwente.nl/65223/ [4] E. F. Nakamura, A. A. F. Loureiro, and A. C. Frery, “Information fusion for wireless sensor networks: Methods, models, and classifications,” ACM Comput. Surv., vol. 39, no. 3, Sep. 2007. [Online]. Available: http://doi.acm.org/10.1145/1267070.1267073
[5] S. Slijepcevic, S. Megerian, and M. Potkonjak, “Location errors in wireless embedded sensor networks: sources, models, and effects on applications,” SIGMOBILE Mob. Comput. Commun. Rev., vol. 6, no. 3, pp. 67–78, Jun. 2002. [Online]. Available: http://doi.acm.org/10.1145/581291.581301 [6] D. Moore, J. Leonard, D. Rus, and S. Teller, “Robust distributed network localization with noisy range measurements,” in Proceedings of the 2nd international conference on Embedded networked sensor systems, ser. SenSys ’04. New York, NY, USA: ACM, 2004, pp. 50–61. [Online]. Available: http://doi.acm.org/10.1145/1031495.1031502 [7] G. Huang, J. He, and Z. Ding, “Wireless video-based sensor networks for surveillance of residential districts,” in Proceedings of the 10th Asia-Pacific web conference on Progress in WWW research and development, ser. APWeb’08. Berlin, Heidelberg: Springer-Verlag, 2008, pp. 154–165. [Online]. Available: http://dl.acm.org/citation.cfm?id=1791734.1791756 [8] S. Chen, H. Bao, X. Zeng, and Y. Yang, “A fire detecting method based on multi-sensor data fusion,” vol. 4, Oct. 2003, pp. 3775–3780 vol.4. [9] D. M. doolin and N. sitar, “Wireless sensors for wildfire monitoring,” in Society of Photo-Optical Instrumentation Engineers (SPIE) Conference Series, ser. Society of Photo-Optical Instrumentation Engineers (SPIE) Conference Series, M. tomizuka, Ed., vol. 5765, May 2005, pp. 477–484. [Online]. Available: http://dx.doi.org/10.1117/12.605655 [10] B. Kosucu, K. Irgan, G. Kucuk, and S. Baydere, “Firesensetb: a wireless sensor networks testbed for forest fire detection,” in Proceedings of the 2009 International Conference on Wireless Communications and Mobile Computing: Connecting the World Wirelessly, ser. IWCMC ’09. New York, NY, USA: ACM, 2009, pp. 1173–1177. [Online]. Available: http://doi.acm.org/10.1145/1582379.1582636 [11] C. Hartung, R. Han, C. Seielstad, and S. Holbrook, “Firewxnet: a multi-tiered portable wireless system for monitoring weather conditions in wildland fire environments.” in MobiSys, P. Gunningberg, L.-k. Larzon, M. Satyanarayanan, and N. Davies, Eds. ACM, 2006, pp. 28–41. [Online]. Available: http://dblp.unitrier.de/db/conf/mobisys/mobisys2006.html [12] D. Hall and J. Llinas, “An introduction to multisensor data fusion,” Proceedings of the IEEE, vol. 85, no. 1, pp. 6–23, 1997. [13] J. Lloret, M. Garcia, D. Bri, and S. Sendra, “A wireless sensor network deployment for rural and forest fire detection and verification,” Sensors, vol. 9, no. 11, pp. 8722–8747, 2009. [Online]. Available: http://www.mdpi.com/1424-8220/9/11/8722 [14] O. S. da Penha and E. F. Nakamura, “Fusing light and temperature data for fire detection,” in Proceedings of the The IEEE symposium on Computers and Communications, ser. ISCC ’10. Washington, DC, USA: IEEE Computer Society, 2010, pp. 107–112. [Online]. Available: http://dx.doi.org/10.1109/ISCC.2010.5546519 [15] T. O. S. University, “J-sim home page,” http://j-sim.cs.uiuc.edu/, cited July 2011. [16] M. Broxton, J. Lifton, and J. A. Paradiso, “Localization on the pushpin computing sensor network using spectral graph drawing and mesh relaxation,” SIGMOBILE Mob. Comput. Commun. Rev., vol. 10, pp. 1–12, January 2006. [Online]. Available: http://doi.acm.org/10.1145/1119759.1119760 [17] A. A. Ahmed, H. Shi, and Y. Shang, “Sharp: A new approach to relative localization in wireless sensor networks,” in Proceedings of the Second International Workshop on Wireless Ad Hoc Networking - Volume 09, ser. ICDCSW ’05. Washington, DC, USA: IEEE Computer Society, 2005, pp. 892–898. [Online]. Available: http://dx.doi.org/10.1109/ICDCSW.2005.125