Second International Congress on Technology, Communication and Knowledge (ICTCK 2015) November, 11-12, 2015 - Mashhad Branch, Islamic Azad University, Mashhad, Iran
A recommender system based on trust and semantics in collaborative systemsusing a new measure of association Seyedeh Homa Alizadeh Computer EngineeringDepartment Imam Reza International University Mashhad, Iran
[email protected]
Majid Vafaei Jahan Computer Engineering Department Islamic Azad University Mashhad, Iran
[email protected]
Abstract—One of the most popular techniques used in recommender systems is collaborating filtering. In this technique it is usual that Pearson’s correlation is used to find the similarity between users. It is a known fact that Pearson’s correlation is not suitable for measuring the strength of nonlinear relations. Since Spearman’s correlation is in fact Pearson’s correlation applied to ranks and does not work well in non-monotone relationships and since measures like Kendal’s tau do not work well in small samples, we introduce a new measure of association to be used in collaborative systems which we shall call alpha. Our investigations show it leads to better MAE. We also propose a method by combining Alpha and trust propagation and add a new algorithm to semantic similarity for confronting the problems with cold startand it leads to better coverage.
Keywords: recommender systems, alpha measure of association, semantic similarity, collaborative filtering, cold start I.
INTRODUCTION
Recommender systems help the user by predicting the items that he or she is more interested in and thus save him or her time and effort. In recommender systems, there are two main concepts, one being user, that is the person who benefits from the service and the other being item, whichis to be recommended. The users to whom some items are to be recommended are called active users. One of the frequently used recommender systems uses collaborating filtering(CF) method. In this method users rate the items usually on a discrete numerical scale from 1 to 5. Here 1 and 5 may indicate the least and the most interest, respectively. In order to provide recommendations, ratings are used to compute the similarities between users and/or items [1,2]. It is usual to use Pearson’s correlation (PC) as the
978-1-4673-9762-9/15/$31.00 ©2015 IEEE
N. R. Arghami R&D Department FAMA Technology Naperville, IL, USA
[email protected]
measure of similarity. Since the ratings of two users on the same set of items (or the ratings of two items given by the same set of users) cannot be assumed to have a linear relationship, PC may not be the best choice as a measure of similarity for the problem at hand [3,4,5,6]. Spearman’s correlation is suitable only for monotone relationships and measures like Kendal’s tau do not perform well in small samples [6]. Thus we introduce a new measure of similarity which we call alphaand denote it by Į. We shall investigate its properties and in particular we shall see that it has a better MAE. To increase the efficiency of CF, especially in relation to cold start problem, we use a concept called trust. To this end, users indicate explicitly their degree of trust in other users, or this can be evaluated by the system implicitly [7,8,9]. Another way to compute the similarity between items is the semantic-based technique. Semantically similar items to the user’s items of interest are then recommended. For this technique ontology, or item taxonomy is used. This technique helps us deal better with the cold start problem and gives better coverage[9,10]. We shall use semantic similarity between users and between items, by using taxonomy, in order to increase coverage and the efficiency of the system. II.
BACKGROUND AND RELATED WORK
A. Content-based recommender systems Content-based recommender systems make their recommendations based on attributes and descriptions of items and user’s interests profile. Description of items can be structured, semi-structured or non-structured. Structured descriptions are like a table, in which the columns contain the attributes and descriptions of items [11,12]. User’s profile can be provided by the user or can be obtained from user’s feedback on used items[11,13]. B. CF recommender systems CF is the most popular technique in the current recommender systems. It divides into two methods of user-
530
based and item-based. Similarities between users are computed from common ratings of items between two users and similarities between items are computedfrom the ratings given by common users to a pair of items [1,2,9,11]. C. Trust-based recommender systems Recommender systems based on trust use social networks, in which users rate each other according to the degree to which they trust every other user [8]. This degree of trust can be explicit or implicit. For explicit trust the degree of trust is obtained from the social links between the users and implicit trust is extracted from item ratings [9,14,15,16]. D. Semantic-based recommender systems Semantic-based recommender systems use semantic attribute of users for generating recommendations. Semantic information, for example, can include item properties, relationship between items and meta information. Taxonomy and ontology are two important sources of semantic information. They discover and classify new information about items and user profiles [9,10]. III.
THE PROPOSED APPROACH
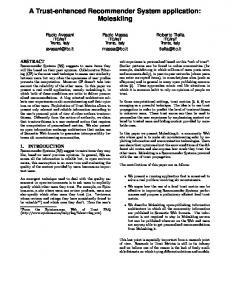
Fig. 1shows the structure of the proposed approach. This approach has three modules. Modules are parallel and independent. The first and third modules are user- dependent, while the second module is item- dependent. The inputs are a raw user-item rating matrix, item taxonomy and user taxonomy. A. User-based similarity and trust module This module makes recommendations based on similarity and trust of the users. The output of this module is user-item matrix and contains predicted ratings based on this module. 1) Computing similarity and implicit trust of the users In this section we introduce our new similarity measure alpha and use it to compute similarity and implicit trust of users. Our proposed similarity measure alpha is defined as
4n ab − α ab =
n ab
¦ (raj − ra ) − (rbj − rb ) j=1
wherena and nb are the total number of items rated by users a and by b, respectively. The final result is eα a ,b = α a ,b × UJaccard a ,b ,
(3)
eĮa,b[א0,1]. 1) Propagation of trust When there is not a direct relation between two users, we can use trust propagation technique [7,8,9,14,15,16]. Suppose, for example, that user a trusts user b who trusts user c. Using the trust propagation technique, we can find out how much a trusts c. The formula for trust propagation is
¦ eα a,b × (eα b,c × β d )
Peα a ,c =
b∈adj(a )
¦ eα a , b
, eα ≥ λ,
(4)
b∈adj(a )
β d = (MPDist − d + 1) / MPDist, d ∈ [2, MPDist].
(5)
In(4), there areusers denoted by b who are trusted by a and c is a user who is trusted by users b. Parameter Ȝ is a tunable parameter. Trust propagates from a to c through b if the degree that a trusts b is equal to or greater than Ȝ, where Ȝ[א0..1] [9]. The degree of trust that is computed from(4) decreases for each additional level of propagation [8]. In(5), ȕd(א0..1]. MPDist is the maximum distance of the user in the beginning point of propagation to the user who receives propagation. Parameter d indicates the number of users between the user under consideration and the final user. 2) Choosing neighbors In this section we select the most similar neighbors from the set NPea. To do this we use Top-n method [9,18]. 3) Computing prediction weights We use the following formula to predict the rating of active user a אU on the item x אI. N Peα
(1)
, 4n ab where raj and rbj([א1,5]) are ratings given to item j, respectively by users a and b. In(1), ra and rb are the mean ratings given by a and b, respectively, to all items that are rated by each user separately and nab is the number of items that have been ratedby both a and b. It is easy to show that Į takes values in the interval [0,1]. Values of Į closer to 1 indicate more similarity. We shall use a threshold value of 0.5 for Į. The threshold 0.5 is the boundry between dissimilarity and similarity. We have also reached this threshold by experimenting on the dataset under study. Since when raj=rbj , for all j, Į=1, regardless on the number of common items, nab, we adjust the value of Į by subjecting it to Jaccard formula as in [17], that is we multiply Į by n ab UJaccard ab = , (2) n a + n b − n ab
R aα,x
¦ Peα a,b × (rb,x − rb + ra )
=
b=1
N Peα
.
(6)
¦ Peα a,b b=1
In(6), ra and rb([ א1,5]) are respectively the means of ratings given by active users a and b. rbx([ א1,5]) is the rating of user b on item x. The degree of similarity and also of trust of active user a to its neighbor user b is denoted by PeĮab([א0,1]). The set of chosen neighbors for active user a is
denoted by NPea and R α a ,x ([ א0,1]) is the predicted rating.
B. The module for the item-based CF similarity and semantic similarity In this module the recommendations are generated by combining item-based CF and item-based semantic filtering approaches. Also in this module the weight of item reputation is defined and used in the prediction process. The module of this section is quite similar to Shamour’s second module [9].
531
Figgure1.Proposed recommendation approach diagram
1) Computing item-based CF similarity In this section, in order to computee item-based CF similarity, we use a combination of cosine ssimilarity [19] and item-based Jaccards [17]. Ux ,y
¦ (ru,x − ru )× (ru,y − ru )
IAdjCos x , y =
u =1
Ux,y
Ux,y
u =1
u =1
.
(7)
¦ (ru,x − ru )2 × ¦ (ru,y − ru )2
IJaccard x , y =
U x,y U x + U y − U x,y
.
(8)
In (7),rux, ruy([א1,5]) denote the active uuser u’s rating of items x and y, respectively. ru is the meean of all ratings given by user u to all items. Ux, Uy and Uxyy are the set of all users who have rated item x, item y and booth items x and y,
respectively .|Ux|, |Uy| and|Uxy|, are th he number users in Ux, Uy and Uxy, respectively. The final form mula of this section is
eICFx,y = AdjCosx,y × IJaccardx,y .
(9) Which gives the item-based CF simiilarity between item x and the neighbor item y which has an outtput in [-1,1].
2) Computing item-based seman ntic similarity First, in order to use semantic information, i we construct the item taxonomy in a tree structture. To do this we first identify the main categories of item ms and we assign items to appropriate categories. An item can belong to more than one i determined on the basis category. Similarity between items is of their semantic descriptions in thee taxonomy tree [9]. The corresponding formula is
SSim x , y =
C111 , C 01 + C100 + C11
(10)
for each pair x and yאI, by which seemantic similarity between the target item x and the neighbor item i y, SSimxy ([א0,1]) is
532
computed. C11 refers to the number of categories common between x and y, C01 refers to the number of categories to which x belongs but y does not and C10 refers to the number of categories to which y belongs but x does not. 3) Computing item reputation First, we compute item reputation using the formula § Uy R y = ¨¨ ¨ U ©
· ¸ ×r , y ¸¸ ¹
(11)
in which Uy is the number of users who have rated y, |U| is the total number of users and ry is the mean of ratings of item y. 4) Chossing neighbors In this section we choose two sets of neighbors, using Topn method. One set is chosen based on item-based CF similarity, NeICF, and the other is based on item-based semantic similarity, NSem. 5) Computing prediction weights We use the following formula to predict ratings of active user aאU on item xאI: R SeCF a,x N
(13) FPa,x[א0,5]. D. User’s semantic similaritycomputation module In this module we construct user’s taxonomy tree to be able to use user’s semantic information. In this section only job related user’s information is used. Construction of user’s taxonomy tree is similar to that of items, with the difference that in user’s taxonomy tree each user has a job. In this tree the first level is root and various jobs are in the next level and in the next level users are placed in the appropriate category according to their jobs. In order to compute the semantic similarity of users, we compute the means of the ratings given by users of each job, separately. In case that, using formula (13), an item remains without rating, this module is used for rating it. To estimate the rating of an item which couldn’t predict it in pervious section, the mean of estimated rating for that job is used. °usJob j , x FFPa, x = ® °¯ FPa , x
= rx +
eICF
NSem
¦ (eICFx,y × (ra,y − ry )×R y ) + ¦ (SSim x,y × (ra,y − ry )×R y ) y =1
if FPa , x = 0 if FPa , x ≠ 0
(14)
In(14), j is the job of the active user a and x is the target item. FFPa,x[א0,5].
y =1
N eICF
NSem
y =1
y =1
¦ (eICFx,y + R y ) + ¦ (SSim x,y + R y )
IV.
(12)
EMPIRICAL RESULTS
A. The dataset The dataset used in this study is MovieLens in [20]. The sparsity of this dataset is 0.937.
In (12), R SeCF a ,x [א1,5] and rx and ry([א1,5]) are the mean of ratings of the target item x and the neighbor item y. eICFxy ([א-1,1]) indicates the item-based CF similarity of the target item x and the neighbor item y.SSimxy ([א-1,1]) indicates the item-based semantic similarity of the target item x and the neighbor item y. NeICF and NSem are two sets of the closest neighbors of the target item x on the basis of item-based CF similarity and item-based semantic similarity, respectively. rayሺ[א1,5]) refers to rating of active user a on neighbor item y.
B. Evaluation matrics Mean Absolute Error (MAE) and Coverage are used to evaluate the recommendation methods [2,13,18]. Smaller values of MAE indicate higher accuracy and higher coverage values are more desirable.
C. Fusion of predictions In this module ratings are predicted for the items that have not been rated by active user a. The ratings obtained in this module are the fusion of the ratings obtained in the previous two modules.
Equation(15),needs the set of actual/predicted rating pairs for all the nitems available in the test set.
FPa , x
0 =0 if R aα, x = 0 and R aSeCF ,x ° °R α =0 if R aα, x ≠ 0 and R aSeCF ,x ° a, x ° SeCF = ®Ra, x ≠0 if R aα, x = 0 and R aSeCF ,x ° ° 2 × R aα, x × R aSeCF ,x ≠0 if R aα, x ≠ 0 and R aSeCF ° α ,x SeCF °¯ R a, x + R a , x
n
¦ ra,i − rp,i MAE =
i =1
.
n
Coverage =
Ip n
.
(15)
(16)
In (16), Ip denotesthe number of items for which a prediction can be made and n is the number of available items. C. Benchmark algorithm To evaluate the proposed approach, it should be compared with other methods. For this purpose, we use Shambour’s [9] work. The reason for using this method is this work’s similarity to our proposed approach.
533
We use a similarity measure based on a new measure of association instead of PC in the first module and add a new user semantic module at the end of the approach.
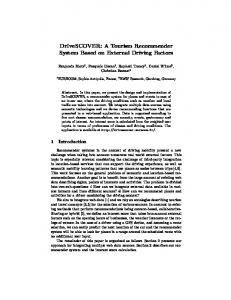
compute the MAE and coverage of the proposed approach for different ratings of users for items to investigate the cold start. 2 MAE(%)
D. Parameter setup Based on the experiments that we have done on the dataset MovieLens, we have selected the values of the constant parameters in order to have the best results on accuracy and coverage. The settings Ȝ=0.2 and MPDist=3 and Į>0.5 seem to be the best thresholds for the similarity computations.
1.5 1
20 25 30 35 40 45 50 Ratings of CS users Figure4.MAE of Shambour'ssystrm and ours for various numbers of ratings for CS users
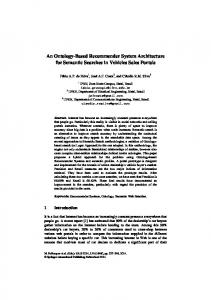
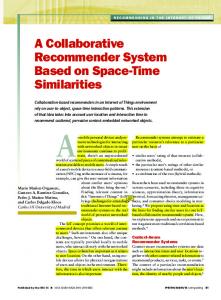
1) Number of neighbors In Fig. 2andFig. 3 the MAE and coverage of the proposed approach and those of Shambour’s method are compared for the number of neighbors from 10 to 90.
Coverage(%)
0.5
0.82 MAE(%)
0.8 0.78
0.4 0.3 0.2
Shambour
0 20 25 30 35 40 45 50
Shambour
0.72
proposed
0.1
proposed
0.74
Shambour
0
E. Evaluation of the proposed system The evaluations were done in three parts: number ofneighbors, the impact of the proposed approach on the user cold start problem and the item cold start problem.
0.76
proposed
0.5
Ratings of CS users
10203040507090
Figure5.Coverage of Shambour'ssystrm and ours for various numbers of ratings for CS users
Number of neighbors
Coverage(%)
Figure2.MAE of Shambour'ssystrm and ours for various numbers of neighbors
1.2 1 0.8 0.6 0.4 0.2 0
As we see in the mentioned figures, MAE of the proposed approach is slightly better, while the improvement in coverage is more significant. 3) Item cold start We investigate the item cold start problem with the proposed approach inFig. 6andFig. 7. The figures show the MAE and coverage of the methods for different number of item ratings, in relation to item cold start.
proposed Shambour
2.5
10 20 30 40 50 70 90 MAE(%)
2
Number of neighbors Figure3. Coverage of Shambour'ssystrm and ours for various numbers of neighbors
1.5 1
proposed
0.5
Shambour
0
As we see inFig. 2, the MAE of the proposed approach, for small number of neighbors, is smaller than that of Shambour’s, indicating that under this condition our approach has a better output. Also inFig. 3, we see that the coverage of the proposed approach is greater than that of Shambour’s, the differences getting smaller as the number of neighbors becomes larger. 2) User’s cold start InFig. 4 and Fig. 5, we investigate the proposed approach in confronting user’s cold start problem. To do this we
534
2 5 10 15 20 25 30 Ratings of CS items Figure6.MAE of Shambour'ssystrm and ours for various numbers of ratings for CS items
Coverage(%)
0.5 0.4 0.3 0.2
proposed
0.1
Shambour
0 2 5 10 15 20 25 30 Ratings of CS items
Figure7.Coverage of Shambour'ssystrm and ours for variousnumbers of ratings for CS items
As we see in these figures, in both cases the proposed approach has a better output. V. CONCLUSION AND FUTURE WORK In this paper we have presented a new approach, based on trust and semantics, for personalization of recommendations. A new measureof association, that we have named alpha, is proposed to replace Pearson’s correlation and our evaluations show better efficiency in terms of MAE, based on alpha. We have also improved the coverage by adding a third module based on semantic similarity. In future work we hope to make a more accurate use of user’s semantic similarity.
[12] Porter, M. ,“An Algorithm for Suffix Stripping”, Program, 1980. 14(3): p. 130-137 [13] J.B. Schafer, D. Frankowski, J. Herlocker, S.Sen, “Collaborative filtering recommender systems”, in: B. Peter, K. Alfred, N. Wolfgang (Eds.), The Adaptive Web: Methods and Strategies of Web Personalization, Springer, Heidelberg, 2007: p. 291–324. [14] J. O'Donovan, B.S., “Trust in recommender systems”. Proceedings of the 10th International Conference on Intelligent User Interfaces, 2005: p.167–174. [15] C.-S. Hwang, Y.-P.C., “Using trust in collaborative filtering recommendation”, New Trends in Applied Artificial Intelligence, Springer, 2007: p. 1052–1060. [16] W. Yuan, L.S., H.C. Chao, D. Guan, Y.K. Lee, S. Lee, “ITARS: trustaware recommender system using implicit trust networks”, IET Communications, 2010. 4(14): p. 1709–1721. [17] L. Candillier, F. Meyer, F. Fessant, “Designing specific weighted similarity measures to improve collaborative filtering systems”, in: P.Perner (Ed.), Advances in Data Mining. Medical Applications, ECommerce, Marketing, and Theoretical Aspects, Springer, Heidelberg, 2008: p. 242–255. [18] J. Herlocker, J.A. Konstan, J. Riedl, “An empirical analysis of design choices in neighborhood-based collaborative filtering algorithms”, Information Retrieval, 2002. 5(4): p. 287–310. [19] B. Sarwar, G. Karypis, J. Konstan, J. Reidl, “Item-based collaborative filtering recommendation algorithms”, in: Proceedings of the 10th International Conference on WWW, 2001: p. 285–295 [20] “MovieLens Data Sets | GroupLens Research.” [Online]. Available: http://www.grouplens.org/node/73. [Accessed: 20-Dec-2012].
To evaluate the proposed approach we compared it with Shambour’s work, because of its similarity to our proposed method. In fact this article is based on his work. We saw that our proposed method compares favorably with that of Shamour’s. REFERENCES [1]
Tuzhilin, G.A.a.A., “Toward the next generation of recommender systems: a survey of the state-of-the-art and possible extensions”, IEEE Transactions on Knowledge and Data Engineering, 2005. 17(6): p. 734749. [2] Lee, H.J., Kim, J.W. and Park, S.J,”Understanding collaborative filtering parameters for personalized recommendations in e-commerce”, Electronic Commerce Research, 2007. 7(3): p. 293-314. [3] CROXTON, F.E.A., D.J.A. COWDEN, and S.A. KLEIN, “Applied General Statistics”, Pitman,1968.p. 625 [4] Dietrich, C. Frank. “Uncertainty, Calibration and Probability: The Statistics of Scientific and Industrial Measurement 2nd Edition”, A. Higler, 1991.p. 331 [5] AITKEN, A.C,“Statistical Mathematics 8th Edition”, Oliver & Boyd,1957. p. 95 [6] Göktaú, Atila, and Öznurøúçi. “A Comparison of the Most Commonly Used Measures of Association for Doubly Ordered Square Contingency Tables via Simulation”, Metodoloskizvezki , 2011. 8(1): p. 17-37. [7] Massa, P.a.B., Bobby, “Using Trust in Recommender Systems: an Experimental Analysis”, In Proc. of 2nd Int, Conference on Trust Management, 2004: p. 221-235. [8] Avesani, P.M.a.P., “Trust-aware collaborative filtering for recommender systems”, In Proc, Of Federated Int, Conference On The Move to Meaningful Internet: CoopIS, DOA, ODBASE, 2004. [9] QusaiShambour, J.L., “A trust-semantic fusion-based recommendation approach for e-business applications”, Decision Support Systems, 2012. 54(1):p. 768-780. [10] Mabroukeh, N.R.E., C.I., “Ontology-based Web Recommendation from tags”, IEEE 27th International Conference, 2011: p. 206-211. [11] Pazzani, M., &Billsus, D.” Content-based recommendation systems”, The adaptive web, 2007: p. 325–341.
535