IEEE TRANSACTIONS ON ROBOTICS AND AUTOMATION, VOL. 10, NO. 4, AUGUST 1994. Short Papers. A Robust, Automated Alignment Concept for Robotics.
IEEE TRANSACTIONS ON ROBOTICS AND AUTOMATION, VOL. 10, NO. 4, AUGUST 1994
530
Short Papers A Robust, Automated Alignment Concept for Robotics horizontal lateral component
Louis J. Everett and Robin C. Redfield
Abstract-A video-based pose sensor is presented that overcomes some of the common problems with typical robotic pose sensors. The Targeting and Reflective Alignment Concept (TRAC) sensor operates using the optics of reflection. TRAC is a robust sensor capable of both continuous and discrete pose sensing in the presence of a class of disturbance inputs (extraneous lighting). Key features of the sensor are its high sensitivity to orientation error, its decoupled handling of orientation and translation (without calibration transformations), and its ability to provide intuitive feedback to a human operator for tele-operation. The sensor has been shown successful at target tracking with a PUMA manipulator in the laboratory and in automatic positioning of NASAJSC’s Manipulator Development Facility (MDF) telemanipulator arm used for shuttle astronaut training.
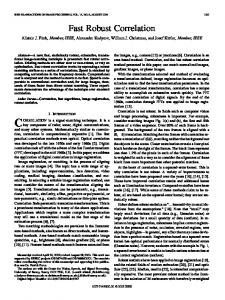
line of sight , axial component (roll axis) Fig.
(yaw axis)
TRAC alignment components
target mirror
Fig
component
Cross hairs and tic m a
monitor
;
on target and monitor.
I. INTRODUCTION This paper deals with a particular method of aligning two objects relative to each other. The method uses a relative pose sensor. In robotics, relative pose sensors fall into one to two basic categories: continuous sensing, and discrete sensing. Some sensors used in robotics are described in the references [11, PI, [3L 141, ISl, 161, ~71,[SI,~91,[IO]. There are several “typical” problems with existing sensors used in robotics. Many sensors tend to be less sensitive to target orientation than one might desire. For example, if performing a peg in hole insertion, it is often necessary to determine orientation alignment very accurately unless force control is implemented. Typical methods for determining orientation (perspective projection [ I 11) often require very accurate position information to compute orientation. Another problem (especially when used in tele-operator SYstelns) is the coupling between orientation measurements and translation. If one must perform some transformation on the sensor readings to determine translation from orientation. the sensor outputs are coupled. To expect a human operator to perform transformations on sensor readings is out of the question. hence if a coupled sensor is used for feedback to a human, pre-processing becomes necessary. In addressing some of these issues, this paper presents an automatable, pose sensor. The sensor is video based. Key features of the sensor are its high sensitivity to orientation error. its decoupled rotation and translation error signals, and the ability to simultaneously provide “intuitive” feedback for a human operator and a computer controller. The alignment strategy is termed “TRAC,” the Targeting and Reflective Alignment Concept. The sensor has been used with a PUMA manipulator to automatically track moving targets. It has also been used at NASA JSC’s Manipulator Development Facility, to automatically position a Shuttle RMS “look-alike” arm at a stationary grapple point.
Manuscript received January 29. 1992; revised November 16, 1993. This work was performed under NASA grants NAG9-374 and NAG9-362. Engineering. Tenas The authors are with the Department of A&M University, College Station, TX 77843 USA. IEEE Log Number 9402094.
11. MANUAL IMPLEMENTATION OF TRAC Alignment information from TRAC is communicatedto an operator by ,,ideo feedback. The includes a video camera on object of the pair, a calibrated monitor, and a special reflect,ve surface on the second object of the alignment pair. A. Sensor Components this specific implementation of the system. the is secured to a control-lable manipulator and the reflective surface is attached to a passive target object. For this reason, and for ease in communication, the camera will be referred to as the manipulator and the reflective surface will be referred to as the target or mirror based on the context, The purpose of the system is to align a manipulator tool (mounted on the end effector presumably) with the target to precision docking or insertion task. perform me alignment is described relative to a coordinate system fixed in the manipulator camera, oneaxis of the coordinate system lies on the line of sight (or the optical axis) between the manipulator camera and the target mirror as shown in ~ i 1. ~The. video camera is secured to the manipulator preferably coincident with the alignment axis between objects, The other translational alignment components are lateral positions normal to the line of sight (one horizontal and one vertical). Rotational alignment components are roll, pitch and fixed in the target and yaw about to those shown in ~ i 1, ~ ,
B . Alignment Sensing Alignment error is determined by the image in the video array or monitor. For calibration purposes, both the target and monitor have cross hairs fixed and nominally centered on their surface. The cross hairs are calibrated with tic marks as shown in Fig. 2. One tic mark is enhanced to indicate which cross.hair axis should appear in the positive vertical direction. The target mirror cross hairs serve to identify the mirror’s position. Incident lighting reflects off the cross hairs and into the camera lens. As long as the mirror is facing the
1042-296X/94$04.00 0 1994 IEEE
IEEE TRANSACTIONS ON ROBOTICS AND
AUTOMATION. VOL. IO, NO. 4, AUGUST 1994
In the figure, the camera must be manipulated a small distance down and a larger distance to the left for centering the optical axis and the cross hairs. Both range and roll alignment are indicated by the cross-hair. tic mark images. Range is calibrated to the apparent length of the tic marks in the monitor. Roll i s determined by determining the angle of inclination of one or both of the cross hair lines.
cross hairs
r
cross ham image
53 I
lens
111. IMPLEMENTATION OF AUTOMATED TRAC
Fig. 3. Lateral translation alignment optics.
image
0
image
Fig. 4. Pitch and yaw alignment optics
video monitor disnlav
To make the system even or more powerful. automation of the alignment process is desired. The TRAC system has several advantages in this regard. For example, since the natural output from the sensor is operator friendly, safety (when in automatic mode) can be enhanced because the operator can easily see the progress and take control if necessary. Due to space restrictions placed on this paper, it i s not possible to detail the methods used in automating the TRAC. Suffice it to say that structured lighting techniques are used to reduce the video processing. For example, the “horizontal” cross hair consists of two “bright” spots; one on the left and one on the right of the target. The “vertical” cross hair also consists of two bright spots. A fifth spot i s located in the second quadrant to break the symmetry. The camera’s mirror reflection also appears as a bright spot. Video processing algorithms are written to determine the image location of each spot then convert spot locations into target pose.
IV. PERFORMANCE cross hair, image
Fig. 5. Monitor display due to target translation and orientation misalignment.
camera and falls within the cone of image acquisition, the mirror cross hairs will appear in the video image. Lateral translation alignment is indicated by the position of the cross hairs’ image in the video monitor, (see Fig. 3). Only when the cross hairs lie on the optical axis does the cross hairs’ image appear centered. Pitch and yaw orientation error i s quantified by the image of the camera (lens structure) that appears in the monitor. In a sense. the camera “sees itself.” As the target orientation changes, the image of the camera lens changes. (see Fig. 4). If the figure denotes the vertical plane, the target mirror is in a position of positive pitch and the camera image lies in the lower half of the image plane. Yaw orientation is identical io pitch. Normal alignment between the mirror and optical axis occurs when the camera image is centered in the image plane and monitor. Normal alignment is not dependent on translational alignment or camera to target range. As an example of simultaneous translation and orientation alignment sensing, consider Fig. 5 as the display of the video monitor while looking at the misaligned target mirror. Orientation alignment error is indicated by the camera image relative to the monitor center. The figure indicates a negative pitch error by the vertical offset of the camera image with the monitor centerline and a smaller negative yaw error by the horizontal offset (assuming the monitor vertical i s aligned with true target vertical). The sign of the error indicates orientation of the camera relative to the target (Fig. I ) and thus in the scenario of Fig. 5. the camera must rotate through positive pitch and positive yaw to become normal to the target.
The purpose of this section i s to establish some approximations .. for the -performance of a TRAC system. Since the TRAC measures six degrees of freedom, this section will discuss the performance in each of these freedoms. The performance measures we will establish are the resolutions and maximum values (where applicable) in each freedom. Resolution refers to the required motion to register a one pixel change on the video array. The section establishes general relationships for each of the performance measures and then evaluates them for the specific imaging system. An imaging system has three degrees of freedom. First the lens has focal length. f. Second the lens has a diameter ( 2 h ) (specified with the Fstop, F S T ~=I JI 2 h) ‘ Third the image plane can he moved relative to the focal point adjusting the focus. Common lenses are compound, but we will explain performance with a single stage lens for simplicity. We assume thin lens theory and recognize its approximate nature. The authors realized that this is not exactly correct for real lenses, but the calculations derived from the provide sufficiently accurate performance predictions that match well with the experimental results shown later. Non idealities such as distortion and imperfect geometry are not considered. For the research. an Hitachi CCTV model KP-I200 video camera i s used. It has a 9 mm x 7 mm estimated image plane and divides the plane into 512 by 480 light sensitive pixels. A 19 mm lens i h used to obtain a large enough field view. Because of proprietary considerations, no detailed data are available for the camera so some parameters are estimated. With the available light in our laboratory. a minimum Fstop of 3.8 is necessary. The lens i s focused at infinity hence we assume the distance from lens center to the image plane location is approximately 19 mm. The target chosen i s depicted in Fig. 6. A vision based TRAC sensor operates because the camera has the ability to measure the position of an object by relating it to its location on the image plane. Fig. 7 shows the loci of all points which have approximately the same location on the image plane. The image plane
I'::mi
IEEE TRANSACTIONS ON ROBOTICS AND AUTOMATION, VOL. LO, NO. 4, AUGUST 1994
532
c-- 1
4
.
-
10"
X X
0.00
Target &or
X X
X X
X X
-50.00
Fig. 6. The target used in the performance analysis.
-100.00
0.00
-50.00
50.00
100.00
I Target horizontal position (mm) 1 All Objects on This Line
Fig. 8. Lateral translation calibration.
I
I
Target Width = 21
1 Target
Fig. 7. Objects with the %+mecentroid in the image plane.
Camera
Z _ - _Y
1
Fig. 9. Definition of maximum lateral translation error.
R
The precision to which the camera data can detennine the true position of an object depends on the resolution of the image plane among other parameters such as depth of field, focus, and lighting. If we assume the image plane resolution is one pixel (it can be more or less depending on the lens' ability to focus and subpixel accuracy capabilities), then we can approximate the lateral translation precision (A.() as .ly =
Edge of Image Plane
Maximum Lateral Translation
location of the object can be approximated as:
RA. -c 1
target cannot laterally translate without leaving the field of view can be found by setting Yl to zero. It is found to be 0.472 Meter. Range is determined by measuring a pseudo perimeter of the retroreflector. The pseudo perimeter is chosen to be 4
p
5
= J=t+l
(2)
The term Ax is the resolution of measurement on the image plane (e.g., a pixel). In this regard, TRAC is no better (nor worse) than conventional vision based sensors. Since the pixel size (its resolution) is approximately millimeter, the lateral translation resolution is:
where lL, is the pixel distance between retros i and j. The range precision drops off with range because the perimeter is a linear distance measurement. The range error is the change in range required to produce a one pixel change in the perimeter of the retro-reflections. From (2),
-R A R = -AX
Ay = ____ 9R = 0.000925R 512( 19.)
1.Y
Equation (2) can also be thought of as the real units spanned by a single pixel. This interpretation can be useful in later calculations. At a range of 7 feet, the lateral resolution is calculated as 1.97 "/pixel for the assumed parameters. Laboratory data of lateral motion is shown in Fig. 8 where the retro-reflector's centroid position in the image plane is plotted against lateral movement of the target. The slope of the data is 1.74 "/pixel where the 12%) error can be attributed to parameter uncertainty and the simple camera model employed. Next. we wish to estimate the maximum horizontal translation error (E;) which can be tolerated before any part of the target leaves the field of view. Fig. 9 defines some of the terms used in the analysis. From the defaults (refer to Fig. Y), 6' = arctan = 13". and E; = taii(H)R - t = 0.23R - 0.254 Meter. The range when the
(3)
(3)
if Ax is the width of a pixel and y is the length of a line segment, AR is the change in range that changes the line segment image one pixel. For the pseudo perimeter of the target, (3) would have to be summed over each of the 10 line segments. Fig. 10 is a graph of experimental perimeter measurements as a function of range. The function is hyperbolic as expected. The maximum range occurs when the retro reflector's perimeter becomes indistinguishable. This occurs when the five retros fall onto a single pixel element. If the target has a width of t then from ( I ) the maximum range is estimated as R,,,,, = $ = 176 Meter. Here P is the length of a single pixel element. The measurement resolution in yaw and/or pitch is determined by how precisely the position of the self reflected camera image can be measured. For all practical purposes, this resolution is independent
IEEE TRANSACTIONS ON ROBOTICS AND AUTOMATION,VOL. 10, NO. 4, AUGUST 1994
533
60.00
3800.00
40.00
3600.00 ‘ x ” x X X
20.00
3400.00 x X X I
3200.00
0.00 x X X X X -
3000.00
..
, , , ,
2800.00,,,,,
-20.00
x ,,
, , , ,
-40.00 -2.00
-1.00
that encompass multiple pixels) can increase resolution much further. A 100 pixel object, which is not unrealistic, allows centroid resolution to less than 1/10 of a pixel and this increases resolution by a factor of IO. The maximum TRAC yaw and/or pitch angle (referenced collectively as A), which can be measured depends on the range and the mirror size. Fig. 1 I shows where the camera’s lens reflection will appear on the target mirror when the mirror is rotated. Essentially, the reflection “walks out” the mirror as the orientation is increased. The maximum measurable angle will occur when one of two things happens.
Yaw
Angle
Image
Location of the self reflection when target is rotated.
of range (R in Fig. 111. For a given range, the displacement of the self reflected image (distance y in Fig. 1 I ) is: 1 2
We relate the precision in ;j to y and R using differentials as: 1 . s m [ 2 , j ) , 5 R +Rcos(2:jj(Arj) 2
We can compute the precision in j as (we add errors instead of subtracting to obtain the worst case): =
(++ 9)
sec(2,j)
Now for all practical ianges and \mall yaw, the term y / ( R ) ’ is inugnihcant, therefore the yaw resolution is approximately.
A/? = A y w ( 2 j j ~~
R
-
I ) The reflection “walks off’ the mirror. 2) The reflection still hits the mirror, but is outside the field of view. Clearly. the first case occurs at large ranges, and the second occurs when the camera is in close. If the first condition holds, then it follows from simple geometry, that the maximum yaw and/or pitch (for a 0.25 Meter mirror) is:
(R)
,-I,,,,.= arcsin 0.25/2
y = Rcos(:j)siii(J) = -Rsin(2ij)
Ay =
2.00
Fig. 12. Yaw calibration.
Range calibration.
Mirror Center
Fig. 1 I .
1.00
Target yaw angle (deg)
Target range position (mm)
Fig. IO.
0.00
This is calculated via geometry by assuming the mirror center is on the optical axis of the camera, hence the image can walk up to half the mirror length before “falling off.” Clearly this is defined for ranges greater than 0.125 Meter. As shorter ranges, the mirror can strike the camera and we assume such small ranges will not occur. If the second condition holds (the reflection hits the mirror but is out of view), the value of ij,,,axcan be computed by determining the maximum y (see Fig. 11): yIlliLx=
Using (1) gives the following:
llycos2(l~)Sec(2iSj
SR
T
~
Uvng (2) we obtain (since
t E
1 siri(2b1,,,,) 2
-R
R for \mall yaw and realistic R )
1
1 = -Rsin(2:3,,,,,) 2
which can be solved as: (4) Using specific values, the precision of measurement of ( 1 is (in degrees): ll!j = O.053cos2(,~) sec(2ij)
The means each pixel change represents approximately 1/20 of a degree of yaw. Experimental results of yaw performance is in Fig. 12. The least squares slope is 0.0466 degrees per pixel which is within 12’A’ of that calculated. Note that sub-pixel accuracy (from objects
Of course the minimum angle (either that from ( 5 ) or (6)) is taken as the maximum yaw and/or pitch. Fig. 13 shows the maximum capture angle versus range. Roll about the center of the target is determined by measuring the displacement of the furthest target point. Fig. 14 indicates how this can be performed. The resolution of roll measurement is dependent on the resolution with which the target position can be sensed and the
IEEE TRANSACTIONS ON ROBOTICS AND AUTOMATION, VOL. 10, NO. 4, AUGUST 1994
534
Maximum TRAC Angle in Degrees
V. CONCLUSION
Versus Range in Meters
Self Reflected Image Leaves Field of View.
Self Reflected Image
Leaves Mirror.
I
0.5
1.5
1
2
2.5
3
Range Fig. 13.
An automated alignment and pose sensing concept has been presented that overcomes some of the common problems with current alignment strategies. The TRAC sensor is especially sensitive to pitch and yaw alignment while translation and rotation are decoupled directly. For tele-operation situations, this is extremely beneficial. Applications of the sensor include grapple and docking alignment for manipulator-target pairs and current implementation of the concept includes NASA’s remote manipulator system for shuttle payload activity and semi-autonomous satellite docking. Experimental performance of the sensor is currently being determined and future uses of the technology include micro-pose sensing and non-intrusive force-torque sensing.
Maximum TRAC capture angle versus range.
ACKNOWLEDGMENT The authors extend their gratitude to NASA Johnson Space Center and Mr. Leo Monford who inspired and supported much of this work.
REFERENCES
Fig. 14. Measurement of roll.
5.00
l
”
. -5.00 o ) ( x X X
1 -
-10.00
-4.00
-2.00
0.00
2.00
4.00
Target roll position (deg)
Fig. 15. Roll calibration
target size. The roll precision is computed as the roll angle required to make one retro-reflector‘s centroid move 1 pixel and can be computed from:
For the specific parameters in our problem, we have: 1=
RP
-=
d1
drgrws 0.23RMeter
Roll performance is shown in Fig. 15 where the actual target roll is plotted against the computed image roll. The graph does not pass through the origin because the target was not aligned with the rotating stage during calibration. When the stage indicated 0” the target was approximately 4” off in roll alignment.
[ I ] K. Lau, R. J. Hocken, and W. C. Haight, “Automatic laser tracking interferometer system for robot metrology,” Precisiorr Engineering, vol. 8, pp. 3-7, 1986. [2] I. Masafumi, K. Hane, F. Matsuda, and T. Goto, “Laser-diode interferometric sensor system for robot calibration,” in Proceedings of the First tnternational Symposium on Measurement and Control in Robotics. International Measurement Confederation, Houston, Texas, June 1990, pp. 13.1.1.. vol. 3. [ 3 ] H. W. Stone, A. C. Sanderson, and C. P. Neuman, “Arm signature identification,” in IEEE International Conference on Robotics and Automation, San Francisco, Califomia, April 7-10 1986, pp. 41-48. [4] T.-W. Hsu, “Robot accuracy improvement through kinematic parameter identification,” Ph.D. thesis, Texas A&M University, Mechanical Engineering, May 1987. (51 W. K. Veitschegger and C. H. Wu, “A method for calibrating and compensating robot kinematic errors,” in IEEE International Conference on Robotics and Automation. Raleigh, North Carolina, April 1987, pp. 3944. [6] T. B. Brock, “Calibration of a SCARA robot manipulator.” Master’s thesis, Texas A&M University, May 1989. 171 L. 3. Everett, “Forward calibration of closed-loop jointed manipulators,” International Journal of Robotics Research. vol. 8, no. 4. pp. 85-91, 1989. [8] S. A. Hayati and M. Mirmirani, “Puma 600 robot arm geometric calibration,” in IEEE Internatiorzal Conference on Robotics. Atlanta, Georgia, 1984. [9] L. J. Everett and T. W. Hsu, “A simple orientation independent sensor for determining robot positions,” Invention Disclosure, Texas A&M University. College Station, Texas, March 1986. [IO] L. J. Everett, “Understanding and reducing machine errors,” PAM Progress Report, Texas A&M University, Mechanical Engineering Department, Jan. 1990. [ i l l R. K. Gilbert, D. Canner, K. Gleichman, Y. Morita. and P. Tchoryk, “Sensor trade study volume 1: Autonomous rendezvous and docking,” Final Report for NASA JSC, ERIM-Environmental Research Institute of Michigan, P.O. Box 8618, Ann Arbor, MI 48107-8618, June 1990.