DG DemoNet-Concept - A new Algorithm for active Distribution Grid Operation facilitating high DG penetration Friederich Kupzog, Member, IEEE, Helfried Brunner, Wolfgang Prüggler, Tomaž Pfajfar, Member, IEEE, Andreas Lugmaier
Abstract—While distributed generation (DG) from renewable energy resources is seen as key element of future energy supply, current electricity grids are not designed to integrate a steadily increasing share of distributed generators. The hierarchical network topology was designed for unidirectional power flows and passive operation. In order to avoid excessively expensive grid reinforcements, new solutions for active grid operation will be necessary. This paper introduces a set of innovative technical measures that allow a higher DG penetration within the grid. A new control algorithm for coordinated voltage control in an active distribution grid featuring these measures is proposed. Simulation results for an application of the algorithm in an actual Austrian distribution grid segment are presented.
I. INTRODUCTION To fulfil the European energy policy targets [4], [5] a further increased deployment of distributed generation (DG) based on renewable sources (RES) is required. However, high penetration levels of DG are currently limited by the characteristics of the passively operated distribution systems. From a historical perspective the distribution network was designed to supply end users (loads) and not to connect generators. Common passive networks are operated based on a unidirectional power flow from the high voltage level of the transmission network with central gen-
Manuscript received January 15th, 2007. This work was carried out and financed within the scope of the Austrian Program on Technologies for Sustainable Development, "Energy systems of tomorrow" – a cooperation of the Austrian Federal Ministry of Transport, Innovation and Technology and the Austrian Research Promotion Agency (FFG). F. Kupzog is with the Institute of Computer Technology at Vienna University of Technology, Gusshausstrasse 27-29, 1040 Wien, Austria. Phone: +43 1 58801 38424; fax: +43 1 58801 38499; e-mail:
[email protected]. H. Brunner is with arsenal research, Giefinggasse 2, 1210 Wien, Austria. Phone: +43 50550 6382; fax: +43 50550 6390; e-mail:
[email protected]. W. Prüggler is with the Energy Economics Group at Vienna University of Technology, Department of Power Systems and Energy Economics, Gusshausstrasse 25-29, 1040 Wien, Austria. Phone: +43 1 58801 37369; fax: +43 1 58801 37397; e-mail:
[email protected]. Tomaž Pfajfar is with Faculty of Electrical Engineering, University of Ljubljana, Tržaška 25, 1000 Ljubljana, Slovenia. Phone: +386 1 4768 288; Fax: +386 1 4768 289; e-mail:
[email protected]. A. Lugmaier is with arsenal research, Giefinggasse 2, 1210 Wien, Austria. Phone: +43 50550 6673; fax: +43 50550 6390; e-mail:
[email protected].
eration units to the distribution network and to the consumers at the low voltage levels. At higher penetration levels of DG the former purely passive distribution system becomes active and the unidirectional flow changes to a bidirectional load flow. However, this development is usually not reflected when it comes to network operation, since in most cases DG is simply seen as a negative load. Real active operation means that generation, the network and consumption (loads) within the distribution system actively interact and adapt each other according to the actual load flow situation. The Austrian project DG DemoNet-Concept [1] represents new strategies in the field of distributed generation where currently passive distribution networks become active networks, able to accommodate a significant penetration from distributed generation. The conversion from passive to active operation introduces many challenges considering DG network integration, power quality, concepts and strategies for network planning, control and supervision as well as information and communication technologies. While the research work in the field of active networks is mainly focusing on theoretical part of the problem the goal of the DG DemoNet-Concept project is the practical realisation of a demonstration network where the active network approach is implemented with the least investment costs. Therefore the main goals of the DG DemoNet-Concept are: to choose representative parts of networks in Austria (e.g.: typical Austrian network topology and demand and supply structure) for practical realisation of demonstration networks with a high penetration of DG and to analyse within these low and/or medium voltage grid sections, the possibilities for implementing different model systems (step model ‘DG Integration’) and plan the technical, organisational and economical realisation. Within the project a simulation study was used to find and compare different solutions for dynamic operation of the distribution network with high DG penetration. In this paper the most complex approach of coordinated voltage control in distribution networks will be discussed in detail. II. CURRENT PRACTISE OF DG INTEGRATION The first result of the DG DemoNet-Concept project is a status report, where the current situation of DG in distribu-
1197
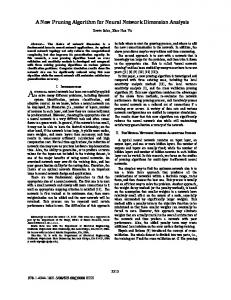
tion networks is analysed. For this, the share of DG in the networks of three Distribution Network Operators (DNOs) has been evaluated as shown in Tab. I. In two cases, the installed capacity of distributed generation is close to the maximum load in the network. The dominating primary energy carriers are hydro power and photovoltaic (with a high number of units but little installed power). In addition, the DG units are not homogeneously distributed in the networks (compare to Fig. 1). The key limiting factor for the development potential of DG in 30 kV networks and below is the overvoltage problem. Without massive grid reinforcement, additional generators would frequently be switched off by overvoltage protection. Tab.I Share of generation in distribution grids
GWhgen/GWhdem1 MWinst/MWgridmin2 MWinst/MWgridmax3 1 2 3 4
DNO1 (NL4 4-7) 0.11 0.72 0.22
DNO1 (NL4 3–7) 0.41 2.37 0.90
DNO2 (NL4 3-7) 0.54 2.76 0.94
DNO3 (NL4 4-7) 0.11 0.58 0.17
ratio of energy delivered by DG and energy demand in the network (annually) ratio of installed DG capacity and minimum load in the network ratio of installed DG capacity and maximum load in the network network level (level 3 is equivalent to 110 kV, level 7 to 0.4 kV)
specific for each individual country and grid. No single solution exists that can be applied in any case. Consequently, a larger set of different approaches was analysed. This set of technical measures includes solutions, of which some can easily be combined and some are complementary. By applying these measures to different, carefully selected example networks in Austria on a simulative basis, a step model was eventually found that describes possible measures in an ordered form, from simple but less effective solutions up to complex, but very effective measures. This model has so far been verified for three example networks. In this paper the focus lies on the final step, coordinated voltage control. IV. THE NEED FOR ACTIVE VOLATGE CONTROL Keeping the voltage between the defined limits is becoming a primary concern of DNOs. Increasing level of DG penetration causes the voltage to rise above limits, presenting risks for customer equipment. As the present DNO’s voltage control equipment is only able to handle limited amount of DG, the modification, replacement and new installation of different equipment is necessary to increase the DG penetration on the distribution networks. Loads, line impedances, power exported by the DG and the distance of the DG from the primary substation are the most important factors causing the changes in the voltage profile. The voltage profile change in the distribution network with DG can be explained on a simple network model, shown in Fig. 2.
Fig. 2 Simple distribution network with DG [3]. • dispersion of the installed capacity MW/km² • total generation 1161 Units • totalised 875 MW • therefrom 708 MV in NL 3 and 4 • hence installed DG capacity in total: 167 MW
Fig. 1 Example of the dispersion of installed DG power per m², Source: Energie AG OÖ Netz GmbH
III. METHODOLOGY The upcoming problem situation caused by a rising share of DG generation in distribution networks is assessed in the frame of the DG DemoNet-Concept project. Initially, a substantial study of related projects has been carried out, resulting in the finding that the problem situation and therefore also the approaches for possible solutions are very
1198
PDG and QDG are the active and reactive power export of the generator. QC is the reactive power compensation at DG site, PL and QL are the active and reactive power of the load. R and X are the line resistance and reactance respectively, US is the voltage at the substation, UR voltage at the bus where DG is connected, IR the current through the line between buses and P and Q the active and reactive power flowing through the line. The On-Load Tap Change (OLTC) transformer is able to adjust Us within certain limits. From Fig. 2 it can be seen that (1) U R = U S − ( R + jX ) I R . Using the fact that DNOs require DG to operate close to cos(φ) = 1 and by neglecting the imaginary part of UR, it can be derived (for details see [3]) that
UR ≈US +
RPDG . UR
(2)
It can be seen from (2) that voltage at DG busbar UR is higher than voltage at substation US due to DG active power injected into the line. Voltage at DG busbar mainly depends on the resistance of the line, the amount of injected active power from DG and the voltage at the substation. Maximum injected power from the DG can thus be obtained by reducing the voltage at the substation (with the OLTC). However, the voltage at the substation should be controlled in a way that voltage at the DG busbar is kept between the limits irrespective to the operation of the DG. In order to effectively control the voltage at the substation to allow more active power injection from the DG, it is necessary to measure the remote voltages in the network. V. STEP MODEL The following set of innovative approaches for voltage control has been developed. These tools actively use network assets (e.g. On-Load Tap changers), distributed generators and even loads to perform voltage control. These tools have been implemented into a simulation environment for validation and improvement. For this purpose, the simulation software DIgSILENT PowerFactory® has been used and adapted to allow performing realistic simulations. Validations have been made on exemplary MV networks provided by DNO participating in the project. The proposed five steps are shown in Tab. II and described below.
C. ‘Decoupling solution’ This approach considers the use of additional assets (e.g. voltage regulators) to decouple the voltage in parts of the network for which the voltage situation is different. D. Distributed voltage control In this step, the OLTC is controlled according to realtime voltage measurements at critical nodes of the network. In case the voltage exceeds the operational limits at one of the monitored nodes, the OLTC performs a tap change. The effectiveness of this control is limited by the network characteristic (e.g. different load flow characteristic of MV branches). This solution requires a communication infrastructure with limited requirements between selected nodes and the OLTC controller. E. Coordinated voltage control This step represents the most complex control (coordinated use of measures in B and D). A control unit controls the OLTC and the generators and/or loads participating to local control on the basis of the measurements received for the critical nodes. The use of coordinated local control allows solving the conflict appearing in the previous approach (OLTC not able to maintain the voltage within the limits in the whole network). Like in the previous steps, the critical nodes and the controlled generators have to be suitably selected. For this control, the requirements on the communication infrastructure are higher. The approach will be discussed in detail in Chapter VII.
Tab. II Voltage control tools used for each step of the model Assets utilised Step Current practise Local voltage control ‘Decoupling solution’ Distributed voltage control Coordinated voltage control
OLTC Fix set-point Fix set-point Fix set-point Variable set-point Variable set-point
Decoupling assets
DG
Loads
-
-
-
9
9
9
-
-
9
-
-
9
VI. EXEMPLARY GRID STRUCTURE Due to the individuality of grid segments it was found that no ‘typical’ grid structure for Austria can be specified. Hence, it was decided to concentrate on three different real examples from three different DNOs, so that as many as possible grid specifics are covered. P3
L4
DG12 DG11
DG10
DG9
P4
9
9
9
Hydro Photovoltaic Other New DG - plants Load nodes (referred in text)
H5 DG8
O3
DG6
DG7
H6
DG13
DG3
DG4
O2
DG5
L108
A. Current practise This first step corresponds to the current approach, i.e. passive operation. In case of voltage limit violation due to the connection of DG, the network must be reinforced, also to avoid an automatic disconnection of the DG units because of overvoltage.
H7
DG2
DG1 H8
H4
P2
H3 O1
H10
H9
P1
H11 L88
110 kV grid
H2
H12 H13
B. Local voltage control In this approach, the OLTC is further controlled traditionally (fix set-point), but some selected generators and/or loads perform local voltage control with reactive and active power management.
H1
Fig. 3 Exemplary grid structure within the distribution grid of Energie AG OÖ Netz GmbH
1199
The first exemplary grid segment that was selected for detailed analysis with respect to technical and economical issues (compare [1] and [2]) as well as measures for an active grid management is shown in Fig 3. This network comprises about 200 nodes and represents a total demand of 9 MW. The nominal voltage is 30 kV. VII. ALGORITHM FOR COORDINATED VOLTAGE CONTROL As discussed in Section V, coordinated voltage control is the central technique used in the most sophisticated step within the step model. Here, local voltage control with DG units is operating together with centralized OLTC voltage control. This algorithm is designed to keep DG units ‘on line’ as long as possible (so that DG operators can gain maximum revenues for their generation). However, if voltage problems cannot be resolved by this algorithm, the local voltage protection switches will cut off the DG units from the network immediately. The algorithm will only rely on overvoltage protection devices as a fallback solution.
Fig. 4: Flow chart algorithm of coordinated voltage control.
To avoid unnecessary reactive power flow and power curtailment, a hierarchical concept is introduced as follows. The central control station is placed at the primary substation where the OLTC transformer is located. The central control unit collects measurement data from critical points in the network. Communication lines are required to transmit measured voltages from remote points. Depending on the chosen communication technology, a varying delay on these lines has to be expected. The control station determines the maximum and minimum voltage point in the net-
1200
work based on the incoming measurement data. According to maximum and minimum voltage, the OLTC transformer is set. In case of voltage conflict, e.g. when the tap change would cause voltage to exceed the limits, the OLTC is not able to solve the voltage problem. In this case local voltage control with DG is activated. Only DG units that allow for controlling the voltage are included into the coordinated control (DG4, DG5, DG10 and DG12 in the example network shown in Fig. 3). A ranking order of DG units is introduced for optimal operation (hierarchical system). DG units are ranked according to their voltage impact to each monitored point. First, reactive power management is used to control the voltage. In case reactive power management reaches its limits, voltage control with available active power is introduced. The flow chart algorithm of coordinated voltage control is presented in Fig. 4. When a voltage conflict appears and local control is activated, DG units get an input signal depending on the situation in the network. The ranking of the controllable DG units in the example network shown in Fig. 3 is presented in Tab. III. In the given example, there are no DG units available to control voltage at node L88 and L108 (see Fig. 3), therefore these nodes are not shown in Tab. 4. As undervoltage usually appears at node L88 and L108, no DG can help to increase the voltage. Therefore, two basic voltage conflicts can appear. (1) If maximum voltage exceed the upper voltage limit and low voltage point is near the low voltage limit (Fig. 5a), the DG units should control the voltage to be below the upper limit (Uset=Uup-lim). (2) If low voltage is below the low voltage limit and maximum voltage is near or exceeds the upper voltage limit (Fig. 5b), the DG units should reduce the maximum voltage to the point where OLTC control is able to change the tap position (Uset = Uup-lim–Utap) without causing any overvoltage or undervoltage. In case some DG units would be available to solve the undervoltage problem (e.g. DG units installed near node L88 or L108), then before reducing maximum voltage to the tap point, DG units near low voltage point try to increase the voltage with the reactive power injection. Tab. III DG unit ranking concept to control voltage at monitored points. Monitored points node
DG4
DG5
DG8
DG10
DG12
L4
Ranking of DG units
DG4 DG5 DG10
DG5 DG4 DG10
DG10 DG12
DG10 DG5 DG4
DG12 DG10
DG10
The following example outlines the usage of the DG ranking order shown in Tab. III. If the voltage at node DG4 exceeds the upper limit, first DG4 unit should try to reduce the voltage using reactive power management. When DG4 reaches the limits with the reactive power, DG5 should start
to absorb reactive power and help to reduce the voltage at node DG4. If units DG4 and DG5 reach the limits with the reactive power, DG10 is next to help. When all three units reach limits with reactive power and voltage at node DG4 is still outside the limit, first in a row (unit DG4) should reduce the active power, following units DG5 and DG10. In case if in the middle of procedure maximum voltage point jumps e.g. from node DG4 to node DG8, generation units DG4 and DG5 should continue to control the voltage at node DG4, while the unit DG10 should start to control the voltage at node DG8. When DG 10 reaches the limits with reactive power, DG12 should start to help to control the voltage with reactive power. When both DG units reach limits with reactive power, first DG 10 should reduce generation. If DG 10 reaches zero production and the voltage at node DG8 is still outside the limits, also DG12 should reduce the production and consequently reduce the voltage. U
Voltage at maximum voltage point
upper limit
Fig. 6 shows the voltage conditions for critical nodes in the network – nodes with the highest respectively lowest voltage in the network – for a winter workday (best case: typical maximum load conditions) and 50 % of DG. The boxplot shows 25 %, 50 % and 75 % values. For the first six nodes voltage is not between limits in 95 % of the day. It can be seen in Fig. 6 that the maximum voltage is located at the point where DG 4 is installed. The maximum voltage achieved on a workday in winter is around +5 % above the nominal voltage, which is outside the required limits. The maximum voltage in the whole year is around 1,06 p.u. and occurs on a summer Sunday (typical minimum load conditions). The voltage at the substation is around 1 p.u. It can be concluded that the passive approach of network operation leads to unsuitable power quality in the network for the given DG installation. As the HV/MV transformer is controlling the voltage at the substation, it does not perceive the voltage violations in other points in the network. Therefore the tap position stays unchanged. Voltage (pu)
95 % Voltages exceed upper limit
1.1 lower limit
1.08 1.06 (a)
(b)
1.04
Voltage at minimum voltage point
1.02 t
Fig. 5: Voltage conflicts – in situations (a) and (b), tap change operation is not possible. In this case, DG units are actively controlled.
As mentioned before, in case voltage problems cannot be resolved by the described hierarchy of measures, local voltage protection switches will cut off the DG units from the network before any real overvoltage condition can appear. VIII. SIMULATION RESULTS The approach of coordinated voltage control has been implemented in simulations by using the above mentioned example network. Due to design and operational restraints of the LV networks, the available voltage bandwidth in the MV level that can be explored with active network management in this particular grid segment is +3/–6 % of the rated voltage (30 kV). This bandwidth has been used in the simulations. If there would be no such restriction, wider bandwidth could be used for voltage control and more DG could be connected. The simulated base case includes additional DG installation, so that units in size of 50 % of the maximum load are present in the network (i.e. 4.5 MW). Passive approach for voltage control is used. The network voltage is controlled only with the Automatic Voltage Control (AVC) with OLTC, on HV/MV transformer. Tap-changer mechanism is on the HV side of the transformer.
1 0.98 0.96 0.94 0.92 Node 1-DG10 2-DG5 3-DG12 4-DG8 5-DG4 6-L4
7-L108 8-L88
9-UW
Fig. 6 Voltages at monitored (critical) points in the network – winter workday, base case, 50% of maximum load DG installed.
In contrast to the base case, DG units in size of 150 % of the maximum load in the network are installed in the coordinated control scenario. The coordinated voltage control algorithm is used to actively control the network. The voltage conditions for the worst case of a summer Sunday (typical minimum load condition) are depicted in Fig. 7. It can be seen that the 95 % voltage is successfully kept between the limits and therefore suitable power quality is provided to the customers. Within the coordinated voltage control approach also local control with DG units is included. To keep the voltage inside required limits reactive and active power management is used. Only power from DG4 has to be curtailed to keep the voltage between the limits. 12.7 % of the energy available from DG4 is lost on a summer Sunday. The amount of lost energy is 3.6 MWh on a summer Sunday. Other DG units did not have any reduction in energy production. The curtailed power from DG4 on a workday in winter is presented in Fig. 8.
1201
Voltage (pu)
IX. CONCLUSION AND OUTLOOK
1.1 1.08 1.06 1.04 1.02 1 0.98 0.96 0.94 0.92 Node 1-DG10 2-DG5 3-DG12 4-DG8 5-DG4 6-L4
7-L108 8-L88
9-UW
Fig. 7 Network voltage conditions – summer Sunday, coordinated voltage control, 150% of maximum load DG installed. Reactive power (MVAr) 2.5
DG4_control
2 1.5 1 0.5 0 -0.5
0 1 2 3 4 5 6 7 8 9 10 11 12 13 14 15 16 17 18 19 20 21 22 23 24 Time (h)
Active power (MW) 0 -0.5 -1 Ecur Pcur (MW) Pavail
-1.5 -2
A set of measures for tackling the problem of keeping the grid voltage within defined limits while increasing the amount of installed DG to more than 100% of the maximum load in the grid segment has been proposed (‘step model’). Due to the individuality of grid segments, results cannot be specified for a universal segment but only for exemplary situations. It can be concluded from simulations that with using the coordinated voltage control approach, more DG can be integrated into the network and still provide the customers with the required power quality. While the passively operated grid suffers from overvoltage conditions already at 50 % DG of maximum load, the coordinated voltage control approach is still able to keep voltages in the limits at 150 % installed DG of maximum load. Not presented in this paper is the economic assessment of the measures described in the step model. The general approach is to analyse costs of the currently installed grid assets under currently valid framing conditions and then subsequently analyse changes due to measures of the step model (such as new assets, DG feed-in curtailment, etc). For reaching the overall aim to identify economically and technically feasible solutions for the voltage regulation in active grid zones, the presented measures of the step model will be implemented and validated in different grid segments in an iterative process. These results will serve as a basis for future real-world demonstrations within existing distribution grids.
-2.5
0 1 2 3 4 5 6 7 8 9 10 11 12 13 14 15 16 17 18 19 20 21 22 23 24
X. REFERENCES
Time
Fig. 8 Reactive power flow and curtailed generation from DG 4 on a summer Sunday (load reference arrow system).
As it can be seen the curtailed energy is relatively small regarding to the total power exported from all DG units. The total amount of energy produced by DG units is around 200 MWh per day in case the installed DG power presents a 150 % of the maximum demand. Therefore only about 2 % of the energy is lost on a particular day. The simulated DG generation profile represents the case of maximum generation during the night (low load), which is unfavourable in terms of power curtailment. To be able to integrate more than 150 % of the maximum demand DG power into the example network, the network should be reinforced. Beside central voltage control with OLTC transformer and local voltage control with DG unit also demand side management (DSM) could be included into the coordinated voltage control. However, a priority order between local voltage control with DG unit and DSM should be introduced.
1202
[1]
[2]
[3] [4] [5] [6]
[7]
H. Brunner; B. Bletterie, A. Lugmaier: “Strategien für die Spannungsregelung in Verteilnetzen mit einem hohen Anteil an dezentralen Stromeinspeisern”, 5. International Energy Conference Vienna (IEWT 2007), Vienna, Austria, Feb. 2007, (to be published) A. Lugmaier, H. Brunner, W. Prüggler, L. Weissensteiner: “Aktiver Betrieb von elektrischen Verteilnetzen mit hohem Anteil dezentraler Stromerzeugung – Konzeption von Demonstrationsnetzen”, 5. International Energy Conference Vienna (IEWT 2007), Vienna, Austria, Feb. 2007, (to be published) N. Jenkins, R. Allan, P. Crossley, D. Kirschen, G. Strbac, “Embedded Generation”, The Institution of Electrical Engineers, ISBN 0 85296 774 8 Directive 2001/77/EC of the European parliament and council on the promotion of the electricity produced from renewable energy source in the internal electricity market Directive 2003/54/EC of the European parliament an the council concerning common rules for the internal market in electricity an repealing Directive 96/92/EC Leite H. F. D., “Modelling and real-time testing of an automatic local voltage controller to increase the amount of distributed generation”, PhD thesis, Department of Electrical Engineering and Electronics, UMIST, July 2004 Strbac G., Jenkins N., Hird C. M., “Integration of operation of embedded generation and distribution networks”, report on DTI project, April 2002