A Semi-automatic Approach for Segmentation of Three-Dimensional Microscopic Image Stacks of Cardiac Tissue Thomas Seidel1, Thomas Draebing1, Gunnar Seeman2, and Frank B. Sachse1,3,* 1
Nora Eccles Harrison Cardiovascular Research and Training Institute, University of Utah, Salt Lake City, UT 84112 2 Institute of Biomedical Engineering, Karlsruhe Institute of Technology Karlsruhe, Germany 3 Department of Bioengineering, University of Utah, Salt Lake City, UT 84112
[email protected]
Abstract. The segmentation of three-dimensional microscopic images of cardiac tissues provides important parameters for characterizing cardiac diseases and modeling of tissue function. Segmenting these images is, however, challenging. Currently only time-consuming manual approaches have been developed for this purpose. Here, we introduce an efficient approach for the semi-automatic segmentation (SAS) of cardiomyocytes and the extracellular space in image stacks obtained from confocal microscopy. The approach is based on a morphological watershed algorithm and iterative creation of watershed seed points on a distance map. Results of SAS were consistent with results from manual segmentation (Dice similarity coefficient: 90.8±2.6%). Cell volume was 4.6±6.5% higher in SAS cells, which mainly resulted from cell branches and membrane protrusions neglected by manual segmentation. We suggest that the novel approach constitutes an important tool for characterizing normal and diseased cardiac tissues. Furthermore, the approach is capable of providing crucial parameters for modeling of tissue structure and function. Keywords: cardiac tissue, confocal microscopy, segmentation, threedimensional, algorithm.
1 Introduction Pathological remodeling of cardiac tissue comprises changes in tissue microstructure, cell geometry and cellular proteins. Quantitative data on these changes can be obtained by three-dimensional (3D) segmentation of confocal microscopy images [1]. Segmentation yields information on the localization of cellular proteins and structures [2, 3] and important geometrical parameters for functional modeling. Current models of cardiac tissue are, however, often based on simplified geometries [4-8], whereas numerous studies have shown that cell geometry and spatial tissue composition are important for cardiac function [4-6]. A main reason for these simplifications is that *
Corresponding author.
S. Ourselin, D. Rueckert, and N. Smith (Eds.): FIMH 2013, LNCS 7945, pp. 300–307, 2013. © Springer-Verlag Berlin Heidelberg 2013
A Semi-automatic Approach for Segmentation
301
segmenting 3D microscopic images of cardiac tissue is still a tedious, time-consuming process. Previously, we used deformable surface meshes [1, 2]. The major drawback of this method is the extensive manual work needed for adapting meshes to cells, exacerbating the segmentation of whole image stacks. Few automatic or semiautomatic approaches for 3D cell segmentation have been published [9, 10], but to our knowledge none for microscopic images of cardiac tissues. Due to the high cell density, irregular cell shapes and pronounced tissue heterogeneity automatic segmentation of cardiac tissue is especially difficult. In particular, the surface staining of the transverse tubular system (t-system) in adult cardiomyocytes impedes the adoption of approaches useful for other tissue types, cell cultures or medical images. Here we present an efficient approach for segmenting 3D cardiac tissue images obtained from confocal microscopy. It consists of automatic generation of subcellular segments, followed by manual merging of segments belonging to one cell [11]. Using ITK software [12], implementing this method was straightforward. It allows for the segmentation of cardiomyocytes and the extracellular space of whole image stacks while manual processing time is substantially reduced. We evaluated our approach on images of rat ventricular tissues and by comparing it to manual segmentation.
2 Materials and Methods 2.1 Tissue Preparation and Confocal Imaging All use of animals was approved by the Institutional Animal Care and Use Committee (IACUC). Imaging protocols including tissue preparation, sectioning and fluorescent labeling were previously described [1]. In short, hearts of rats anesthetized with methoxyflurane were excised and immediately perfused with a zero calcium Tyrode’s solution using the retrograde Langendorff technique. Hearts were fixed in 2 % paraformaldehyde. Mid-myocardial sections with a thickness of 60-100 μm of ventricular biopsies were used for image acquisition. Extracellular space was labeled using wheat germ agglutinin (WGA) conjugated with Alexa Fluor 555 (Invitrogen). Afterwards, cell membranes were permeabilized with 0.5 % Triton-X, followed by blocking the tissue with Image-iTTM FX signal enhancer (Alexa Fluor 488 Goat Anti-Rabbit SFX Kit, Invitrogen). Connexin43 (Cx43) was immunolabeled with a rabbit anti-Cx43 antibody (Invitrogen) and a goat anti-rabbit IgG conjugated to Alexa Fluor 488 (Invitrogen). A Zeiss LSM 5 Duo confocal microscope was used for acquiring 3D image stacks using a 40× oil immersion lens with a numerical aperture of 1.3. Tissue specimens were mounted in glycerol. Voxel size was 0.2 μm in x-, y- and z-direction. 2.2 Image Processing and Segmentation Image Preprocessing. Raw image stacks were deconvolved by the Richardson-Lucy algorithm using measured point spread functions [1]. Subsequently, we corrected the depth-dependent signal attenuation assuming a mono-exponential decay of the average signal intensity I in z-direction (parallel to the laser beam):
I ( z ) = A exp(−τz ) + C
(1)
302
T. Seidel et al.
Parameters A, τ and C were fitted by minimizing squared errors using the LevenbergMarquardt algorithm [13]. To remove the background signal, we selected image regions with a signal intensity below 1024 and calculated the intensity histogram. After applying a Gaussian Filter, we identified the mode of the histogram with the background intensity and set the background intensity to 6.25 % (Fig. 1a). Manual Segmentation. Fifty-one manually segmented cardiomyocytes from 9 image stacks and 5 different animals were available in the database created in our recently published study [2]. The cells were segmented by interactive deformation of 3D surface meshes followed by dilation with the thresholded WGA signal as boundaries [1]. Semi-Automatic Segmentation. First, we segmented the preprocessed WGA and Cx43 images using histogram-based thresholds (Cx43 threshold: mode + 2 SD, WGA threshold: mode + 0.5 SD). We used ITK software (version 4.2.0, www.itk.org) [12] for all subsequent image processing steps. A median filter was applied to the binary Cx43 image (radius 1, 2 iterations). Subsequently a closing operator was used (radius 5). A union of the binary Cx43 image and the binary WGA image (Maximum Image Filter) yielded an image of the extracellular space. Further processing allowed us to remove the WGA signal associated with the t-system of the cardiomyocytes: Voting Binary Hole Filling Image Filter (radius 1, majority threshold 2, 10 iterations), Binary Opening By Reconstruction Image Filter (radius 3) and Binary Closing By Reconstruction Image Filter (radius 5) (Fig. 1b). For automatic segmentation, we applied a morphological watershed transform (Morphological Watershed From Markers Image Filter). It uses predefined seed points (labeled image regions), which expand along a gradient until they reach another label or the image boundary [14, 15]. We calculated the distance map of the processed extracellular space image (Signed Maurer Distance Map Image Filter). The inverted distance map served as gradient image. Watershed seeds (Fig. 1b) were iteratively created as follows: 1. Binary images of the distance map were stepwise created (Binary Threshold Image Filter). The starting threshold was the maximum distance (level 0), The threshold applied at level 1 equaled that of level 0 minus the step size, at level 2 minus twice the step size, etc., until the minimum distance of 0.25 µm (highest level) was reached. The step size ranged from 0.25 to 1 µm. 2. Regions in the level 0 binary image served as marker image for geodesic dilation on the level 1 binary image (Binary Reconstruction By Dilation Image Filter). We added those regions of level 1 to the regions of level 0, which were not reconstructed, i.e. not connected to regions on level 0. The resulting regions were in turn used as markers for geodesic dilation on level 2. This was repeated iteratively until the regions of highest level, i.e. of the minimum distance, were created. 3. The regions of highest level were labeled using connected component analysis (Connected Component Image Filter) and served as seeds for the morphological watershed algorithm.
A Semi-automatic Approach for Segmentation
303
b)
a)
b)
y
x
y
z
x
z
z z
c)
d)
y
x
y
z z
x
z z
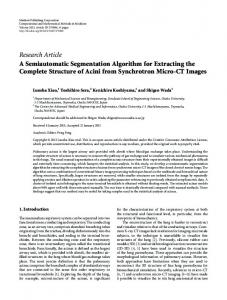
Fig. 1. Semi-automatic segmentation. (a) Cross-sections through image stack after deconvolution, background removal and attenuation correction. Green: WGA, red: Cx43. (b) Segmented extracellular space (yellow) and watershed seeds (cyan). (c) Segments generated by the watershed algorithm. Black: Extracellular space. (d) Segmented cardiomyocytes. Scale bar: 40 µm.
To reduce the number of seeds, we applied an opening operator (Opening By Reconstruction Image Filter, radius 1) to the seed regions on each level. Original seed regions were used as input for a refined segmentation. The subsequent manual step of the segmentation process comprised merging of segments belonging to the same cell and refinement of segments belonging to more than one cell using a graphical user interface. Finally, we calculated the volume of each segment (Label Geometry Image Filter). We applied a volume threshold to remove truncated. Comparison of Segmentation Results. Semi-automatically segmented cells were compared to manually segmented cells regarding total volume and overlap properties (Label Overlap Measures Image Filter). Dice similarity coefficients (s), positive (dp) and negative overlap deviations (dn), and volume deviation (dV) were calculated for the voxel sets A (semi-automatic) and M (manual) of each corresponding segmented cell pair:
304
T. Seidel et al.
s=2
A∩M A\M M\A A−M , dp = , dn = , dV = 2 A+M A M A+M
(2)
3 Results We applied the semi-automatic segmentation approach to 9 image stacks (≈1000×1000×200 voxels) from 5 animals. WGA reliably stained the extracellular space, but unstained regions at some cell surfaces were present in all images. After thresholding, these regions appeared as holes in the extracellular space between adjacent cells. Small holes showed low distances to the extracellular space and were, thus, reliably recognized as segment borders, i.e. the segments of adjacent cells met in the hole. Using step sizes between 0.25 and 1 µm, iterative creation of watershed seeds on the distance map resulted in ≥ 1 seeds per cardiomyocyte and ≈200-400 seeds per image stack. The step size corresponded to the minimum detectable difference between distance maximums in a hole and in adjacent cells. Accordingly, the higher the quality of WGA staining was, the bigger we chose the step size. Several seeds per cell were often created because of local distance maxima (Fig. 1c). Bigger step sizes as well as a higher degree of t-system removal in the extracellular space image reduced the number of seeds, but increased the incidence of segments overflowing cell borders. If overflow occurred, it was always resolved by segment refinement, taking into account smallest local distance maxima. The minimum distance used in the seed creation corresponded to the distance maximum in the smallest detectable volume. We used a minimum distance of 0.25 µm, which was sufficient to detect blood vessels, fibroblasts and small tissue gaps (not shown). Results of segment merging are presented in Fig. 1d. We compared 51 manually segmented cells with their semi-automatically segmented counterparts. Measures of similarity indicated that both methods produced consistent results (Table 1). Fig. 2 opposes segmentation results of a typical cell. Manual segmentation resulted in smoother cell surfaces, but left gaps to the extracellular space and neglected small membrane protrusions and branches (Figs. 2a, b and d). These were, however, included by semi-automatic segmentation (Figs. 2a, c and e). Accordingly, cell volume was smaller in manually versus semi-automatically segmented cells: 25,263 ± 10,607 µm³ versus 26,451 ± 11,299 µm³ (+4.6 ± 6.5 %), respectively. Fig. 3 presents a 3D visualization of cardiomyocytes from a completely segmented stack. Table 1. Statistical comparison of segmentation approaches
Measure Volume Deviation Dice Similarity Coefficient Negative Overlap Deviation Positive Overlap Deviation
Value (%) 4.3 ± 6.2 90.8 ± 2.6 7.1 ± 4.0 11.0 ± 3.5
A Semi-automatic Approach for Segmentation a)
b)
305 xzz
xz
d)
yzz c)
xz
e)
yzz
Fig. 2. Comparison of manuaal (MS) and semi-automatic segmentation (SAS). (a-c) XZ crrosssection through the cell. Scalle bars: 20 µm. (d-e) YZ cross-section. Scale bars: 10 µm.. (a) Green: SAS, red: MS, yellow:: overlap. (b-e) Green: WGA, red: MS (b, d) and SAS (c, d). Arrows indicate regions segmented more exactly by SAS.
Fig. 3. 3D D representation of segmented cardiomyocytes
Automatic image processsing required a calculation time of ≈ 1 h per stack onn an Apple Mac Pro, 12×2.93GH Hz, 32 GB RAM. Processing time for completely segmeenting one image stack was 5-10 h, compared to 1-2 weeks using manual segmentationn.
4 Discussion We introduced and evaluateed an integrated approach for segmenting myocytes and the extracellular space in 3D microscopic m images of cardiac tissue. The semi-autom matic method substantially reduceed processing time as compared to a previously developed manual method. This allowed us to fully segment whole image stacks (Fig. 3). Results
306
T. Seidel et al.
of both methods showed high consistency. The new method improved segmentation of small cell branches and membrane protrusions (Figs. 2b and d). Accordingly, cell volume was slightly higher than with manual segmentation and the positive overlap deviation was greater than the negative overlap deviation. Similar differences between manual and watershed segmentation were found in other studies [9]. The determined cell volume is in agreement with other studies on rat ventricular myocytes [2, 16]. Occasionally cell surfaces exhibited irregularities, which may be due to tiny volumes being left without a seed. Additional labeling, e.g. of fibroblasts or nuclei, could reduce these overflows. Choosing smaller distances for the highest seed level may also help, but increase the number of segments that have to be merged. Active contour algorithms may be useful for further refinement and surface smoothing [9]. Yet, it is known that membrane surfaces of cardiomyocytes show z-grooves, little notches of 0.3-0.4 µm depth at a distance of ≈ 2 µm [17]. These could be in part responsible for the grooved cell surfaces we obtained. Other segmentation algorithms, e.g. level set methods, have been shown to be less accurate even for the segmentation of regular-shaped cells [10]. Furthermore, they are computationally less efficient. The obtained micro-anatomical information on cells and tissue structure provides important input parameters needed to improve tissue models, for example to calculate the electrical conductance of the extracellular space [18] and to describe the spatial distribution of myofibroblasts in infarcted tissue [8]. We suggest that using additional fluorescent markers it will be possible to easily detect and segment cells of other types, e.g. fibroblasts and endothelial cells. Further labels will allow us to analyze the localization and distribution of intracellular and membrane proteins, e.g. ion channels. Since segmented image stacks facilitate various types of 3D analyses, the presented approach will also help to derive novel information on tissue micro-structure and its remodeling in disease. Acknowledgements. This work was supported by the Nora Eccles Treadwell Foundation and the National Institutes of Health (R01 HL094464).
References 1. Lasher, R.A., Hitchcock, R.W., Sachse, F.B.: Towards modeling of cardiac micro-structure with catheter-based confocal microscopy: a novel approach for dye delivery and tissue characterization. IEEE Trans. Med. Imaging 28, 1156–1164 (2009) 2. Lackey, D.P., Carruth, E.D., Lasher, R.A., Boenisch, J., Sachse, F.B., Hitchcock, R.W.: Three-dimensional modeling and quantitative analysis of gap junction distributions in cardiac tissue. Ann. Biomed. Eng. 39, 2683–2694 (2011) 3. Lin, E., Hung, V.H., Kashihara, H., Dan, P., Tibbits, G.F.: Distribution patterns of the Na+-Ca2+ exchanger and caveolin-3 in developing rabbit cardiomyocytes. Cell Calcium 45, 369–383 (2009) 4. Toure, A., Cabo, C.: Effect of heterogeneities in the cellular microstructure on propagation of the cardiac action potential. Med. Biol. Eng. Comput. 50, 813–825 (2012) 5. Spach, M.S., Barr, R.C.: Effects of cardiac microstructure on propagating electrical waveforms. Circ. Res. 86, E23–E28 (2000) 6. Seidel, T., Salameh, A., Dhein, S.: A simulation study of cellular hypertrophy and connexin lateralization in cardiac tissue. Biophys. J. 99, 2821–2830 (2010)
A Semi-automatic Approach for Segmentation
307
7. Cabo, C., Boyden, P.A.: Extracellular space attenuates the effect of gap junctional remodeling on wave propagation: a computational study. Biophys. J. 96, 3092–3101 (2009) 8. Baum, J.R., Long, B., Cabo, C., Duffy, H.S.: Myofibroblasts cause heterogeneous Cx43 reduction and are unlikely to be coupled to myocytes in the healing canine infarct. Am. J. Physiol. Heart. Circ. Physiol. 302, H790–H800 (2012) 9. Adiga, P.S.: Integrated approach for segmentation of 3-D confocal images of a tissue specimen. Microsc. Res. Tech. 54, 260–270 (2001) 10. Hodneland, E., Bukoreshtliev, N.V., Eichler, T.W., Tai, X.C., Gurke, S., Lundervold, A., Gerdes, H.H.: A unified framework for automated 3-d segmentation of surface-stained living cells and a comprehensive segmentation evaluation. IEEE Trans. Med. Imaging 28, 720–738 (2009) 11. Maes, F., Vandermeulen, D., Suetens, P., Marchal, G.: Computer-Aided Interactive Object Delineation Using an Intelligent Paintbrush Technique. In: Proceedings of the First International Conference on Computer Vision, Virtual Reality and Robotics in Medicine. Springer (1995) 12. Yoo, T.S., Ackerman, M.J., Lorensen, W.E., Schroeder, W., Chalana, V., Aylward, S., Metaxas, D., Whitaker, R.: Engineering and algorithm design for an image processing Api: A technical report on ITK–the Insight Toolkit. Stud. Health Technol. Inform. 85, 586–592 (2002) 13. Moré, J.: The Levenberg-Marquardt algorithm: Implementation and theory. In: Watson, G.A. (ed.) Numerical Analysis, vol. 630, pp. 105–116. Springer, Heidelberg (1978) 14. Baere, R., Lehmann, G.: The watershed transform in ITK - discussion and new developments. The Insight Journal (2006) 15. Soille, P.: Morphological image analysis: principles and applications. Springer, Berlin (2003) 16. Bassien-Capsa, V., Fouron, J.C., Comte, B., Chorvatova, A.: Structural, functional and metabolic remodeling of rat left ventricular myocytes in normal and in sodiumsupplemented pregnancy. Cardiovasc. Res. 69, 423–431 (2006) 17. Gorelik, J., Yang, L.Q., Zhang, Y., Lab, M., Korchev, Y., Harding, S.E.: A novel Z-groove index characterizing myocardial surface structure. Cardiovasc. Res. 72, 422–429 (2006) 18. Schwab, B.C., Seemann, G., Lasher, R.A., Torres, N.S., Wulfers, E.M., Arp, M., Carruth, E.D., Bridge, J.H., Sachse, F.B.: Quantitative Analysis of Cardiac Tissue Including Fibroblasts Using Three-Dimensional Confocal Microscopy and Image Reconstruction: Towards a Basis for Electrophysiological Modeling. IEEE Trans. Med. Imaging, (Jan 17, 2013) (epub.)