A Service-Oriented Approach to Implementing an Adaptive User Interface Emile Senga Supervisors: Prof. André Calitz and Prof. Jeàn Greyling
January 2010
Submitted in partial fulfilment of the requirements for the degree of Magister Commercii in the Faculty of Business and Economic Sciences at the Nelson Mandela Metropolitan University
Acknowledgements I would like to thank my supervisors, Prof. André Calitz and Prof. Jeàn Greyling, for their invaluable guidance and continuous support for the duration of this research. I wish to express my gratitude for the many hours that were spent reading through this document and the suggestions that were made to improve the content and structure. I would also like to thank them for their encouragement when problems felt insurmountable. I would also like to thank those that played a part in assisting me with the completion of this dissertation:
Mr Danie Venter, Senior lecturer and NMMU Research Statistician in the Department of Statistics for his help and advice.
Dr. Lester Cowley and Prof. Janet Wesson for their invaluable discussions that helped me understand the concepts and ideas with which I had to work.
Dr. Patrick Goldstone for assisting with the proof reading of this dissertation.
My friends Alyssa Viduya, Bradley van Tonder, Felix Ntawanga and Juan Meyer for their technical assistance and moral support.
My family and friends whose continued support and confidence helped me complete this work.
I would also like to thank the Department of Computing Sciences for enabling me to conduct my research through the resources they provided. I would especially like to thank Telkom and the NMMU Centre of Excellence programme for providing the necessary finance for this research.
Summary Service-oriented architectures (SOA) are being adopted by organisations in order to integrate disparate computational assets. A major hurdle they face is the decision on how to integrate the UI in an SOA. In addition, technological advances have allowed complex applications and complex user interfaces (UIs) to be realised and the increase in accessibility to computers enables a diverse population of users with different characteristics, preferences and needs to use these complex computer applications. Adaptive user interfaces (AUIs) have been proposed as a solution to cater for the differences in user traits by adapting the UI to meet the diverse needs of users. AUIs have, however, traditionally been developed using client/server architectures This research, therefore, set out to investigate how to develop an AUI using a service-oriented architecture (SOA). In order to successfully achieve the goal of this research, literature concerning SOAs was investigated to gain an understanding of SOAs. A literature review of AUIs was also undertaken to gain an understanding of AUIs. A model-based approach was used to develop a model for UI adaptation using knowledge gained in the literature reviews. The model generates different UIs depending on various users‘ inferred level of expertise. The model describes the interaction between AUI services that use design-time documents and run-time user-interaction to adapt the UI. A prototype of the model was implemented and evaluated using an evolution strategy devised to assess different aspects of the research. The evaluation strategy proved the following:
The service components of the prototype adhere to SOA design principles;
The implementation was effective based on software engineering metrics; and
The implementation was usable and did not negatively affect the performance of users.
The successful implementation of the prototype provides evidence that the design of AUIs using SOA is feasible. This dissertation therefore makes a contribution to the development of AUIs using SOAs. The model could be used to provide UI adaptation for business software applications. Keywords: Service-oriented architectures, adaptive user interfaces, web services user interfaces, user interface generation.
Table of Contents Acknowledgements ........................................................................................................................ i Summary ....................................................................................................................................... ii Table of Contents ......................................................................................................................... iii List of Figures .............................................................................................................................. ix List of Tables ............................................................................................................................... xii List of Abbreviations ................................................................................................................. xiii Chapter 1: Introduction ................................................................................................................1 1.1 Background ................................................................................................................................... 1 1.2 Previous research at NMMU ........................................................................................................ 3 1.3 Relevance of research ................................................................................................................... 4 1.4 Research outline............................................................................................................................ 5 1.4.1 Problem statement ........................................................................................................... 5 1.4.2 Thesis statement .............................................................................................................. 5 1.4.3 Research objectives ......................................................................................................... 5 1.4.4 Research questions .......................................................................................................... 6 1.4.5 Research method ............................................................................................................. 6 1.4.5.1 Literature review ................................................................................................ 7 1.4.5.2 Model design ...................................................................................................... 7 1.4.5.3 Prototype ............................................................................................................ 7 1.4.5.4 Evaluation .......................................................................................................... 7 1.4.6 Scope and constraints ...................................................................................................... 8 1.5 Dissertation structure .................................................................................................................... 9
Chapter 2: Service-Oriented Architecture ................................................................................11 2.1 Introduction ................................................................................................................................ 11 2.1.1 Enterprise architectures ................................................................................................. 12 2.1.2 Distributed architectures ................................................................................................ 13 2.2 Service-oriented architecture ...................................................................................................... 17 2.2.1 Definition of SOA ......................................................................................................... 20 2.2.2 Service orientation ......................................................................................................... 20 2.2.3 Principles for SOA Design ............................................................................................ 22 2.3 Components of SOA ................................................................................................................... 23
Table of Contents
2.3.1 Web services.................................................................................................................. 24 2.3.1.1 Task services .................................................................................................... 26 2.3.1.2 Entity services .................................................................................................. 27 2.3.1.3 Utility services ................................................................................................. 27 2.3.2 Web services architecture .............................................................................................. 28 2.3.2.1 Web service description language (WSDL) ..................................................... 30 2.3.2.2 Universal discovery description integration (UDDI) ...................................... 32 2.3.2.3 Simple object access protocol (SOAP) ............................................................ 32 2.4 Related standards ........................................................................................................................ 33 2.4.1 Rest web services .......................................................................................................... 33 2.4.2 Business process execution language ............................................................................ 35 2.5 SOA integration approaches ....................................................................................................... 36 2.6 Service-oriented applications...................................................................................................... 39 2.6.1 Cloud computing ........................................................................................................... 40 2.6.2 Software as a service ..................................................................................................... 41 2.7 Existing systems and related work.............................................................................................. 42 2.7.1 Web service user interface generation ........................................................................... 43 2.7.2 WSGUI .......................................................................................................................... 44 2.7.3 Servface ......................................................................................................................... 44 2.7.4 Web service user interface generation using XForms ................................................... 45 2.7.5 Mash-ups ....................................................................................................................... 46 2.8 Summary ..................................................................................................................................... 46
Chapter 3: Adaptive User Interfaces and User Expertise .......................................................48 3.1 Introduction ................................................................................................................................ 48 3.2 Adaptive user interfaces ............................................................................................................. 49 3.2.1 Definition of AUI .......................................................................................................... 50 3.2.2 Benefits of AUIs ............................................................................................................ 52 3.2.3 Functions of AUIs ......................................................................................................... 53 3.2.3.1 Interface adaptation .......................................................................................... 53 3.2.3.2 Task assistance and adaptive help .................................................................... 54 3.2.3.3 Recommender systems and information filtering ............................................ 54 3.2.3.4 Information presentation .................................................................................. 55 3.2.3.5 Adaptive learning ............................................................................................. 55
iv
Table of Contents
3.2.4 Approaches to AUIs ...................................................................................................... 55 3.2.4.1 Artificial intelligence approach ........................................................................ 56 3.2.4.2 User modelling approach ................................................................................. 56 3.2.5 Components of adaptivity.............................................................................................. 57 3.3 User expertise and user interfaces .............................................................................................. 64 3.3.1 Qualitative differences................................................................................................... 66 3.3.2 Quantitative differences................................................................................................. 67 3.4 Designing user interfaces for novice and expert users................................................................ 67 3.5 Related works ............................................................................................................................. 68 3.5.1 An IUI for contact centres ............................................................................................. 69 3.5.2 An AUI for contact centre agents .................................................................................. 70 3.5.2.1 Knowledge base ............................................................................................... 72 3.5.2.2 Analysis engine ................................................................................................ 74 3.5.2.3 Agent manager ................................................................................................. 76 3.5.2.4 Presentation manager ....................................................................................... 76 3.6 Adaptive user interface generation ............................................................................................. 77 3.7 Summary ..................................................................................................................................... 79
Chapter 4: Service-Oriented Analysis and Design ...................................................................81 4.1 Introduction ................................................................................................................................ 81 4.2 SO analysis and design ............................................................................................................... 81 4.3 Service-oriented analysis ............................................................................................................ 85 4.3.1 Define business requirements ........................................................................................ 85 4.3.2 Identification of automated systems .............................................................................. 87 4.4 Service-oriented design .............................................................................................................. 87 4.4.1 Composing an SOA ....................................................................................................... 87 4.4.2 Design of Business Services .......................................................................................... 88 4.4.2.1 Service specifications ....................................................................................... 88 4.4.3 Design of SO Business Processes.................................................................................. 90 4.5 Service realisation....................................................................................................................... 91 4.6 Service-oriented analysis of an AUI ........................................................................................... 92 4.6.1 AUI service identification ............................................................................................. 92 4.7 Service-oriented design of an AUI ............................................................................................. 95 4.7.1 AUI service specification .............................................................................................. 95
v
Table of Contents
4.7.1.1 Agent manager – Watcher ................................................................................ 96 4.7.1.2 Analysis engine ................................................................................................ 97 4.7.1.3 Presentation manager - Transformation ........................................................... 98 4.7.2 Proposed model ............................................................................................................. 99 4.7.3.1 User model ..................................................................................................... 100 4.7.3.2 Task model ..................................................................................................... 101 4.8 Service realisation..................................................................................................................... 102 4.9 Service interaction .................................................................................................................... 102 4.10 Summary ................................................................................................................................. 104
Chapter 5: Implementation ......................................................................................................105 5.1 Introduction .............................................................................................................................. 105 5.2 The implementation domain ..................................................................................................... 105 5.3 Implementation tools ................................................................................................................ 107 5.4 Knowledge base ........................................................................................................................ 109 5.5 Agent Manager - Watcher Service ........................................................................................... 110 5.6 Analysis Engine – Analysis Engine Service ............................................................................. 112 5.7 Presentation Manager – Transformation Service...................................................................... 113 5.7.1 XSLT ........................................................................................................................... 114 5.7.1.2 Novice XSLT ................................................................................................. 117 5.7.1.3 Expert XSLT .................................................................................................. 117 5.7.2 Object layout hierarchy ............................................................................................... 118 5.7.3 Element styles.............................................................................................................. 119 5.8 User interface interaction .......................................................................................................... 119 5.8.1 Technology for the UI ................................................................................................. 119 5.8.2 Querying web services from JavaScript ...................................................................... 120 5.8.3 Managing UI element dependencies ........................................................................... 120 5.8.4 Capturing user-interaction data ................................................................................... 120 5.9 Generated user interfaces .......................................................................................................... 121 5.9.1 Generated novice user interface .................................................................................. 122 5.9.2 Generated Expert User interface ................................................................................. 126 5.10 Pilot studies............................................................................................................................. 127 5.10.1 Pilot study 1: evaluation of generated user interface ................................................. 127 5.10.1.1 Participants ................................................................................................... 127
vi
Table of Contents
5.10.1.2 Procedure...................................................................................................... 128 5.10.1.3 Results .......................................................................................................... 128 5.10.2 Pilot study 2: formative evaluation of helpdesk AUI ................................................ 129 5.10.2.1 Participants ................................................................................................... 130 5.10.2.2 Procedure...................................................................................................... 131 5.10.2.3 Results .......................................................................................................... 131 5.11 Summary ................................................................................................................................. 132
Chapter 6: Evaluation and Results ..........................................................................................134 6.1 Introduction .............................................................................................................................. 134 6.2 Evaluation strategy ................................................................................................................... 135 6.2.1 Proof of concept .......................................................................................................... 135 6.2.2 Analytical evaluation ................................................................................................... 135 6.2.3 Software metrics evaluation ........................................................................................ 136 6.2.4 Usability evaluation ..................................................................................................... 137 6.3 Analytical evaluation ................................................................................................................ 138 6.4 Evaluation of software metrics ................................................................................................. 143 6.4.1 Coupling metrics ......................................................................................................... 143 6.4.2 Architectural design metrics ........................................................................................ 145 6.4.2.1 Structural complexity ..................................................................................... 146 6.4.2.2 Data complexity ............................................................................................. 146 6.4.2.3 System complexity ......................................................................................... 147 6.4.3 Summary of evaluation by software engineering metrics ........................................... 148 6.5 Usability evaluation of proof of concept .................................................................................. 148 6.5.1 Experimental design .................................................................................................... 149 6.5.2 Evaluation metrics ....................................................................................................... 149 6.5.3 Evaluation instruments ................................................................................................ 150 6.5.3.1 Location and Hardware .................................................................................. 150 6.5.3.2 Software ......................................................................................................... 150 6.5.3.3 Questionnaire ................................................................................................. 151 6.5.3.4 Task plan ........................................................................................................ 151 6.5.3.5 Statistics ......................................................................................................... 152 6.5.4 Evaluation procedure ................................................................................................... 152 6.5.5 Participant selection..................................................................................................... 153
vii
Table of Contents
6.5.6 Evaluation results ........................................................................................................ 155 6.5.6.1 Effectiveness .................................................................................................. 155 6.5.6.2 Efficiency ....................................................................................................... 157 6.5.7 Eye-tracking results ..................................................................................................... 159 6.6 Conclusions .............................................................................................................................. 161
Chapter 7: Conclusions and Recommendations .....................................................................164 7.1 Introduction .............................................................................................................................. 164 7.2 Research contributions.............................................................................................................. 164 7.2.1 Theoretical contributions ............................................................................................. 165 7.2.1.1 Literature review ............................................................................................ 165 7.2.1.2 Service-oriented analysis and design method ................................................ 167 7.2.1.3 AUI services model ........................................................................................ 168 7.2.2 Practical contributions ................................................................................................. 169 7.2.2.1 Development of a prototype as proof of concept ........................................... 170 7.2.2.2 Evaluation of the prototype ............................................................................ 170 7.3 Benefits of the research ............................................................................................................ 172 7.4 Limitations of the research ....................................................................................................... 172 7.5 Recommendations for future research ...................................................................................... 173 7.6 Summary ................................................................................................................................... 174
References ...................................................................................................................................175 Pilot Study Appendices..............................................................................................................187 Appendix A: Pilot Study 2 - Test Plan ........................................................................................... 187 Appendix B: Pilot Study 2 - Questionnaire .................................................................................... 188 Appendix C: Pilot Study 2 - Results .............................................................................................. 190
Main Study Appendices ............................................................................................................191 Appendix D: Preamble Letter ......................................................................................................... 191 Appendix E: Consent Form ............................................................................................................ 192 Appendix F: Demographics Questionnaire..................................................................................... 194 Appendix G: Test Plan.................................................................................................................... 195 Appendix H: Software Metric Data ................................................................................................ 198 Appendix I: Usability Evaluation Results ...................................................................................... 199 Appendix J: Code Snippets............................................................................................................. 200
viii
List of Figures Figure 1.1: Dissertation Structure ............................................................................................................... 10 Figure 2.1: The relationship between SOA and EA (Colab 2007).............................................................. 13 Figure 2.2: Fundamental CORBA architecture (Sommerville 2006) ......................................................... 16 Figure 2.3: Relationship between SOA, CBA and OOA (Wilkes 2004) .................................................... 18 Figure 2.4: Gartner Hype Cycle for Emerging Technologies (Carpenter 2009) ......................................... 19 Figure 2.5: SOA interaction model ............................................................................................................. 24 Figure 2.6: Orchestration (left) vs. Choreography (right) ........................................................................... 25 Figure 2.7: Service Abstraction Layers (Erl 2008) ..................................................................................... 26 Figure 2.8: A purchase order application invoking services (Papazoglou 2006) ........................................ 27 Figure 2.9: Web Services protocol stack (Lewis and Wrage 2006) ............................................................ 29 Figure 2.10: SOAP, WSDL and UDDI interaction (Laliwala 2007) .......................................................... 30 Figure 2.11: An Example of a WSDL document (Papazoglou 2006)......................................................... 31 Figure 2.12: An example of a SOAP request message ............................................................................... 33 Figure 2.13: SOA Integration approaches, ESB (A) and Point-to-Point (B) .............................................. 37 Figure 2.14: Logical SOA reference architecture ....................................................................................... 38 Figure 2.15: WSGUI Model........................................................................................................................ 44 Figure 2.16: Servface model (Servface 2008)............................................................................................. 45 Figure 3.1: Evolution of user interface design (López-Jaquero et al. 2004) ............................................... 49 Figure 3.2: Multidisciplinary research areas in IUI (Alvarez-Cortes et al. 2007) ...................................... 50 Figure 3.3: Office 2003 smart menu system (A), font selector (B). Fisheye lens Menu (C) ...................... 54 Figure 3.4: Brusilovsky‘s (1996) loop for ―user modelling adaptation‖ in adaptive systems .................... 57 Figure 3.5: General Schema for processing an AUI (Jameson 2003) ......................................................... 58 Figure 3.6: Dimensions on which users experience differ (Nielsen 1993) ................................................. 65 Figure 3.7: The Spectrum of Users‘ Needs (Padilla 2003) ......................................................................... 68 Figure 3.8: Layered user interface: Layer 1(A) and Layer 2(A) (Shneiderman 2003) ............................... 68 Figure 3.9: IUI Model for Contact Centres (Singh 2007) ........................................................................... 70 Figure 3.10: An AUI Model for Contact Centre Agents (Jason 2008) ....................................................... 71 Figure 3.11: Potential Predictive Features .................................................................................................. 73
List of Figures
Figure 3.12: Informative Moments and the Corresponding Logging Steps (Jason 2008) .......................... 74 Figure 3.13: Automatically rendered interface for five different platforms (Gajos 2008) .......................... 78 Figure 4.1: Erl‘s (2005) service-oriented analysis process (A) and Arsanjani‘s (2004) SOMA (B) .......... 84 Figure 4.2: Service-oriented analysis (Erl 2005) ........................................................................................ 85 Figure 4.3: Bottom up strategy (Erl 2005) .................................................................................................. 86 Figure 4.4: SO Design steps (Erl 2005) ...................................................................................................... 87 Figure 4.5: Service Specification Framework (Terlouw and Maarse 2009) ............................................... 90 Figure 4.6: Encapsulating parts of a process as a service (Erl 2005) .......................................................... 93 Figure 4.7: The components of adaptivity .................................................................................................. 93 Figure 4.8: Proposed Model ........................................................................................................................ 99 Figure 4.9: User Model Schema ............................................................................................................... 100 Figure 4.10: Extract of Task Model Schema ............................................................................................ 101 Figure 4.11: AUI components and Call Logging processes sequence diagram ........................................ 103 Figure 5.1: JavaScript Object showing the 9 Predictive Features (PF) for Informative Moments (IM) ... 111 Figure 5.2: UpdateUserModel Class for updating the IM data in the User Model ................................... 112 Figure 5.3: The Analyse Skill class for the Analysis Engine Service ....................................................... 113 Figure 5.4: The relationships between the elements of a WSDL Document (Burr 2006) ........................ 115 Figure 5.5: Creating User Interface Controls from XML elements .......................................................... 116 Figure 5.6: Example of the application of the layout groups to the Novice Step 1 .................................. 118 Figure 5.7: Task Analysis for Logging a Call ........................................................................................... 122 Figure 5.8: Novice UI – Step 1 ................................................................................................................. 123 Figure 5.9: Novice UI – Step 2 ................................................................................................................. 124 Figure 5.10: Novice UI – Step 3 ............................................................................................................... 125 Figure 5.11: Novice UI – Step 4 ............................................................................................................... 125 Figure 5.12: Expert UI – Steps 1 to 4 ....................................................................................................... 126 Figure 5.13: Summary of user testing results (n=10)................................................................................ 129 Figure 5.14: Pilot study Gender (A), Age (B), Occupation (C) and Computer Experience (D) (n=6) ..... 130 Figure 5.15: Pilot study post test questionnaire results (n=6) ................................................................... 132 Figure 6.1: Visualisation of Analytical Evaluation ................................................................................... 142 Figure 6.2: Formula for DCSS .................................................................................................................. 144 Figure 6.3: AUI Services Graph and Matrix ............................................................................................. 144
x
List of Figures
Figure 6.4: Structural complexity formula ................................................................................................ 146 Figure 6.5: Data complexity formulae ...................................................................................................... 146 Figure 6.6: System complexity formula .................................................................................................... 147 Figure 6.7: Relative System Complexity .................................................................................................. 148 Figure 6.8: Demographic profile of test participants (n = 30) .................................................................. 154 Figure 6.9: Stacked bar chart showing levels of success .......................................................................... 156 Figure 6.10: Mean Timer per task (sec) .................................................................................................... 158 Figure 6.11: Efficiency as Completion Rate/Time. .................................................................................. 158 Figure 6.12: AOI for Novice Steps ........................................................................................................... 159 Figure 6.13: Heat map showing fixations for step one to four of Call Logging task (n=30) .................... 160 Figure 6.14: Fixation count of AOIs ......................................................................................................... 161 Figure 7.1: AUI services model ................................................................................................................ 169
xi
List of Tables
List of Tables Table 1.1: Research Questions and Methodology ........................................................................................ 6 Table 2.1: RPC method (Left) REST URI (right) ....................................................................................... 34 Table 2.2: When to use REST or SOAP-RPC web services (Mulik 2007) ................................................ 34 Table 3.1: A Comparison between Adaptive and Adaptable Systems (Fischer 2001) ............................... 51 Table 3.2: Differences between the Novice and Expert‘s ways of ―thinking‖ ........................................... 66 Table 3.3: Summary of Predictive Features ................................................................................................ 73 Table 3.4: Predictive Features and their associated weights (Jason2008) .................................................. 75 Table 3.5: Informative Moments and Associated Weights (Jason 2008) ................................................... 76 Table 4.1: Comparison of SOA Development Methods (Ramollari et al. 2007) ........................................ 83 Table 4.2: Identified Services ..................................................................................................................... 94 Table 4.3: Common Service Specification Information for all services ..................................................... 96 Table 4.4: Watcher Service Specification ................................................................................................... 96 Table 4.5: Analysis Engine Service Specification ...................................................................................... 98 Table 4.6: Transformation Service Specification........................................................................................ 99 Table 5.1: Windows Server 2008 Server Specification ............................................................................ 108 Table 5.2: XML Simple Data- Type to XHTML Control Mapping (Song and Lee 2007) ....................... 116 Table 5.3: User Testing Questionnaire (Song and Lee 2008) ................................................................... 127 Table 6.1: SOA Design Guidelines and how to measure them ................................................................. 139 Table 6.2: Summary of analytical evaluation ........................................................................................... 142 Table 6.3: Summary of Architectural Design Metrics for AUI services .................................................. 147 Table 6.4: Evaluation procedure ............................................................................................................... 153 Table 6.5: Summary of the results of the evaluation ................................................................................ 162 Table 7.1: Research Questions and Methodology .................................................................................... 165
xii
List of Abbreviations
List of Abbreviations AUI
Adaptive User Interface
BPEL
Business Process Execution Language
CORBA
Common Object Request Broker Architecture
DCE
Distributed Computing Environment
DCOM
Distributed component object model
DOM
Document object model
EAI
Enterprise application integration
ESB
Enterprise service bus
GUIDD
Graphical User Interface Deployment Description
KLM
Keystroke Level Model
OASIS
Organization for the Advancement of Structured Information Standards
OMG
Object Management Group
ORB
Object request broker
REST
Representational State Transfer
RIA
Rich Internet Application
RPC
Remote Procedure Call
SaaS
Software as a Service
SOA
Service-Oriented Architecture
SOAP
Simple Object Access Protocol
SOADM
Service-Oriented Analysis and Design Method
SOMA
Service Oriented Modelling Architecture
UDDI
Universal description, discovery, and integration
UML
Unified Modelling Language
URI
Uniform resource identifier
WS
Web services
WSDL
Web Services Description Language
XML
Extensible Mark-up Language
XSLT
Extensible Stylesheet Language Transformation
xiii
Chapter 1: Introduction 1.1 Background The advancement of computing technology has allowed organisations to store and manage an ever-growing quantity of data and information. Managing such a large amount of information requires a range of computing assets and applications in order to effectively support and optimise a large number of operations. Today‘s dynamic and collaborative business environment requires efficient access to information and enterprise applications, regardless of the underlying architecture, platform or location of the information and applications. Since the turn of the decade, as a result of the need for speed and agility in business, integrating computing assets using the agile and flexible enterprise architecture known as service-oriented architecture (SOA) has significantly increased. SOA is seen as a solution to overcome access to computing assets such as applications and data deployed on heterogeneous platforms (Menge 2007; Erl 2008). It is an architectural style and design paradigm that advocates the development of computing systems as discrete pieces of functionality that are agnostic, and defined using abstract terms in order to make them as loosely coupled as possible (OASIS 2006; Papazoglou 2006; Josuttis 2007; Shen 2007; Erl 2008). Loosely coupled components fit together and exchange information with minimal changes to themselves or other components with which they interact. Any organisation using SOA gains significant benefits, such as the ability to re-use application functionality, the ability to access heterogeneous or legacy applications and the ability to create composite applications in a relatively short space of time (Erl 2008). Composite applications are applications created at run time by combining pre-existing components with specific functionalities to create a new application. Web services are currently the most popular enabler of SOA. They are the loosely coupled, discrete functionalities through which SOA can be realised. Web services provide a set of standards used to define how they interact with each other and with other applications (OASIS
Introduction
2006). The adherence to strict, platform-independent standards is a major factor in the popularity of web services as an enabler for SOA. Theoretically, achieving such levels of integration is possible. In practice, however, it is challenging to achieve all the benefits of SOA. Establishing the right user interface (UI) through which end-users can be able to access data and information in a service-oriented environment is one of the significant challenges of SOA (Tibco 2006). Various approaches to providing a UI to web services exist. Desktop applications, for example, provide rich UIs with which end-users can interact and access the functionality of web services (Ellinger 2007; Papazoglou, Aiello and Giorgini 2004; Josuttis 2007; Lawler and Howell-Barber 2007). However, they are expensive to develop, and costs are incurred if business requirements for the application change. Additionally, by their very nature, desktop applications are developed for specific platforms and may not function on other platforms (Tibco 2006). Web-based solutions have also been proposed as a method of providing the UI of web services. Web-based solutions provide benefits such as little or no installation on client devices, thus reducing the cost of maintenance, upgrades or changes to the UI (Tibco 2006). In the past, these solutions have lacked the interactivity and responsiveness of the desktop applications; and most existing web based solutions were not flexible enough to take advantage of the flexibility and agility of SOA. Recently, however, advancements in web technologies have allowed more responsive and complex applications to be built by using web based technologies. In addition, a second, more subtle challenge to the integration of applications is the increasing disparity between end-users and computer applications‘ ability to cater for the individual characteristics of these end-users. The differences in needs, preferences and the abilities of endusers mean that not all users interact with computer applications in the same way. Adaptive user interfaces (AUIs) have been proposed as a solution to this problem (Dieterich et al. 1993; Hook 2000; Jameson 2003). AUIs personalise the UI to suite the individual user, and thus allow them to use the interface more effectively. Various AUI models exist and they describe how an AUI can be implemented to cater for the different characteristics of users (Jason 2008). For example, Adaptive HelpDesk is an implementation of an AUI model designed to cater for novice and expert contact centre agents
2
Introduction
(Jason 2008). Adaptive HelpDesk (as well as other existing models) is, however, based on a client/server architecture. This architecture splits the client and server applications into logical and physical application components.
Implementing Adaptive HelpDesk in a distributed
environment would provide its functionality over the network, allowing the re-use and enterprise access to its functionality. Current SOA models and standards do not address the use of AUIs in SOA (Papazoglou, Aiello and Giorgini 2004; Cañas et al. 2007; Josuttis 2007; Lawler and Howell-Barber 2007; Erl 2008), mostly because SOA is seen as a business architecture which focuses on business service and data requirements (Cañas et al. 2007). The benefits of SOA and AUIs can be achieved if an AUI is provided, using the principles advocated by SOA (Erl 2005; Tibco 2006). Although evidence has been found of increasing interest in UIs for Web Services and SOA (Kassoff, Kato and Mohsin 2003; Ellinger 2007; He and Yen 2007; Song and Lee 2007; Spillner, Braun, and Schill 2007; Nestler 2008), little evidence has been found addressing AUIs in SOAs (Davies 2006). This study aims to examine how an AUI can be implemented by using SOA. The increase in research in UIs for SOA means that a growing number of end-users will be accessing service functionality by using UIs from such research. However, little attention is being given to differences that these end-users exhibit. The main objective of this study is therefore to gain knowledge of SOAs and AUIs and to develop an AUI services model using service-oriented (SO) analysis and design methods. This model will be implemented and evaluated to determine whether it adheres to SOA principles (Erl 2008), whether it can be implemented effectively and to determine whether the UI from this process allows end-users in high information environments to complete their tasks.
1.2 Previous research at NMMU High-information environments use multiple systems to provide access to data and applications. In contact centres, agents require access to several systems to perform the task of resolving a customer query (Singh 2007). Furthermore, contact centre agents (CCA) may require increased training to learn to use the CC applications. Both of these problems have been addressed by research at the Nelson Mandela Metropolitan University‘s Department of Computing Sciences (Singh 2007; Jason 2008). An IUI was
3
Introduction
developed to integrate information from various sources to facilitate the Call Logging task and an AUI was developed to increase the performance of novice CCAs by providing an effective design for novice CCAs and incorporating adaptation once their skill levels changed to experts. In such an environment, SOA can be used to integrate the disparate systems and provide the contact centre agent in charge of resolving queries with a unified application through which to resolve customer queries. Not only would this provide the agent with a consolidated access to information, it would also allow new applications to be created to facilitate interaction with the customer and, ultimately, increase customer satisfaction.
1.3 Relevance of research Applications that are created by combining pre-existing components are known as composite applications. Interaction with composite applications currently requires the development of a UI. Research into web service UIs shows that service-based UIs do not need the UI designed beforehand. Descriptions of the web services interactions and layout models can be used to dynamically create a UI instead, thus saving in UI development costs. Furthermore, maintenance costs are reduced because only the web services need to be maintained and not an entire application. Web services provide specific functionality within a limited scope, which facilitates maintenance, upgrades and changes due to the lack of overlap in functionality. Previous research efforts provide empirical evidence that AUIs can increase productivity in information-intensive environments such as contact centres (Singh 2007). Empirical evidence also suggests that models can be applied that improve the expertise level of contact centre agents who work in high-information environments (Jason 2008). AUIs comprise various components that work together in the adaptation process to model users and provide meaningful adaptations. The use of AUI components as services means they can be made reusable across various platforms. Furthermore, the components can be interchanged for different ones, for example different user modelling techniques can be used for different users or scenarios by simply using a service that provides that particular functionality.
4
Introduction
1.4 Research outline This section will discuss the research outline in terms of the problem statement (Section 1.4.1), thesis statement (Section 1.4.2), research objectives (Section 1.4.3), research questions (Section 1.4.4), research methods (Section 1.4.5) and scope and constraints (Section 1.4.6) used in this research.
1.4.1 Problem statement The main objective in this research is to develop an AUI services model and an AUI prototype for end-users using an SOA. The domain of the AUI is contact centres (CC) and the model used to develop the AUI must accommodate users with novice and expert skill levels. The AUI must be implemented in a distributed environment with its components accessible as web services.
1.4.2 Thesis statement The aim of this research is to establish how an AUI can be designed and implemented effectively by using SOA to cater for novice and expert end-users. The thesis statement that guides this research in achieving its goals (Hofstee 2006) is therefore: An adaptive user interface can be designed and implemented using service-oriented architecture principles. The thesis statement is broken down into its separate constituents, and research objectives are derived from them. These objectives are listed in the following section.
1.4.3 Research objectives In order to research the thesis statement, this research study seeks to achieve the following objectives:
To gain comprehensive understanding of SOA and its enabling technology – Web Services (Chapter 2).
To understand AUIs and their components (Chapter 3).
5
Introduction
To understand user expertise and the implications it has on user interface design (Chapter 3).
To determine how an AUI can be designed using an SOA (Chapter 4). To determine how an AUI can be implemented using an SOA (Chapter 5). To evaluate the SO design and implementation of an AUI (Chapter 6). These objectives can be achieved by answering the research questions formulated in the following sub-section.
1.4.4 Research questions The primary research question for this project is: How effectively can an adaptive user interface be implemented in a service-oriented architecture at the service level to provide usable adaptation for novice and expert users? In order to address the primary research question, several research questions must also be answered. The research questions in Table 1.1 were formulated to achieve the research objectives. Table 1.1: Research Questions and Methodology
Research Questions R1 What is SOA and what are its components? What are AUIs and what are the components of an R2 AUI? R3 How can an AUI be designed using an SOA? R4 How can an AUI be implemented using an SOA? R5 Does the prototype adhere to SOA design principles? How effectively can an AUI be implemented in an R6 SOA? R7 What is the usability of the generated user interface?
Research Methods
Chapter Chapter 2
Literature Study
Chapter 3
Service-Oriented Analysis and Chapter 4 Design Develop a prototype as Proof Chapter 5 of Concept. &6 Evaluation
Chapter 6
1.4.5 Research method This research will make use of the research method outlined in the following sub-sections to achieve the objectives described in Section 1.4.3 and answer the research questions R1 to R7 outlined in Section 1.4.4.
6
Introduction
1.4.5.1 Literature review The goal of this research is to implement an AUI using an SOA. In order to achieve this goal, an understanding of both concepts is required as well as the components required of each in order to realise them. A literature review on SOA is conducted to understand what SOA is and to establish what the components of SOA are (R1). The literature review on AUIs is conducted to understand what AUIs are and to explore the components of AUIs (R2).
1.4.5.2 Model design In order to implement an AUI using an SOA, previous research is consulted to establish existing models. These are defined as models. As such, a model is designed for this project as it provides specifications by which a prototype can be implemented (R3).
1.4.5.3 Prototype Prototypes provide a means to evaluate a design or alternatively they can be developed as a proof of concept. The design and implementation of a prototype to demonstrate how an AUI can be implemented by using an SOA is necessary. A prototyping approach is therefore taken in the development of the AUI (R4). From the model design of R3, prototypes will be implemented and evaluated.
1.4.5.4 Evaluation Simply implementing a prototype as a proof of concept is insufficient. The prototype must be evaluated to determine if it has achieved the goals set out for it in this research. As seen in Table 1.1, the prototype must prove the following:
Whether the prototype adheres to SOA design principles (R5);
Whether an AUI can be implemented effectively by using SOA (R6); and
Whether the final UI created is indeed usable (R7).
To answer these questions an evaluation strategy must be devised which allows this research to answer these questions. Pilot studies are used to uncover problems with prototypes and a main
7
Introduction
study is conducted to answer R5, R6 and R7. The main study entails an analytical evaluation, software engineering metric evaluation and usability evaluation of the prototype.
1.4.6 Scope and constraints The scope of this research is limited to investigating how an AUI can be implemented using an SOA. The scenario in which the AUI is implemented is a contact centre. The domain restrictions are outlined below:
The domain is limited to the logging of customer queries of the NMMU ICT Service Desk. Existing research on AUIs from the NMMU Computer Science department (Singh 2007, Jason 2008) is limited to this domain;
The UI skill levels considered in this study range from novice to expert only (as opposed to novice, intermediate and expert), because the UI skill of CCAs changes from novice to expert quickly;
Work on the effectiveness of design for novices and experts exists (Jason 2008) and has been proven statistically. Therefore, this study does not need to focus on the actual design of the UIs; and
The requirements of the implemented prototype are limited to performing the following functions using web services: o Capturing user-interaction data; o Performing inferences using the captured user-interaction data; and o Generating the UI (Novice or Expert).
SOA is an implementation-agnostic paradigm which can be realised on any platform (Erl 2005; Papazoglou 2006). At present, the dominant technology to realise SOA is web services. Different types of web services exist to serve different functions. For example data services, composed services and communication services may be used in an application for data management, orchestration or communication (Erl 2008). This research focuses on service-orientation by way of web services. Discussions of web services are also strictly confined to the context of SOA.
8
Introduction
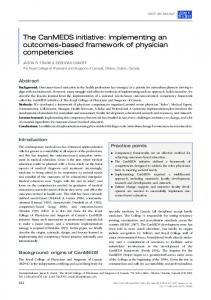
1.5 Dissertation structure This chapter has presented a brief introduction to SOAs and AUIs. It poses the question whether an AUI can be implemented by using an SOA. Using the thesis statement, a set of objectives has been devised to guide this research. This dissertation is comprised of eight chapters, each of which aims to achieve a research objective as outlined in Section 1.4.3. Figure 1.1 provides an illustration of the dissertation outline and how the different chapters relate to each other. This section gives a brief synopsis of each chapter. Chapter 2 (Service-Oriented Architectures) provides a background on the service-oriented architecture paradigm and its most basic component. SOA design guidelines are presented and the standards which enable web services, such as WSDL, UDDI and SOAP are investigated. Several research projects on web services UIs are also discussed. Chapter 3 (Adaptive User Interfaces and User Expertise) discusses AUIs by first defining AUIs and investigating methods and techniques for realising AUIs. The components of an AUI are investigated and novice and expert user differences as well as their implications for the design of UIs are discussed. Various research projects in AUIs are investigated including Adaptive HelpDesk and UI generation as a means of adapting the UI. Chapter 4 (Service-Oriented Analysis and Design) discusses service-oriented (SO) analysis and design methods. This proposes a hybrid approach by using two SO analysis and design methods. In this chapter, the hybrid method is applied to existing AUIs and the outcome is an AUI services model. Chapter 5 (Implementation) discusses the implementation a proof of concept prototype based on the model developed in Chapter 4. The implementation of the architecture, AUI components, and services are described and results from the pilot studies are also presented. Chapter 6 (Evaluation and results) presents the evaluation and results of the prototype developed in Chapter 5. This chapter discusses a three-stage evaluation. The evaluation attempts to firstly determine if the prototype adheres to SOA design principles, by performing an analytical evaluation of the prototype. Secondly, the implementation of the prototype is evaluated based on software engineering metrics. Finally, user testing evaluates the effect that the prototype UI has
9
Introduction
on the performance of novice contact centre agents. The results of the evaluations are also presented and discussed. Chapter 7 (Conclusions and Recommendations) concludes this research. Conclusions drawn from this research are discussed in this chapter. The chapter verifies that the outlined objectives were achieved and presents ideas for future research.
Chapter 2 Chapter 5
Service-Oriented Architectures
Chapter 1 Introduction
Implementation
Chapter 4 Service-Oriented Analysis and Design
Chapter 6 Evaluation
Chapter 3
Chapter 7
Adaptive User Interfaces
Conclusion
Figure 1.1: Dissertation Structure
10
Chapter 2: Service-Oriented Architecture 2.1 Introduction The advancement of computing technology has allowed organisations to store and manage an increasing quantity of data and information. Managing such a large amount of information requires a range of computing assets in order to effectively support and optimise all operations. The service-oriented architecture (SOA) comprises an architectural style and design paradigm that advocates the integration of disparate system by using independent, self-contained and agnostic web services (Arsanjani 2004; Josuttis 2007; Erl 2008). SOA evolved from the use of distributed objects (Trenman 2005). Design principles and guidelines for loosely coupled components which enabled the composition of new applications by using services thus became the cornerstone of SOA (Erl 2008). Loosely coupled components facilitate the re-use of computational assets that exist within an organisation. The re-use of computational assets leverages existing and legacy operational assets, which in turn increases the return on investment of these assets (Schmetzer and Bloomberg 2004; Haddad 2005; Erl 2008). The objective of this chapter is to gain a comprehensive understanding of SOA, and its enabling technology: Web Services. In order to achieve this objective research question R1: What is SOA and what are its components? will be answered.
The following will therefore be discussed. A brief introduction to Enterprise Architectures (EA) (Section 2.1.1) and Distributed Architectures (Section 2.1.2) is given to illustrate the nature of SOA as an enterprise spanning distributed architecture. A discussion on SOA is given (Section 2.2) to provide a definition for SOA and to highlight the principles that SOA advocates. The components of SOA are discussed (Section 2.3), along with a detailed discussion on web services, and the specifications, standards and protocols used by web services. Related standards used to create SOA applications are also discussed (Section 2.4) and two popular integration approaches are compared (Section 2.5). SOA application examples are provided to illustrate how SOA concepts are applied in different domains (Section 2.6). Finally,
Service-Oriented Architecture
related work in user interfaces (UIs) for SOA are discussed to highlight existing research on how to provide UIs using SOA (Section 2.7).
2.1.1 Enterprise architectures The advent of computerised automated solutions has made the use of technology architectures necessary when defining the abstract interactions of the components of these solutions (Erl 2008). Today, any organisation with a technological infrastructure has at some point defined an enterprise architecture (EA) for the organisation. This technological infrastructure is dependent on the enterprise‘s information needs and the specific context (Johnson et al. 2004). EA outlines how the business processes and technological infrastructure are integrated and how that reflects the organisations operating model (Weill 2007). The focus of EAs is therefore on processes, objectives and organisational structures (Kohlmann 2007) while the focus of SOA is on serviceorientation. Business-level processes and services views are not accessible when subsequently looking at low-level enterprise building blocks as a result (Zimmermann, Krogdahl and Gee 2004). While EA defines organisational components, SOA defines the informational, application, technical, implementational, operational and business architecture (Colab 2007). SOA is an architectural style and therefore exists as a separate layer of abstraction below the EA (Colab 2007; Erl 2008). Figure 2.1 illustrates the relationship between SOA and EA. Both SOA and EA have an enterprise wide scope. However, SOA defines the more specific aspects of an organisation (Knippel 2005; Colab 2007). The aspects of an organisation that SOA defines are the services. Services are capabilities that provide functionality in a limited scope. Section 2.3.1 discusses services within the context of SOA. In Figure 2.1 this is the Line of Business (LOB). EA frameworks define the tools, processes and guidelines in the development of specific enterprise architectures (Opengroup 2003; Winter and Fischer 2006). The majority of EA frameworks advocate four viewpoints in the development of the architecture: the business architecture, the application architecture, the information or data architecture and the technology architecture (Winter and Fischer 2006).
12
Service-Oriented Architecture
Figure 2.1: The relationship between SOA and EA (Colab 2007)
Enterprise architectures can be comprised of several layers because of the complexity associated with integrating organisational units (Knippel 2005). Distributed architectures facilitate the integration of these layers and are discussed further below.
2.1.2 Distributed architectures SOA is by its very nature a distributed architecture (Sommerville 2006; Li and Wu 2009). It allows diverse applications running as services on different platforms to interact and create meaningful applications. Distributed architectures separate the information-processing functions of a system across multiple servers. Distributed system architectures provide several advantages over conventional forms of computing (Sommerville 2006): 1. Open architecture: Distributed systems are usually designed around open protocols, making it easy to add new resources written in the most suitable language (for the application, the process or the developers preferred language) to the application; 2. Flexibility and Scalability: Open architectural designs allow distributed systems to easily scale, but maintain the flexibility to change in order to meet business requirements; 3. Adaptability: Dynamic reconfiguration of the system is made possible, and applications can adapt to the operating environment by binding with different services;
13
Service-Oriented Architecture
4. Resource Sharing: Organisational and inter-organisational assets are made accessible to a wider range of users and applications; 5. Concurrency: In distributed environments, processes may operate at the same time but on separate machines. These may need to communicate and exchange data; and 6. Fault tolerance: The availability of multiple computational units and services which are
loosely coupled means the system can tolerate some hardware and software failures without any catastrophic consequences. Distributed systems are usually composed of different applications and components, making them large, complex and difficult to manage. Characteristics of distributed architectures and some challenges, as identified by Sommerville (2006) and Josuttis (2007) include: 1. Complexity: Distributed systems are innately complex, as resources are distributed across multiple locations, and issues such as performance are dependent on more than just processing speed. Additionally, variables such as bandwidth speed and availability significantly affect the system; 2. Security: Communication using communication protocols can expose a system to malicious activities, such as eavesdropping; 3. Manageability: Heterogeneous computational units in the system that are faulty may have a negative impact on the rest of the system. Distributed system adaptability may not always rectify this timeously or even detect that there is a fault; 4. Unpredictability: Responses from the individual components of a distributed system can be unpredictable and affect the stability of the overall system; 5. Heterogeneity: Distributed systems are composed of components and systems that were developed for different purposes and were implemented at different times. They may be deployed on different platforms and written in different programming languages. They may also be based on different programming paradigms. This makes them very different to each other; and 6. Ownership: This is an important characteristic which, however, does not apply to all distributed systems. Components and sub-systems of a larger system may have different owners. SOA has evolved to overcome some of these challenges. There are, however, challenges that are inherent to distributed systems which cannot simply be overcome by a change in architectural
14
Service-Oriented Architecture
design principles. Design principles are constraints and guidelines that guide the design of architectures to adhere to established constraints (Erl 2008). Such challenges differ between project implementations and must be solved on an individual implementation basis. Monolithic architectures, from which SOA partly evolved, do not support the level of openness and abstraction to design highly interoperable systems that are agile enough to adapt to new or changing business needs (Erl 2005). The following sections discuss existing distributed architectures that are part of the pool of architectures from which SOA has evolved.
2.1.2.1 Distributed object architecture Objects of a distributed system can, in theory, run on disparate systems, they can be implemented in different languages and be agnostic to other objects in the system (Sommerville 2006; Trenman 2005). The implementation of distributed object architectures, however, requires middleware that manages communications between distributed objects (Norman 1998; Trenman 2005). The middleware is responsible for linking the distributed objects together and providing seamless communication between them. Two dominant distributed object system architectures exist: CORBA, DCOM. Common Object Request Broker Architecture (CORBA) is a distributed object computing paradigm that combines distributed computing and object-oriented computing (OMG 2008; Henning 2008). The re-usable objects in CORBA are constructed as modules and combined to create applications (Sommerville 2006). Objects can be replaced or updated without affecting the rest of the applications, and objects can communicate regardless of physical location (Taylor, Medvidovic, and Dashofy 2009). CORBA is middleware that allows disparate modules to communicate by acting as an object request broker between the distributed objects and passing messages via a service bus to the appropriate object (OMG 2008). CORBA functions on the principle of an ―Object Request Broker‖ (ORB), a concept similar to a service bus in SOA (Section 2.5). The ORB is at the core of any CORBA-based application brokering communication between the distributed objects of the application (Vinoski 1997; OMG 2008; OMG 2009).
15
Service-Oriented Architecture
Figure 2.2 is an adapted version of the Object Management Group‘s (OMG) specification for CORBA (Sommerville 2006; OMG 2008). This model proposes that a CORBA-distributed application comprise: 1. Applications Objects: objects designed and developed for a specific application; 2. Standard Objects: objects define by the OMG for specific domains, for example, finance, insurance, e-commerce, etc.; 3. Fundamental CORBA services: services and modules providing distributed computing capabilities, such as directories and security management; and 4. Horizontal CORBA facilities: these are common facilities that are not specific to any domain, such as UI facilities or system management facilities. Application objects
Domain facilities
Horizontal C ORBA facilities
Object request broker
CORBA services
Figure 2.2: Fundamental CORBA architecture (Sommerville 2006)
The rise in popularity of CORBA began in the 1990s as it became the distributed computing architecture of choice for enterprises-distributed systems (Henning 2008). CORBA, however, had several shortcomings. Some of these shortcomings have since been addressed (Norman 1998; OMG 2008). CORBA is, nonetheless, not as popular as it was in the 1990s. Some factors that led to the decrease in interest in the CORBA specification include (OMG 2008; Henning 2008): 1. Lack of open protocols: CORBA does not use open protocols in its communication system. Instead, it has language mappings; 2. Cost: Expensive to implement and maintain;
16
Service-Oriented Architecture
3. CORBA Component Model (CCM): Is sometimes too large and complex to be used effectively; 4. Mapping: Currently there is only C++ and Java mapping for CORBA; and 5. Emerging Technologies: Industry shifting focus to new technologies, such as SOA and web services-emerging technologies which offer more flexibility, interoperability and language, as well as platform independence than CORBA. CORBA applications have been relegated to run inside organisational networks, for two main reasons. Firstly, in these closed environments the CORBA components are protected by firewalls and security risks are minimised (Frankel 2005; Henning 2008). Secondly, CORBA is not a web protocol, and as such is not used in B2B e-commerce (Frankel 2005). The Distributed Component Object Model (DCOM) is an extension to Microsoft‘s Component Object Model (COM) (OMG 2008). This extension allows COM to support communication between objects on different computers. This may function over a LAN, WAN or the Internet. The concepts in DCOM are very similar to SOA design concepts. Applications connect directly to components and do not need middleware to broker the messaging or interaction (Microsoft 2008). A fundamental difference between DCOM and SOA is that SOA uses open communication standards and protocols for communication. DCOM on the other hand uses Remote Procedural Calls (RPC) for communication. Although DCOM allows distributed systems to communicate and exchange data, they are limited to systems that are able to interact with Microsoft‘s COM or have an adapter or wrapper to convert the communication messages to a readable format. The use of closed standards severely limits the systems and components with which DCOM is capable of interacting. In addition, services provided by DCOM components are not published in any way, thus placing the responsibility of finding the right services on the application developer.
2.2 Service-oriented architecture The previous section discussed existing distributed object architectures and distributed architectures in general in order to provide a brief history of existing architectures from which
17
Service-Oriented Architecture
SOA was developed. This section introduces SOA and provides a definition for SOA which is used in the rest of this study. Organisations that provide services to customers must invest in a range of information technology (IT) assets to support their operations (Newcomer and Lomow 2005). These assets are integral components of the organisation, as they automate and control services to increase the returns on investments in the business (Microsoft 2006). These assets are developed by different vendors, are written in different programming languages and supported by diverse technologies, hardware, operating systems, data storage and middleware (Erl 2005). As a result, organisations find themselves with a large number of heterogeneous systems that are not interoperable and are complex to integrate. The option of rebuilding an infrastructure from the ground up may prove to be too costly and even more complex (Kodali 2005). SOA evolved in order to resolve such issues. SOA is an architectural style that focuses on loosely coupled system components. Re-usable functionality is abstracted to the basic component of SOA, the web service (Knippel 2005). Figure 2.3 illustrates the relationship between SOA, Component-Based Architectures (CBA) and Object-Oriented Architectures (OOA) (Wilkes 2004).
Figure 2.3: Relationship between SOA, CBA and OOA (Wilkes 2004)
SOA is not predicated by CBD or OOA; Figure 2.3 illustrates the evolution path of SOA and the influence that both CBD and OOA have on SOA. Software components developed using CBD or
18
Service-Oriented Architecture
OOP can be exposed as Services. By providing abstracted functionality as services, the need for rebuilding applications is reduced, since the abstracted functionality can be re-used. Creating new applications can be achieved by orchestrating web services to match new or existing business functions. Organisations with well-defined business functions can abstract the re-usable aspects of the business functions to web services and make them accessible across the enterprise or with partners (Erl 2005). Web services can abstract legacy applications by wrapping around the legacy systems. Since a web service is accessible via its open interface, wrapping around a legacy system exposes the functionality provided by the legacy application as a service (Knippel 2005). Gartner has found that the use of SOA is still growing (Abrams and Schulte 2008). The Gartner hype cycle shows SOA increasing in maturity (Figure 2.4). In the Figure, SOA has passed the point of inflated expectation and the trough of disillusionment. This means that organisations have a better understanding of SOA, its benefits and capabilities. They also understand that simply implementing an SOA will resolve their integration problems.
Figure 2.4: Gartner Hype Cycle for Emerging Technologies (Carpenter 2009)
19
Service-Oriented Architecture
There are still however, a large number of definitions of SOA. Most of them revolve around the notion of services; nevertheless a concrete definition of SOA is required for the purposes of this research. The following section provides a concrete definition of SOA.
2.2.1 Definition of SOA SOA is perceived by some as a universal solution to a wide variety of architectural challenges. Various organisational bodies and vendors have, in consequence, proposed definitions for SOA. A concrete definition of SOA is required for the purposes of this research. Erl (2005) provides a definition of SOA as: “…an architectural model that aims to enhance the efficiency, agility, and productivity of an enterprise by positioning services as the primary means through which solution logic is represented in support of the realization of strategic goals associated with service-oriented computing‖. Erl‘s (2008) definition of SOA as ―an architectural model‖ is consistent with most existing definitions of SOA today (Bianco, Kotermanski and Merson 2007; Shen 2007). Shen (2007) also provides a definition of SOA: ―An architectural style whose goal is to achieve „loose coupling‟ among interacting and contracted services via communication protocols.‖ Shen‘s (2007) use of the term ―loose coupling‖ suggests that the benefits described by Erl (2005) can be achieved by using loosely coupled components. Loose coupling is an important concept in SOA, since many of the benefits of SOA such as interoperability and ultimately re-use can be realised through loosely coupled components. A formal definition of SOA for use in this study could therefore be: ―An architectural style whose goal is to achieve loose coupling by positioning services as the primary means through which solution logic is represented.‖ This definition will be used for the remainder of this research when referring to SOA.
2.2.2 Service orientation Design using SOA principles provides the flexibility and agility for organisations to integrate new assets and to create business processes that utilise these assets. Erl (2005) identifies the goals and benefits of service-oriented computing as to:
20
Service-Oriented Architecture
1. Increase their intrinsic interoperability: Interoperable systems are capable of sharing data seamlessly amongst themselves. Standardisation is important as it forms a basis from which departments, partners and stakeholders can model their systems to allow them to communicate; 2. Increase federation: In an IT-federated computing environment components, resources and applications are united and function as one while maintaining their independence from each other; 3. Increase vendor diversification options: Designing a service-oriented architecture that is well aligned with, yet is not dependent on major vendor SOA platforms, allows the abstraction of propriety service implementation details. This affords organisations the option of selecting best-of-breed offerings of vendor products and components with minimal alterations or redesign; 4. Increase Return on Investment: interoperable and agnostic solution logic increases the potential for re-use, since the logic can be re-used in different compositions and applications. This reduces the cost of redevelopment and any up-front investment in solution logic has long-term financial returns; and 5. Increase organisational agility: Agile organisations are able to efficiently respond to changes in the business environment by adapting business processes or creating new ones. Highly standardised and composite services allow organisations to restructure automated business processes to match changing requirements. SOA is an evolution of the component style of distributed system development which defines constraints for interaction and data exchange in a distributed environment (OASIS 2006). The SOA paradigm advocates building heterogeneous units of computation that are autonomous and platform independent and can be described, published and programmed using standard protocols (Laliwala 2007). Section 2.3.1 discusses services in further detail. The goals of increased interoperability, federation, diversification and agility can be achieved if services are well defined prior to any developmental undertaking. Principles of SOA design assist in the identification, abstraction, definition and implementation of services (Erl 2008). These are discussed in the following section.
21
Service-Oriented Architecture
2.2.3 Principles for SOA Design Erl (2008) defines a principle as a ―generalized, accepted industry practice‖. SOA is an architectural style and design paradigm with design principles that provide guidelines for service-oriented (SO) analysis and design. SOA design principles therefore provide guidelines by which best results can be attained when using SOA. Various service oriented principles exist (Knippel 2005; OASIS 2006; Erl 2008) and, in general, these principles revolve around the concept of loosely coupled system components that integrate effortlessly by using standard and open communication protocols. Erl (2008) proposes seven design principles that encompass the most essential characteristics of SO design. These principles were devised through extensive research involving various organisations and vendors (Erl 2008). The seven principles are: 1. Service Composability: ―Services are effective composition participants, regardless of the size and complexity of the composition”; 2. Service Coupling: ―Service contracts impose low consumer coupling requirements and are themselves decoupled from their surrounding environment‖; 3. Service Abstraction: ―Service contracts only contain essential information and information about services is limited to what is published in service contracts‖; 4. Service Statelessness: ―Services minimize resource consumption by deferring the management of state information when necessary”; 5. Service Reusability: ―Services contain and express agnostic logic and can be positioned as reusable enterprise resources‖; 6. Service Autonomy: ―Services exercise a high level of control over their underlying runtime execution environment‖; and 7. Service Discoverability: ―Services are supplemented with communicative meta data by which they can be effectively discovered and interpreted‖. Designing SOA systems by adhering to the principles above, allows systems to benefit from the loose coupling and re-usability of system components as services. The principles outlined realise the qualities of SOA in the systems that adopts these principles (Zhang, Liu and Yang 2005). In addition, the principles that are interdependent thereby enable other principles to be more
22
Service-Oriented Architecture
effective. Designing systems, however, requires the knowledge of the components in a system and how they interact. The following section discusses the components of SOA.
2.3 Components of SOA Bianco et al. (2007) define SOA as ―an architectural style where systems consist of service users and service providers‖. An architectural style defines the vocabulary of component and connector types and the constraints on how they can be combined (Fielding 2000). The basic components of SOA are the service user and the service provider. The find-bind-execute pattern illustrated in Figure 2.5 shows how the components of the SOA interaction model are constrained in their interaction (Erl 2005; Papazoglou 2006; Bianco et al. 2007; Erl 2008). The service provider is software that allows the sending and receiving of messages, while the service itself is the abstracted functionality that is provided (Zhang et al. 2005). Service registries allow service providers to register and publish their services in a registry. Once a service has been developed, it can be made accessible to service consumers (Clement and Rogers 2004). Service consumers can be other applications, services or end-users (Erl 2005). Service providers make a service accessible to service consumers by first registering the service in a registry and then publishing the service to a service registry (Clement and Rogers 2004). The publishing of a service in a registry involves (Kanneganti and Chodavarapu 2008): 1. Registering the service by entering service information such as the service name, the unique resource locator (URL) of the service, and specifying the location of the service contract (using a different URL). Service contracts are defined using the Web Service Definition Language (WSDL). 2. Publishing the service to make it accessible to service consumers. This step binds the web service to the registry and users; searching the registry can now access the web service (Kanneganti and Chodavarapu 2008). The service consumer is bound to a service provider using a secondary component such as a service registry before it can invoke and make use of a service. A service consumer seeking to access a service that is published in a registry can link directly to the service if the address within the registry is known or the consumer can search the registry for the service. Once an appropriate
23
Service-Oriented Architecture
service is found within the registry, service consumers can bind to the service provider after which they can begin using the service by invoking it.
Figure 2.5: SOA interaction model
2.3.1 Web services The Organisation for the Advancement of Structured Information Standards (OASIS) is one of three standard bodies which aim to define SOA-related standards (OASIS 2006). The adoption of the proposed standards will increase levels of interoperability amongst organisational systems, as well as help in the analysis and development of SOA systems. The other two major bodies are the World Wide Web consortium (W3C) and WS-I. The OASIS group provides a SOA reference model which defines a service as ―a mechanism to enable access to a set of one or more capabilities, where the access is provided using a prescribed interface and is exercised consistent with constraints and policies, as specified by the service description‖ (OASIS 2006). Business processes are composed of different activities and in the same manner, SOA is composed of services. Services are the building blocks from which composite applications are constructed (Papazoglou 2006; Josuttis 2007; Erl 2008). A service represents a self-contained and well-defined piece of functionality that maps onto a real-world business activity (Josuttis 2007; Erl 2008). Services can be independent software programs, legacy applications or discrete functions (Lawler and Howell-Barber 2007; Erl 2008). Web services are currently the most popular enabling technology for SOA (Knippel 2005; Laliwala 2007; Erl 2008). The term service is typically used to refer to a web service. This
24
Service-Oriented Architecture
research focuses on service-orientation by way of web services; therefore any mention of services refers to web services and vice-versa. Web services are capable of collaborating and exchanging data in an agile network which can adapt itself, depending on computational requirements. The OASIS Group (OASIS 2006) compares web services to capabilities – the ability to solve or support a solution for a business problem. Capabilities meet the particular requirements of a problem, and can be executed independently, or in combination with other units in order to satisfy a given business need. Each web service has its unique functional context and has capabilities defined specifically to achieve this. Functional context refers to the exact function a service provides (Papazoglou 2006). As an example, a currency conversion function converts from one currency to another. Its functional context is simply converting from one currency to another. Services can also be invoked by different applications or services. The execution context refers to the broader domain in which a service is executed (OASIS 2006). A travel agent converting exchange rates for a travel package may invoke the currency conversion service mentioned earlier. A bank can also invoke the exchange rate service to acquire currency information. Services run within functional contexts that are agnostic of each other (Erl 2008). This allows the service to participate in more than one service composition and to be executed in different execution contexts.
Service A
Service A
Choreography
Orchestration
Service B
Service C
Service B
Figure 2.6: Orchestration (left) vs. Choreography (right)
Service C
25
Service-Oriented Architecture
Business processes are a series of business functions that are executed to achieve a business goal (Josuttis 2007). Services must be choreographed or orchestrated to match a business process in order to create business processes or applications (Figure 2.6). Service orchestration involves using a process flow language to manage the execution of services in a given sequence (Shen 2007, Menge 2007). Process applications must identify certain characteristics of services to be composed in order to effectively achieve either choreography or orchestration. Service models group services by common characteristics, such as the encapsulated logic, the potential for the re-use of this logic and how this logic relates to domains in the organisation (Knippel 2005, Erl 2005). There are numerous other classifications of models; however, only the most general models are discussed. The three primary service models are illustrated in Figure 2.7 and subsequently discussed.
Task Service Layer Entity Service Layer
Utility Service Layer
Figure 2.7: Service Abstraction Layers (Erl 2008)
2.3.1.1 Task services Task services are high-level, coarse-grained goals that represent the tasks a system can perform. A task service is a business service which is directly associated with a specific business task or business rules (Josuttis 2007; Erl 2008). These services are not service-agnostic. An agnostic service is one that is not explicitly aware of other services around it. A service that has any assumptions about services in its environment is tightly coupled to that environment and changing some of its aspects, such as its implementation can have repercussions on its execution environment (Quynh and Thang 2009). Task services are therefore dependent on the parent processes that invoke them and are to a lesser degree tightly coupled to their environment. Such services typically implement high level business functions.
26
Service-Oriented Architecture
In a contact centre environment an example of such a service is logging a query. The task consists of a series of steps, where user and call information are captured and forwarded to other services for processing.
2.3.1.2 Entity services Entity services represent a business-centric service that bases its functional boundary and context on one or more business entities such as a customer or an employee. Such services are highly reusable because they are inherently agnostic to parent processes. This characteristic allows entity services to be leveraged in multiple parent business processes that interact with a given entity. In a contact centre, an example of such a service is a customer service. This service would deal with all customer-related information (adding, editing, and retrieval of customer information) (Erl 2008).
2.3.1.3 Utility services Utility services perform at the lowest level of granularity (Josuttis 2007). They provide nonbusiness-centric utility functions that are generic in nature. They are highly agnostic and can be used within or between applications (Erl 2008). Terms that characterise such services include atomic, consistent, isolated and durable (Josuttis 2007).
Figure 2.8: A purchase order application invoking services (Papazoglou 2006)
27
Service-Oriented Architecture
The abstraction level of a web service depends on how a service interacts with other services, its level of autonomy and the logic it possesses (Erl 2005). Higher level business-oriented services are able to invoke discrete services and execute them in a business process. Figure 2.8 illustrates this concept. In the figure, the purchase order represents a task service. It does not include lower level functions, such as credit checking, inventory checking, billing or shipment, which are required to fulfil a purchase order. Lower level functions are instead re-used from services whose functional scope is smaller than their invoking service (Papazoglou 2006). In Figure 2.8, these lower level functions represent utility services.
2.3.2 Web services architecture The W3C consortium, a standardisation body for web technologies, defines a web service as ―…a software system designed to support interoperable machine-to-machine interaction over a network. It has an interface described in a machine-processable format (specifically [Web services description language] WSDL).‖ (W3C 2006) The definition above establishes that web services allow machines to communicate using standard communication protocols transmitted over hyper text transfer protocol (HTTP). HTTP is a widely adopted internet protocol for the transmission of data between communicating machines; and applications using this protocol are able to communicate with minimal effort, despite being deployed on different platforms and possibly in different geographical locations. The growth in popularity that web services have experienced can be attributed to a variety of factors. Lewis and Wrage (2006) list a few of these factors as:
Systems can interact with one another via standard web technologies;
Services can be built once and re-used many times;
Services can be implemented in any programming language and on any platform;
Systems can advertise capabilities as services for other systems to use; and
There is tremendous vendor support for web service technology.
These factors stem from the concept of re-usability. Web services facilitate the reusability of computational assets, and this has a network effect. The more popular web services standards and protocols become, the more web services are used to integrate systems. These systems are
28
Service-Oriented Architecture
consequently able to communicate with a growing network of systems, thereby increasing the value of the overall system (Marks 2004). It is important to note the distinction between web services and SOA. SOA is not web services and using web services is not SOA. Web services are a technology specification, while SOA is an architectural style and design paradigm (Erl 2005). Web Services were first developed in order to resolve issues related to distributed systems, such as lack of interoperability, by using platform-independent and open protocols. Web services are therefore a standard approach to making reusable components available and accessible across the web (Sommerville 2006).
Figure 2.9: Web Services protocol stack (Lewis and Wrage 2006)
Figure 2.9 shows the web services protocol stack. The main protocols of the stack are the WSDL, SOAP and UDDI. Web services are based on a core set of open communication standards and protocols. These use XML notation for the communication and data representation (W3C 2006; W3C 2009d). Simple Object Access Protocol (SOAP) is used for message and data exchange (W3C 2007), while Web Service Description Language (WSDL) describes the interface of the web service (W3C 2009d). Web services discovery uses the UDDI protocol (Bellwood et al. 2004), while other standards cover events management, attachments, security, reliable messaging, transactions and management (Lewis and Wrage 2006; Microsoft 2006). Figure 2.10 illustrates SOAP, UDDI and WSDL interact in a web service architecture.
29
Service-Oriented Architecture
Figure 2.10: SOAP, WSDL and UDDI interaction (Laliwala 2007)
2.3.2.1 Web service description language (WSDL) WSDL is a specification which defines how to describe a web service using XML (Cerami 2002). It defines how service consumers can interact with service providers by describing the public interface of a service (Cerami 2002; Hansen 2007). The public interface outlines how the service is invoked and how data are exchanged (Papazoglou 2006). WSDL describes the web service in terms of its operations and the supported data types of the operations, and thus serves as a contract between the service consumer and service requestor (Cerami 2002). This is why it is sometimes referred to as a service contract (Erl 2008). The description of operations using XML separates the implementation of the service from its description and the implementation details of the service are never revealed (W3C 2009d). This abstraction allows the implementation of a service to evolve without causing dependency failures from consumers of the service. Sequence meta-data for operation messages are located in the WSDL as well as the protocol bindings of the service and the Uniform Resource Identifier (URI) of the service logic. The WSDL has two distinct sections:
30
Service-Oriented Architecture
1. Service-interface definition: this section describes the web service interface structure which has information on the capabilities of the service, its operation parameters as well as any abstract data types; and 2. Service Implementation: this section binds the interface to concrete implementations, such as network address, specific protocols and concrete data structures.
Figure 2.11: An Example of a WSDL document (Papazoglou 2006)
Figure 2.11 illustrates the structure of a WSDL document. The WSDL specification uses the following elements to define services (Cerami 2002): 1. Types: This element is a container for data type definitions, using a type system such as XML Schema Definition (XSD); 2. Message: This element describes an abstract, typed definition of the data being communicated. It contains different parts of the message, such as the name of the message, parameters for the message and return values for the message; 3. Operation: an abstract description of an action supported by the service;
31
Service-Oriented Architecture
4. Port Type: This element describes an abstract set of operations supported by one or more endpoints; 5. Binding: This element describes the protocol and data format specification for a particular port type for how the service is implemented on the ‗wire‘; 6. Port: a single endpoint defined as a combination of a binding and a network address; 7. Service: This element defines a collection of related endpoints and the address (using a
URL) for invoking the service using SOAP (Section 2.3.2.3); and These elements together define the WSDL of a web service thereby allowing other services and applications to access the functionality of the service in a standard way.
2.3.2.2 Universal discovery description integration (UDDI) The Universal Description Discovery and Integration (UDDI) protocol deals with the publishing and discovery of web services (Bellwood et al. 2004). It provides definitions for registries of business services (Kanneganti and Chodavarapu 2008). Registries can be made available to the general public, or they can be private – that is, used within the boundaries of an organisation - or they could be between partnering organisations, for example Amazon web services are only available to registered developers and businesses (Amazon 2009). It is not the entire web service that is published to the registry, only the WSDL is published to the registry. When a consumer (service or developer) locates the WSDL of the service they require within the UDDI registry, they are able to bind to it and invoke its logic as required (Bellwood et al. 2004).
2.3.2.3 Simple object access protocol (SOAP) SOAP is an XML-based message exchange protocol for communication over standard HTTP/HTTPS. It is lightweight and geared for the exchange of information in a decentralised environment. The use of XML technologies to define a messaging framework, allows it to be platform and programming language-independent (Gudgin et al. 2007).
32
Service-Oriented Architecture
Figure 2.12 shows an example of a SOAP request. Web services take advantage of this fact in the exchange of messages with other web services. The lightweight properties and self-contained nature of SOAP allow for secure communication. MSFT
Figure 2.12: An example of a SOAP request message
2.4 Related standards Similar to the situation in most computerised solutions, interactions between components can be implemented using different approaches. In SOA, service communication can be accomplished in several ways. Each communication approach may impact key quality attributes of the overall system. An approach to services that does not make use of a standard contract is the Representational State Transfer (REST) approach. REST and another important standard for web services – BPEL – are discussed in the following section.
2.4.1 Rest web services Representational State Transfer (REST) is a Web architecture that promotes the definition of web services as stateless client-server interfaces that return XML-based data (Fielding 2000). Web Services are accessed using universal resource identifiers (URI), similar to how pages or documents are accessed on the World Wide Web. At its core, REST defines network architecture principles outlining how resources are defined and accessed. Remote Procedural Call (RPC) is a protocol that allows remote method calls on objects in a distributed environment. RPC with web services relies on SOAP for communication. RPC differs from REST in several ways. Firstly, REST uses simple commands on resources: get, put, delete and post (Tilkov 2007), while RPC allows defined methods for an object to be invoked.
33
Service-Oriented Architecture
Secondly, REST deals with the exchange of resources, where verbs define a uniform concept and nouns define more identifiers while RPC methods must be aware of the existence of objects within their execution environment before they may invoke any of the object methods. Table 2.1: RPC method (Left) REST URI (right)
Resources
RPC Method Call
REST URIs.
getUser() addUser() removeUser()...
http://example.com/users/ http://example.com/users/{user} (one for each user) http://example.com/findUserForm userResource = new Resource("http://example.com/users/001") userResource.get()
Invocation exampleAppObject = new code ExampleApp(„example.com:1234‟); exampleAppObject.removeUser(‗001‘);
Table 2.1 shows the difference between an RPC client method call and the invocation of a REST Web Service resource using its Universal Resource Identifier (URI). The table compares the access methods for RPC against access methods for REST. The REST approach uses URIs to access functions and data. The URI method allocates an ID to every resource, thus, allowing access of that resource by simply invoking its URI. On the other hand, RPC-type services are invoked as methods. The RPC-method invokes the remote command of an object in order to access or manipulate any resource. Table 2.2: When to use REST or SOAP-RPC web services (Mulik 2007)
REST Completely stateless web services are needed. A caching infrastructure can be leveraged. The requirement is for point-to-point integration. This means both service consumer and provider have mutual understanding of the context and content being passed. Limited bandwidth exists between service consumer and provider; e.g. having mobile device as a consumer. Front-end technologies such as AJAX are being used.
SOAP (RPC) A formal contract is needed for a service (to be provided as WSDL). Complex non-functional (aka QoS) requirements are present and need to be handled in a standardized way. Requirements for asynchronous service invocation are present.
In the comparison of RPC and REST in Table 2.1, both examples attempt to achieve the same thing. The RPC approach defines the resources as a method, which can be invoked by the client. The rest approach defines the resources as URIs, which can also be accessed by the client.
34
Service-Oriented Architecture
Depending on the architecture of an application, either the REST approach or the RPC approach may be used. Table 2.2 shows the circumstances under which either REST or SOAP (RPC) is the most appropriate (Mulik 2007). Although REST Web Services are a growing trend, they have not been considered in this study. This is because, unlike RPC web services, REST web services do not use description languages, like WSDL, to document a contract for the services. Accessibility to web services allows them to be invoked and integrated into applications. Integrating a small number of services is acceptable when using this approach. The integration of a larger number of services, especially when creating a business process, requires a more structured and simplified approach for the effective execution of the web services. Discussed next is BPEL. This standard was designed and created to facilitate the execution of services in a process.
2.4.2 Business process execution language Simply developing web services and exposing their functionality is not sufficient. In order to fully realise the potential of web services as an integration platform, the complex interactions of web services and business processes must be integrated by way of a standard process integration model (Andrews et al. 2003; Papazoglou 2006). Given a scenario where a concert-purchasing service has three operations: getting a price quote, purchasing a ticket, confirmation and cancellation, we see the need for orchestrating these operations in the right order. Shen (2007), therefore, recommends that business processes need to:
Co-ordinate asynchronous communication between services;
Correlate message exchanges between parties;
Implement the parallel processing of activities;
Implement compensation logic (e.g. undo operations);
Manipulate or transform data between partner interactions;
Support for long running business transactions and activities; and
Support for exception handling.
35
Service-Oriented Architecture
Business Process Execution Language (BPEL) is an XML-based processing language for managing the flow of business processes. In short, it is for the ―formal specification of business processes and business interaction protocols‖ (Papazoglou 2006). BPEL is a specification used to achieve orchestration. Orchestration of services involves invoking services in a predetermined manner so as to achieve a business objective. BPEL exists as a separate layer on top of WSDL, orchestrating the interaction between web services. The web services provide computational capability, while the BPEL defines the higher level business process (Andrews et al. 2003). It is evident, from the descriptions of BPEL that it provides the agility required to effectively leverage web services. BPEL can be used to reorganise an application to match new business needs and to invoke new or different web services when the needs of a business or their application requirements change, rather than re-engineering applications that invoke the services. A number of other standards for the choreography of web services exist. WS-Coordination and WS-Transaction, for example, complement BPEL by providing means for specifying protocols used in interactions with transaction-processing systems and other applications that require coordinating web services (Andrews et al. 2003). BPEL allows web services to be orchestrated and invoked in predefined sequences that match business processes (Andrews et al. 2003). BPEL does not, however, cater for uniform messaging and transformation between web services. Enterprise service buses (ESB) are used to integrate the messaging and transformation of services (Bianco et al. 2007). The following section discusses this approach by which enterprise integration may be achieved.
2.5 SOA integration approaches During the process of architecting an SOA system, many services may be identified for implementation. The main approaches to integrating the interaction between services are the point-to-point (hub-and-spoke approach) and the ESB approach (Bianco et al. 2007). The point-to-point approach requires that communication and interaction between web services be managed by the web services themselves (Figure 2.13 B). A direct connection between the applications is designed, implemented, deployed and administered by the communicating
36
Service-Oriented Architecture
services (Lewis and Wrage 2006). Furthermore, the responsibility for messaging and routing is distributed among the communicating web services.
A
B
Figure 2.13: SOA Integration approaches, ESB (A) and Point-to-Point (B)
ESBs offer a structured approach to messaging and routing between services (Figure 2.12 A, Figure 2.13) (Lewis and Wrage 2006; Menge 2007). This approach is most appropriate in a situation where a large number of services are deployed (Lewis and Wrage 2006). As with SOAs, there are various definitions for ESB, but the central concepts are similar in most definitions. Menge (2007) gives a definition encompassing the major concepts of ESB ―An Enterprise Service Bus is open standards, message-based, distributed integration infrastructure that provides routing, invocation and mediation services to facilitate the interactions of disparate distributed applications and services in a secure and reliable manner‖. ESB refers to both an architectural design and a software product (Bianco et al. 2007). The ESB is the brokering middleware of software products that link applications with each other in an SOA. It offers a unified, standard approach of passing messages between applications and other core services. Each application communicates with the ESB, as opposed to each other (as is the
37
Service-Oriented Architecture
case with point-to-point integration). The ESB transforms the message to meet predefined standards, and then routes it to the appropriate application or service.
Figure 2.14: Logical SOA reference architecture
The ESB can be composed of services and processes for routing and message transformation (Bianco et al. 2007; Menge 2007). The important services include the mediation service and the registry and repository services (Figure 2.14) (Bianco et al. 2007). Interaction services, process services and information services support the business and application services by managing process flow by using (for example) BPEL to orchestrate web services. Proponents of ESB claim the following benefits (Trenman 2005):
Interoperability: ESB allows disparate systems on different platforms with different data requirements to interact as service providers and consumers with minimal change to each;
Modifiability: ESB allows many types of changes to service providers without affecting the consumers of their services; and
Extensibility: ESB facilitates the addition of services compared to the point-to-point integration approach.
ESBs can be complex and hard to implement and this creates a large margin for error. In some cases using an ESB creates its own set of unique problems. Some issues affect the decision to use an ESB include:
38
Service-Oriented Architecture
Performance: overheads in message transformation and routing can negatively impact application performance; and
System complexity and costs: may increase with the addition of new layers which have to be supported and in ensuring that applications that interact with the ESB meet the required standards.
Usage of either the point-to-point approach or an ESB depends on the SOA implementation; and many factors must be considered. Some of these include (Keen et al. 2004):
Current number of integrated services, as well as the planned services;
Performance requirements of the current and future applications in terms of throughput and response times;
Communication patterns (e.g. synchronous, message queues, etc.);
Support for current and future services; and
Current and future technology trends.
ESBs are a matter of choice in the design and implementation of an SOA. Although there are many benefits to be gained, they can introduce drawbacks such as the increased complexity of a system. The use of an ESB is therefore dependent on the designers of the SOA and the constraints which limit what the SOA may be capable of achieving.
2.6 Service-oriented applications The SOA design paradigm has enabled a new breed of applications which allow scalable infrastructure and software to be delivered over the internet as a service. Cloud computing is one such application of SOA, where computing is conducted in a cloud. Data storage and information processing occur in infrastructure abstracted to data centres that run parallel algorithms and applications such as MapReduce, implemented in frameworks to manage processing on a large scale (Varia 2008). Software as a service refers to the applications which are made accessible to consumers through the cloud. These concepts are discussed in the following sections.
39
Service-Oriented Architecture
2.6.1 Cloud computing The traditional client-server architecture, introduced in the 1980s allowed data to be manipulated in a central repository or server. Cloud-computing moves the server into data centres. Clouds are defined as ―… a large pool of easily usable and accessible virtualized resources (such as hardware, development platforms and/or services)‖ (Vaquero et al. 2009). The server and hardware infrastructure are ―virtualised‖ and made accessible over the internet. Cloud-computing is seen as a major step forward in on-demand computing (Vouk 2008). Ever since IBM‘s announcement of the ―Big Cloud‖ (IBM 2007a), cloud-computing has become a major talking point in both academia and industry (Amazon 2009; Nimbus 2009; OpenNebula 2009; Status 2009). Cloud-computing is an example of SOA where computing infrastructure can be re-used to provide on demand services to consumers by making them available as web services (Atkins et al. 2003; Varia 2008). ―Consumers‖ refers to organisations, applications or individuals seeking to use the virtualised infrastructure in the cloud. Cloud-computing evolved from various architectures and computing paradigms, namely, grid computing, virtualisation, utility computing and web services (Vouk 2008). Cloud-computing can therefore be implemented by using any of the various architectures from which it evolved (Weiss 2007). Underlying cloud-computing is SOA which what allows the cloud to be agile and to be available on demand (Vouk 2008; Wang et al. 2008). The ‗cloud‘ refers to the hardware and software running in a data centre to support applications delivered as a service over the Internet (Armbrust et al. 2009).The cloud‘s infrastructure and capabilities are made accessible as applications to consumers through the use of web services. Amazon‘s Elastic Compute Cloud (EC2) (Amazon 2009) and Google‘s AppEngine (Google 2009c) for example, have servers and software that allow applications, such as Google Docs and Gmail to be accessed over the internet (Weiss 2007; Varia 2008). Microsoft‘s Windows Azure Platform is a cloud-computing platform that runs in Microsoft data centres and manages the cloud infrastructure (Chappell 2009a). The Azure platform provides the Windows Operating System service (Window‘s azure compute service), data storage (SQL
40
Service-Oriented Architecture
Azure storage service) services and .NET services. These are made accessible to remote client applications over the internet (Chappell 2009b). The platform infrastructure is loosely coupled and local and internet applications can invoke computing services as required, easily scaling up when computing needs increase. The software that is delivered as a service is known as Software as a service (SaaS) and is discussed further in the next section.
2.6.2 Software as a service ―Software in a cloud becomes a service‖ (Weiss 2007). Software as a service (SaaS) allows customers to contract with application-service providers and to use software, such as ERP or CRM on demand, directly from the service providers (Microsoft 2006). Software is delivered in the same way that infrastructure is made available in cloud-computing. Third party service providers can leverage the scalability and availability of cloud-computing infrastructure to provide software as a service to application consumers (Dubey and Wagle 2007). Service providers benefit from the instantaneous scalability of the infrastructure, while consumers are able to use software on an as-needed basis. Business models, such as Amazon‘s cumulative instance hours, charge consumers a fee per application in the cloud (Weiss 2007; Amazon 2009). Other types of applications can also be delivered over the internet as services. Operating system capability, for example, can be abstracted to the cloud and made accessible to internet applications (e.g. Windows Operating System service mentioned in Section 2.6.1). EyeOS system provides desktop functionality through a browser (Hayes 2008; EyeOS 2009) while Google Docs (Google 2009a) and Buzzword (Buzzword 2009) provide word-processing capability from a cloud. Salesforce.com provides a suite of applications, such as Enterprise Resource Planning (ERP) and Customer-Relationship Management (CRM) as a service (Salesforce 2009). Providing a suite of enterprise applications in this manner is referred to as Enterprise Computing in a cloud (Hayes 2008). Despite the publicity surrounding these applications, cloud computing and software as a service face various challenges. Privacy, security and reliability become issues once third party services take control of personal documents (Hayes 2008). The reliability of a third party to continue running and safeguarding personal data can also become an issue.
41
Service-Oriented Architecture
2.7 Existing systems and related work The research in this study focuses on SOA and adaptive user interfaces (AUIs). Existing works and research in SOA have, predominantly, focused on machine-to-machine communication between the basic components of SOA – web services (Paternò, Santoro and Spano 2008; Tsai et al. 2008). The first step to achieving an AUI is to understand how UIs are used in SOA. Ellinger (2007) discusses UIs that can be used in SOAs and classifies them by architecture type:
Thin Clients: the UI is hosted on the client side, with system logic and data residing on different servers;
Portals: aggregate information from multiple services can act as an entry point for users to access services;
Rich Clients: complex applications with functionality distributed across the web or network; and
Smart Clients: stand-alone applications that hold additional content on the web or network (Josuttis 2007).
Josuttis (2007), in his discussion on the specific programming model for the front ends of SOA applications, purports that the purpose of a service is not to control the consumer, but rather to serve him. Services, therefore, do not require human intervention, since interaction during the service process violates the service-oriented model (this model was discussed in Section 2.3). Interaction can, however, occur on an ad hoc basis, with processing services managing the interaction between the front-end and appropriate services in the back-end. Josuttis (2007) also supports Ellinger (2007) by stating that SOA front-ends should use technologies, such as Portlets and Smart Clients to validate user-entered data and to invoke services. Portlets render UIs from producer web services that allow end-users to interact with a web service (Braun et al. 2007). Portlets allow Portals and Web applications to aggregate information from multiple online sources and provide them to the end-user for use (Braun et al. 2007). Due to its ubiquitous nature, and its support for ―content-as-plug-and-play‖ (Braun et al. 2007), Portlets are widely
42
Service-Oriented Architecture
seen as the best approach to UI for SOA (Braun et al. 2007; Ellinger 2007; Lawler and HowellBarber 2007; Josuttis 2007). Creating UIs, in a similar way to how Portlets create content, has been proposed by several authors to create UIs at run time (Gajos 2008; Paternò et al. 2008; Tsai et al. 2008). This means the UI is generated at the time the user needs to interact with it rather than being designed and developed as part of an application. Several other authors have proposed ways to use this same technique for web services in order to create UIs that allow users to interact with web services at run time (Kassoff, Kato and Mohsin 2003; Song and Lee 2007; Spillner et al. 2007; He and Yen 2007; He et al. 2008). The following section discusses such works for the generation of UIs for web services.
2.7.1 Web service user interface generation Generating UIs for web services is an approach that has been proposed to provide a means for interaction with web services (Kassoff, Kato and Mohsin 2003; Spillner et al. 2007). Advancements in semantic description specifications for web services such as Semantic Annotations for WSDL (SAWSDL) and Web Service Semantics (WSDL-S) currently exist. These specifications are designed to further facilitate machine-to-machine communication by providing mechanisms by which machines can evaluate services using the meaning of service attributes, and empirical values. The knowledge of how web service attributes are related can however be used in the creation of UIs since they provide information regarding different aspects of web services (Kopecký et al. 2007). Nonetheless these specifications lack specific mechanisms and tools to effectively define ways to create a UI for a web service. The lack of specifications to support the creation of UIs for web services has resulted in techniques being devised to generate UIs that allow direct communication between users and web services. These techniques focus on parsing the WSDL of a given web service to extract relevant information from which a UI can be created. The following sections discuss specific works that employ web service user interface techniques.
43
Service-Oriented Architecture
2.7.2 WSGUI Figure 2.15 illustrates the WSGUI. It is a general approach to supplement web services with UI descriptions stored in UI meta-data documents constructed by a designer during the development of the web service (Kassoff, Kato and Mohsin 2003). This approach uses meta-data to describe a UI for a service. The meta-data documents are referred to as GUI Deployment Description (GUIDD). The GUIDD is used to separate the display of the web services‘ UI from their implementation, which allows the service to maintain the separation of concerns between its implementation details and its appearance (Spillner et al. 2007). The GUIDD supplies information on annotation data for aspects of the UI.
Figure 2.15: WSGUI Model
2.7.3 Servface Servface‘s aim is to provide descriptions for UIs for services. This approach uses UI notation by creating extensions for service descriptions (Servface 2008; Spillner et al. 2008). The goal of Servface is to have service notations used in the rapid composition of UIs for web services (Spillner et al. 2008). This can be achieved by extending current service specifications, such as WSDL, or extending semantic annotations which offer a greater amount of information concerning web services. Semantic annotations do not just provide functional and syntactical information about a web service; they add meaning to the web services operations (Spillner et al. 2008).
44
Service-Oriented Architecture
Figure 2.16 shows the Servface model and illustrates how web services that are annotated with UI descriptions can be composed to create composite applications with interfaces (Servface 2008). The use of annotations to describe UIs has been successfully achieved in previous works (Spillner et al. 2008; Paternò et al. 2008). XML annotations can be used to describe an abstract interface. XML is platform-neutral; it can be read or used from most existing platforms today (Cerami 2002). This affords Servface the flexibility to have the UI annotations interpreted by different platforms, thus making web service UIs created using this method as platformindependent.
Figure 2.16: Servface model (Servface 2008)
2.7.4 Web service user interface generation using XForms Song and Lee (2008) illustrate an approach that maps data found in a web services‘ WSDL to XForms input controls and then generates XForms UIs. They apply their UI generation technique to generate UIs based on the device (desktop, PDA, Smartphone etc.) from which a service is invoked. This technique is similar to the work of Kassoff et al. (2003) and Spillner et al. (2007). In summary, the process for UI generation begins with the web service definition to establish the basic requirements of the service in terms of inputs, outputs and data types. Certain approaches use external definitions, such as semantic mark-up or object hierarchies to refine the UI generation process. This refinement is achieved by providing information regarding the presentation of the UI elements from the service WSDL. The WSDL definitions in combination with semantic mark-up are processed using pattern matching techniques and a UI is then presented to the user.
45
Service-Oriented Architecture
2.7.5 Mash-ups Enterprise mash-ups have also been proposed as a viable alternative to SOA UIs (Cañas et al. 2007; Lizcano et al. 2008; Nestler 2008; Nestler, Feldmann, and Schill 2008; Nestler et al. 2009). Mash-ups, in principle, function in a similar way to Portlets. However, mash-ups include the end-user in the composition of applications (Nestler 2008). This differs from other existing approaches where a designer creates the application which end-users can then use. Mash-ups utilise visual programming techniques to allow end-users to piece together composite applications from pre-existing components (Nestler 2008; Nestler et al. 2008). An example of such an application is Yahoo‘s Pipes‘ (Yahoo 2009) which allows users to create data mash-ups by using popular third party web services. Users combine data from multiple sources to create ad-hoc data applications. This approach is however, best suited for adaptable UIs. Adaptable UIs allow users to change aspects of the UI so that it suits their preference. Adaptable UIs are compared to adaptive UIs in the next chapter (Section 3.2.1).
2.8 Summary The objective of this chapter was to gain a comprehensive understanding of SOAs, as well as their enabling technology: Web Services. In order to achieve this objective research question R1: What is SOA and what are its components? was asked. Due to the large number of vendors promoting SOA, a plethora of definitions of SOA exist. A formal definition of SOA for this study is therefore provided: ―An architectural style whose goal is to achieve loose coupling by positioning services as the primary means through which solution logic is represented.‖ SOA is increasingly being adopted by enterprises looking to integrate current and future systems. It advocates principles which focus around the notion of a service, which is the most basic component of SOA. Other components include the service consumer, the service provider and the service registry. Currently, the most popular means of realising SOAs are web services. Several standards and protocols exist that allow web services to communicate, for example, WSDL provides an open interface for service communication and SOAP a transport mechanism for messaging.
46
Service-Oriented Architecture
The literature on SOAs shows that currently work on SOAs and web services focuses on machine-to-machine communication. WSDL allows web services to expose their functions and thus exchange data with other services. SOAP allows messages to be exchanged between services and BPEL allows web services to be orchestrated to create meaningful processes. Research in UIs for web services has been undertaken successfully (Section 2.7) showing that UIs can be created to allow interaction with web services. The next chapter moves to the second aspect of the study, namely adaptive user interfaces (AUI). The functions that AUIs support as well as the challenges that they face are discussed in order to understand why AUIs exist. Methods and techniques for the use of AUIs are discussed and elaborated upon to understand how AUIs can be realised in practice.
47
Chapter 3: Adaptive User Interfaces and User Expertise 3.1 Introduction The previous chapter discussed the evolution of service-oriented architectures (SOA) and the technologies underlying the actualisation of SOA. This was done to create an understanding of the principles that guide SOA design and its implementation and also to discuss web services since these are currently the most popular methods used in the actualisation of SOA. In order to achieve the goals of this research, which are to implement an adaptive user interface (AUI) using an SOA and answer the main research question ―How effectively can an adaptive user interface be implemented in a service-oriented architecture at the service level to provide usable adaptation for novice users?‖ an understanding of AUIs is required. The chapter therefore answers research question R2 which is ―What are AUIs and what are the components of an AUI‖ by investigating AUI. The objective of this chapter is twofold. Firstly, it aims to investigate AUIs in order to facilitate an understanding of AUIs and how they differ from static user interfaces. Secondly, it investigates the domain of user expertise and its implications for user interface (UI) design. In order to achieve the first objective, AUIs are discussed (Section 3.2), a definition of AUIs is given (Section 3.2.1) and the benefits (Section 3.2.2) and functions (Section 3.2.3) that AUIs provide are discussed. Approaches to AUIs (Section 3.2.4) are presented to elaborate on the existing methods used to learn about users and to adapt to their needs. The components that allow AUIs to capture user data, learn about users and make inferences about users are fully discussed (Section 3.2.5) in order to highlight the core components required to achieve adaptation. Challenges faced by AUIs in this process are also subsequently discussed (Section 3.2.6.). In order to achieve the second objective, the qualitative (Section 3.3.1) and quantitative (Section 3.3.2) differences between novice and expert users are discussed. The implications of these differences on UI design are also discussed (Section 3.4).
Adaptive User Interfaces and User Expertise
Finally, works related to this study in terms of AUIs are presented - in order to subsequently investigate the relevant literature on this subject (Sections 3.5 and 3.6).
3.2 Adaptive user interfaces Personalisation of systems to individual users became popular in the early 1990s. The growth in interest has been driven by the clear benefits that tailored UIs provide over traditional static UIs in managing differences in user characteristics, such as expertise, experience and preferences (Alvarez-Cortes et al. 2007). Jameson (2003) attributes this growth to three variables:
The increasing diversity of users and the context of different uses;
The increasing number and complexity of interactive systems; and
The growing amount of information that has to be dealt with.
The growth in interest in personalised UIs has also led to an increase in the research efforts into user-adaptive systems especially in commercial, large scale applications (Jameson 2003; LópezJaquero et al. 2004; Alvarez-Cortes et al. 2007).
Figure 3.1: Evolution of user interface design (López-Jaquero et al. 2004)
Figure 3.1 illustrates the evolution of UI design. Initially, UIs were designed with a one-size-fitsall mindset (Figure 3.1 A) (Gajos 2008). However, as awareness regarding differences in user‘s traits increased, design progressed to accommodate user differences by using profiles to classify
49
Adaptive User Interfaces and User Expertise
users according to stereotypes (Figure 3.1 B). In recent times design has progressed even further. AUIs are capable of modelling unique traits of users. Besides stereotypes and user profiles, AUIs are able to recognise preferences, skills, and expertise as well as user behaviour which are not easily captured or modelled in a stereotype (Figure 3.1 C).
3.2.1 Definition of AUI A clear definition of AUIs is necessary before discussing specifics on AUIs. AUIs are a subset of Intelligent User Interfaces (IUIs). These constitute a vast multidisciplinary field encompassing such research areas as psychology, artificial intelligence and computer science. Figure 3.2, shows the various disciplines that apply to IUIs. IUIs aim to increase the rate and quality of information flow between humans and computers by leveraging methods and techniques from the vast pool of disciplines that overlap in this field.
Figure 3.2: Multidisciplinary research areas in IUI (Alvarez-Cortes et al. 2007)
AUI is the subset of IUIs that deals specifically with the adaptation of the UI. The UI adapts based on the differences in user characteristics. Jameson (2003) defines an AUI as: ―An interactive system that adapts its behaviour to individual users on the basis of processes of usermodel acquisition and application that involve some form of learning, inference, or decision making‖.
50
Adaptive User Interfaces and User Expertise
The definition above implies a difference between adaptive UIs and adaptable UIs. Adaptive UIs monitor a user‘s interaction with the application and adapts user interface components based on the identified usage patterns. Adaptable UIs, on the other hand, provide tools which allow users to alter the UI directly (Alvarez-Cortes et al. 2007). An adaptive UI must therefore be able to collect user-interaction data, store the data about user characteristics, and use this data to identify patterns and make inferences about the user. Finally it must adapt the UI to match these characteristics. Fischer (2001) provides a comparison of adaptive and adaptable systems using the following criteria:
Definition: the definition of each concept and what they do;
Knowledge: how knowledge is stored or represented in each system type;
Strength: advantages of the approach;
Weaknesses: disadvantages of using the approach;
Mechanics: components used to achieve the objective (e.g. adapt); and
Application Domain: typical domain in which the type of system is applied. Table 3.1: A Comparison between Adaptive and Adaptable Systems (Fischer 2001)
Adaptive Dynamic adaptation by the system Definition itself to current task and current user. Contained in the system; projected in Knowledge different ways. Little (or no) effort by the user; no Strengths special knowledge of the user is required. User has difficulty developing a coherent model of the system; loss of Weaknesses control; few (if any) success models exist (except humans). Models of users, tasks, and dialogs; Mechanisms knowledge base of goals and plans; Required powerful matching capabilities; incremental update of models. Active help systems, critiquing Application systems, differential descriptions, UI Domains customization, information retrieval.
Adaptable User changes (with substantial system support) the functionality of the system. Knowledge is extended. User is in control; user knows her/his task best; system knowledge will fit better; success model exists. Systems become incompatible; user must do substantial work; complexity is increased (user needs to learn the adaptation component). Domain-orientation; ―back-talk‖ from the system; design rationale. Information retrieval, end-user modifiability, tailorability, filtering, design in use.
51
Adaptive User Interfaces and User Expertise
Table 3.1 provides a comparison of adaptive and adaptable UIs, using Fischer‘s (2001) criteria. The differences between adaptive UIs and adaptable UIs are very apparent in this table. Adaptive systems and adaptable systems differ at a fundamental level in that adaptive systems adapt themselves, based on information captured during interaction sessions with users, while adaptable systems allow the user to alter the system until it meets suits her preferences. Adaptive systems therefore require little or no effort on the part of the user for adaptation to occur, while adaptable systems put the user in total control. In this research, Jason‘s (2008) definition (Benyon and Murray 1993; Langley 1999) of AUIs is used: “A software artefact which can automatically alter aspects of its functionality and/or interface and improves its ability to interact with a user by constructing a user model based on partial experience with that user.”
3.2.2 Benefits of AUIs The users of any application differ in their preferences, skills, abilities, knowledge, experience and various other traits (Alvarez-Cortes et al. 2007). Today however, UIs do not reflect this diversity of users. User interfaces are simplified to cater for the greatest number of users by catering for the lowest common denominator (Kobsa 2004). As a result, users have to learn to use the interface instead of the interface learning to suit the user. AUIs adapt to the user in order to overcome the limitations of static UIs and achieve the benefits of tailored UIs (Kühme 1993). The benefits depend on the type of adaptation being provided. AUIs provide several benefits. Firstly, AUIs provide users with UIs that are easy to use, but that improve the efficiency and effectiveness of the interaction between the user and the AU (Jason 2008). Secondly, easy-to-use UIs make complex systems more usable which in turn allows users to be more productive (Dieterich et al. 1993). Thirdly, AUIs speed up interaction between the users and the UIs. This, in turn, increases user satisfaction. The following section discusses ways in which AUIs are used to adapt to users, and the benefits of each method are highlighted and discussed.
52
Adaptive User Interfaces and User Expertise
3.2.3 Functions of AUIs Personalisation refers to the adaptation of the AUI to suit the user‘s traits, preferences or needs. There are numerous functions that an AUI can provide in order to personalise and facilitate human-computer interaction. These functions provide a solution to the problems faced by traditional static UIs. Jameson (2003) outlines the following functions for AUIs split into two general categories: 1
Supporting system use: a. Taking over routine tasks; b. Adapting the UI; c. Giving advice about system use; and d. Controlling a dialogue.
2
Supporting information acquisition: a. Helping users find information; b. Tailoring information presentation; c. Recommending products; d. Supporting collaboration; and e. Supporting learning.
The following section elaborates on the functions of AUIs in more detail and groups them in five general categories: interface adaptation, task assistance and adaptive help, recommendation and information filtering, information presentation and adaptive learning (Van Tonder 2008).
3.2.3.1 Interface adaptation AUIs in this category physically adapt the UI. The rationale behind this function is that altering the UI to suit the way a user works will benefit the user (Jameson 2003). User interface elements such as menus, icons and other artefacts are adapted based on interactions when using this form of adaptation. Figure 3.3 illustrates the use of adaptive menus, such as Microsoft‘s smart menu (Figure 3.3A), font selection (Figure 3.3B) and a fisheye lens menu (Figure 3.3C). Initially, the menu only displays the most frequently used options and hides those only occasionally used (Figure 3.3A). Once the user either clicks on the extension button or dwells on the menu for an extended period
53
Adaptive User Interfaces and User Expertise
of time, more menu options are revealed. The font selection option in Microsoft office works in a similar fashion. With this menu, recently used fonts are displayed at the top (Figure 3.3 B). This is supposed to reduce the selection time for frequently used fonts. A
C B
Figure 3.3: Office 2003 smart menu system (A), font selector (B). Fisheye lens Menu (C)
3.2.3.2 Task assistance and adaptive help Interactive systems under this classification include those that help with routine tasks, give advice about system use, controlling dialogue and support collaboration. AUIs in this category provide assistance by adaptively offering users information concerning what they are doing (or what the system infers they are trying to do). Microsoft‘s ‗Clippy‘ is a famous example of such a system; this evolved from the famous project, Lumiere (Ehlert 2003).
3.2.3.3 Recommender systems and information filtering Recommendation systems are the most popular form of AUI because they are implemented in the vast majority of e-commerce systems and are capable of making suitable product recommendations to users using the user‘s previous history or the history of users with similar characteristics. Information-filtering AUIs are able to filter information that users may be interested in. An example of such an application is email clients and servers capable of filtering
54
Adaptive User Interfaces and User Expertise
spam email. Certain systems are able to identify spam based on the known characteristics of spam.
3.2.3.4 Information presentation AUIs are capable of going further than selecting what information to present to users. Some AUIs are capable of tailoring information presentation to user preferences, that is, how information is presented. Browne, Norman and Riches (1990) emphasise the importance of a user‘s cognitive skills, as this plays a major role in how a user understands information presentation. Users‘ productivity can be improved if information is presented based on the preferences of the user (Jason 2008; Van Tonder 2008). 3.2.3.5 Adaptive learning Adaptive systems aim to adapt to the user‘s level of knowledge and incrementally adapt as the user learns more about the system and its domain (Brusilovsky and Schwarz 1997). Jameson (2003) refers to such systems as Learner Modelling Systems. The premise behind adaptive learning is that users are exposed to increasingly complex material which builds on previous knowledge. Adaptive learning systems therefore incrementally expose users to increasingly complex material after periods of interaction with the system (Brusilovsky and Schwarz 1997).
3.2.4 Approaches to AUIs Various methods and techniques exist which can be employed to adapt an AUI. The use of any technique depends on different factors, such as the type of adaptation, the goal of the adaptation or the information or data based on which the AUI is adapting. These methods and techniques were developed to overcome current limitations with traditional graphic UIs in tackling challenges such as (Alvarez-Cortes et al. 2007): 1. Creating personalised systems; 2. Taking over tasks from users; 3. Reducing information overflow; and 4. Providing assistance with complex systems.
55
Adaptive User Interfaces and User Expertise
The following sections outline two broad approaches to UI adaptation.
3.2.4.1 Artificial intelligence approach The adaptation of information to the user requires that the system learn pertinent information about the user and the environment in which it is operating. For this purpose, artificial intelligence (AI) techniques are required that range from the relatively simple rule-based systems to the more complex Bayesian networks that are sometimes employed (Alvarez-Cortes et al. 2007; Tomlinson et al. 2007). The techniques used involve learning user behaviour with the aim of adapting the UI based on inferences made using knowledge acquired by monitoring users (Tomlinson et al. 2007). One technique however, has gained popularity in recent times. Machine learning has been applied effectively in various applications and domains such as information filtering, information retrieval and recommender systems (Alvarez-Cortes et al. 2007). This approach has gained acceptance, especially in web-based systems, because it is used to collect and mine complex interaction and navigation data (Alvarez-Cortes et al. 2007).
3.2.4.2 User modelling approach The proliferation of interactive systems has increased research into human computer interaction. The HCI approach focuses predominantly on how information is presented to the user (AlvarezCortes et al. 2007). The user model approach consists of an AUI which displays adaptations made by software components of the system. Figure 3.4 illustrates the user modelling process. It is sometimes referred to as a cycle because information travels through the different components in a cycle. As the user interacts with the system, data is collected about the user and stored in the user model. The system then uses this information to adapt itself (adaptation effect). It then continues to monitor the user for any changes in behaviour.
56
Adaptive User Interfaces and User Expertise
Figure 3.4: Brusilovsky‘s (1996) loop for ―user modelling adaptation‖ in adaptive systems
3.2.5 Components of adaptivity The premise behind AUIs is that users are different and therefore users have different requirements from the UI (Van Tonder 2008). For the system to adapt, some information about each user must be known. User models are perhaps the most important components of AUIs because they store information about the user; however, they are not the only kind of model employed by AUIs. Task models, are another important component of AUIs. The user and task models are not always sufficient for adaptation. There exist other models that can complement the user models and task models. Domain and system models allow AUIs to store knowledge about its domain and itself, thereby enhancing the adaptation process. Domain models store the AUIs domain information, while the system model stores system-specific information. This allows the system to (for example) determine the best timing strategies, and adaptations, as it knows its own capabilities. Oppermann (1994a) identifies three components of adaptivity: 1. Afferential component: this is concerned with the acquisition and storage of userinteraction data; 2. Inferential component: this is concerned with analysis of data to make inferences on how to adapt; and 3. Efferential component: this is concerned with modifying the system by adapting. Figure 3.5 is an overview depicting the general schema of an AUI. Oval shapes represent input or output, rectangles represent processing, while the cylinders represent storage. The dotted
57
Adaptive User Interfaces and User Expertise
arrows represent the usage of information, while the solid arrows represent production of information. (Jason 2008). The afferential and inferential components are also highlighted in the overview to show which component manages the aspects depicted in the schema.
Afferential Component Inferential Component
Figure 3.5: General Schema for processing an AUI (Jameson 2003)
3.2.5.1 Afferential component An AUI is only capable of adapting itself once it has acquired data about the individual users. The afferential component of adaptivity is responsible for acquiring the user-related data during the user-interaction process (Oppermann 1994b). The afferential components responsibility with respect to user-interaction data is twofold: acquisition and storage. The acquisition of user-interaction data is achieved explicitly or implicitly. Explicit data collection requires the user to input the necessary information. It does not usually involve collecting user-interaction data, but rather user characteristics or preferences. Self-reports and user evaluations on objectives are methods used to collect the data. Although explicit data acquisition occurs relatively infrequently, it is fairly demanding on the user as a large amount of data is usually collected (Ross 2000; Jameson 2003). Implicit data collection records user-interaction covertly, that is, by monitoring the user‘s interaction with the AUI. It does not generally require users to supply vast amounts of information about themselves directly, in order for the system to adapt. The AUI may collect data during the user-interaction with the AUI. For example, mouse movements and other task-
58
Adaptive User Interfaces and User Expertise
related interactions can be captured to reveal patterns which may indicate how the AUI can adapt. Alternatively, past user-interaction is analysed to reveal patterns about a user‘s interaction with the AUI. For example, in a web browser, previously visited sites could be analysed to reveal a users web-usage patterns. There are however, limitations to implicitly collecting data. Data collected implicitly are not always easy to interpret (Jameson 2003). Furthermore, the analysis of previously stored information might yield results that are not helpful during the user-interaction process. Such information is however useful at the start of the user-interaction process. The data collected must be stored for analysis. The most common method of storing such data is by using models. AUI‘s generally utilise the task, domain, system and user model to store this information (Krogsaeter and Thomas 1994). The user model is one of the most critical components when adapting the UI because it models user characteristics which the AUI uses to adapt (Krogsaeter and Thomas 1994). These models are discussed in further detail in the following sections.
3.2.5.1.1 Task model The task model is used to define or store task-related information. There are two types of task models, namely: dynamic task models and static task models. Dynamic task models are dependent on the user. The users‘ goals are inferred based on their current activities and the task model is constructed during interaction. This allows the system to perform functions such as completing routine tasks or taking over tasks. This is similar to some aspects of user modelling however the user is replaced with a task (Ross 2000). Static task models on the other hand are defined during the design process. They cannot therefore be altered at run time. Static task models define the specific activities the user can perform with the system (Krogsaeter and Thomas 1994).
3.2.5.1.2 Domain model The domain model represents the real world domain to which an AUI is applied. Real world knowledge pertaining to the domain in which the AUI can be applied is stored within the domain model (Reichenbacher 2003).
59
Adaptive User Interfaces and User Expertise
3.2.5.1.3 System model The system model allows a system to store information about itself such as its capabilities and features in order to better infer how to adapt. When an interactive system is aware of its capabilities, it is better able to establish dialogue with the user so as to collect user data and infer the best possible ways of adapting itself based on its capabilities (Reichenbacher 2003).
3.2.5.1.4 User model The user model is a critical component of any AUI. For any adaptations of an interactive system to be meaningful the system must have knowledge about the user, understand (to some degree) the user and his/her needs, preferences and goals and adapt itself to match these traits. This knowledge is stored in the user model. As this is a critical component, for the purposes of this study a concrete definition of the user model is required. Jason (2008) defines a user model as: ―...an abstract representation, which contains a collection of information and explicit assumptions about an individual user (as well as a user group) on relevant aspects of the user, which is needed in the adaptation processes...‖ This definition is well suited to the purposes of this research since it shows how the user model is different from user modelling techniques (which are commonly cited as alternatives to user models), such as user profiles and personas. User models are abstract and they represent the characteristics which differentiate users, while user profiles are instances of the user model of an individual user. User models can be classified depending on various dimensions. Ross (2000) outlines four dimensions for the classification of user models:
What is being modelled: individual users, groups, personas, stereotypes?
The source of the modelling information: explicit or implicit data collection;
The model update methods: whether the model static (predefined) or dynamic (regularly updated); and
Time sensitivity of the model: specific information for short term usage or generic information for long-term usage.
60
Adaptive User Interfaces and User Expertise
The knowledge of what is being modelled affects the structure of the user model as well as the user modelling process. Modelling stereotypes, for example, requires the categorisation of users by stereotype (e.g. novice or expert) (Rich 1998). Identifying the source of the modelling information and the update methods for the user model will determine whether user observation is necessary. Explicit acquisition of user information does not require user observation; neither does a static user model require updating. In such situations, adaptations occur based on the static information (Van Tonder 2008). User models are also time sensitive. The domain of the AUI therefore affects the time period most appropriate for the user modelling process, that is, are the user‘s modelled in real-time, over a short period of time, or for extended periods (e.g. months or years).
3.2.5.2 Inferential component The inferential component of adaptivity deals with making inferences about how to adapt the system by analysing the user-interaction data acquired and stored by the afferential component. In simple terms, the inferential component is responsible for turning user-interaction data captured during the interaction process into knowledge about the user. This process is known as user modelling. Previously, Figure 3.4 showed the user modelling process. User modelling consists of managing user profiles, including the creation, updating and deleting of profiles. Zukerman and Albrecht (2001) identify two main approaches to user modelling: 1. Content–based Learning: in which adaptations are performed from observed userinteraction data. User-interaction data must therefore be collected before adaptation can occur (Van Tonder 2008); and 2. Collaborative Learning: in which adaptations are performed from the user-interaction data of similar users to those of the current user. The approaches above can be used in various user modelling techniques. Some techniques are simple and require little information, while others are more complex. Stereotyping is a relatively simple technique for user modelling. Users are categorised into user groups to facilitate processing at run time. Interactive systems that use this approach make use of use triggers. The system uses these triggers to determine the stereotype to which a user belongs
61
Adaptive User Interfaces and User Expertise
(Kules 2000). The stereotype modelling technique uses rules based on user theory to model users (Jameson 2003). Three elements are required for the use of stereotypes (Kobsa 2004): 1. User groups: user groups with different characteristics must be identified; 2. User group characteristics: characteristics that differentiate the user groups must be identified; and 3. Representation of stereotypes: the characteristics must be formally defined in an appropriate representation system (Jason 2008). Hierarchical structures are usually the most appropriate, as these allow for the definition of various subsets of stereotypes. Groups that share a subset of characteristics can inherit from a super-group with those same characteristics. There is some criticism of the use of stereotypes. Some researchers believe users are too diverse to be labelled by a stereotype. There is also the risk of modelling users under the wrong stereotype. This can happen when, for example a user exhibits characteristics of a different stereotype from the stereotype to which they actually belong. Decision-theoretic modelling uses knowledge concerning users, their goals and the environment in which the system is operating to make inferences about the user. Techniques in this category tend to be complex, as they are not heavily data-dependent. This however, gives it the advantage of not requiring a user model in order to adapt. Examples of such techniques include Bayesian networks and Hidden Markov Models (HMM).
3.2.5.3 Efferential component The efferential component of adaptivity specifies how a system should be adapted. This is achieved by acting on the information stored within the knowledge base. However, it must still be decided when and how the adaptation occurs. Dieterich et al. (1993) identified three timing strategies to asses when adaptation should occur during an interaction session. These are:
Before a session begins;
After a session ends (i.e. between sessions); or
During the interaction session.
62
Adaptive User Interfaces and User Expertise
Adaptation at the beginning of a session requires that users be classified prior to the interaction process. This can be done using pre-tests or questionnaires. Users‘ needs may, however, change during the course of interaction, which makes this timing strategy naive (Jason 2008). Adaptation during interaction refers to adaptation taking place continually during the interaction process. This strategy is suitable for continually updating the users‘ changing needs; however, it can lead to confusion for users. Adaptation between sessions facilitates complex adaptations by allowing adaptation to occur at the end of each session, in preparation for the next. This strategy however becomes insignificant when the period between sessions is very long. The purpose of a UI is to present information and provide a means for users to interact with an application‘s underlying functions. Adaptation can, therefore, take place at four different levels (Oppermann 1994a; Jameson 2003): 1. Presentation adaptation: The presentation of information is adapted. For example, to display information in such a way as to convey its importance by altering the colour, size or shape of text in order to highlight important aspects; 2. Information adaptation: Information is adapted to suit the characteristics of the various users. For example, information filtering to present only relevant information to specific users; and 3. User Interface adaptation: User interface artefacts such as menus, buttons and icons are moved or hidden to suit the unique traits of users. 4. Navigation: System navigation is adapted to suit the users‘ individual characteristics. The methods discussed attempt to predict what a user wants or is trying to achieve, and somehow to adapt to give the users what they want, or allow them to do what they want. Regardless of the chosen user modelling technique and adaptation, the goal of AUIs must always be to achieve results with which users are satisfied (Jameson 2003; Jason 2008). There are, however, various challenges in trying to realise this ideal. These are discussed in the next section.
63
Adaptive User Interfaces and User Expertise
3.2.6 Challenges in AUIs Despite the clear advantages of AUIs over traditional static UIs, they are not without challenges. Jameson (2003) summarises the following usability challenges faced by AUIs: 1. Predictability and transparency: Users must, to some degree be capable of predicting the repercussion of their actions (Jameson 2003; Paymans, Lindenberg and Neerincx 2004; Gajos 2008; Jason 2008). Complex inferences, lack of transparency, and wayward adaptations can all confuse the user; 2. Controllability: A function of AUIs is to ‗take over routine tasks‘ (Section 3.2.3). Data for this adaptation are usually collected implicitly; users do not see when or how the data are collected, therefore, they would not be able to interfere with this process. This takes away control from the user (Hook 2000), which goes against the usability guideline of user control and freedom; 3. Unobtrusiveness: Sudden adaptations or attempts to inform the user of an event could easily distract the user from any current activities; 4. Privacy: Personalisation of UIs requires that user information be collected. Information to identify users uniquely is also collected and this may raise concerns as to how the information is going to be used; and 5. Breadth of experience: an AUI that takes over a task and attempts to facilitate userinteraction must first perform an analysis and some form of learning on the application domain. This limits the user‘s exposure to this information, and therefore the user‘s breadth of experience. Overcoming these challenges is not a trivial task. Nevertheless, they can be managed. The previous sections discussed AUIs, the components of AUIs and challenges faced by AUIs. The following section discusses a popular application domain of AUIs: User Expertise. Users have been shown to behave differently, based on their level of expertise with an application or domain. AUIs can thus be applied to cater for users exhibiting different levels of expertise.
3.3 User expertise and user interfaces A major component of this study involves understanding UI design, as it applies to differences in user expertise. Research shows that user expertise can be classified based on two criteria: a
64
Adaptive User Interfaces and User Expertise
user‘s knowledge of a system and time spent using that system (Prumper et al. 1991; Wu 2000; Jason 2008). These criteria can be decomposed further into three dimensions: 1. Experience with the system; 2. Experience with computers in general; and 3. Experience with the task at hand. Experience with the system refers to the application software, and the degree to which the user has used similar applications. Experience with computers in general refers to the user‘s computer literacy. Experience with the task at hand refers to user‘s experience with the task the system will be performing. Novice and expert users have been shown to exhibit different ways of thinking, and these are defined as qualitative differences. Novice users exhibit fragmented conceptual models of the system, and are concerned with how to accomplish tasks (Buxton, Kurtenbach, and Sellen 1993). Expert users, in contrast, exhibit a consolidated model of the system‘s inner workings and are able to infer new knowledge to achieve their goals.
Figure 3.6: Dimensions on which users experience differ (Nielsen 1993)
The most common use of the term expertise however, is when referring to a user‘s experience with a particular UI (Jason 2008). Figure 3.6 illustrates the relationship between the criteria given above for the classification of user expertise. A change in a user‘s experience with
65
Adaptive User Interfaces and User Expertise
computers and knowledge will necessarily affect the classification of a user as an expert or novice user of a system. Research has shown that novice and expert users behave differently (Hurst, Hudson and Mankoff 2007). These differences can be classified qualitatively or quantitatively.
3.3.1 Qualitative differences Qualitative differences in expertise refer to the exhibited differences in how novice and expert users think about their tasks. As previously mentioned, novices are more concerned with how to accomplish tasks; as opposed to how quickly tasks can be completed. Expert user thinking is very different from that of novices. They have vastly more knowledge than novices and given a large amount of task information, can quickly deduce goals and actions to achieve those goals (Jason 2008). Galitz, (2007) compares the characteristics that novice and expert users exhibit according to the different criteria. Table 3.2: Differences between the Novice and Expert‘s ways of ―thinking‖
Conceptual Model Knowledge
Novices
Experts
They have a fragmented conceptual model of the system Their knowledge is ordered less meaningfully, orienting it towards surface features of the system
They have an integrated, conceptual model of the system; Their knowledge is ordered more abstractly and more procedurally
Organisation
They structure their information into fewer categories
Information is organised more meaningfully, orienting it towards their task; and they structure their information into more categories
Inferences on new Knowledge
They have difficulty in making inferences and relating new knowledge to the objectives and goals
They have a better ability to make inferences and can relate new knowledge to their objectives and goals
Attention
More attention is paid to low-level details and to surface features of a system.
Less attention is paid to lowlevel details and surface features of a system.
Table 3.2 shows the differences between novices and experts based on these criteria. Novice users of a system tend to show a fragmented conceptual model of the system. They find it difficult to connect the different functions of a system in order to achieve a goal. Consequently, they take longer to achieve any goal using the system. Experts, on the other hand, have an
66
Adaptive User Interfaces and User Expertise
integrated conceptual model of the system and can easily link functions in order to achieve their goals. The comparison of knowledge, organisation, inferences on new knowledge and attention between novice and expert users, shows the same type of differences between: experts are organised and understand the system, while novices are concerned with the surface features of a system.
3.3.2 Quantitative differences Quantitative differences in expertise refer to measurable manifestations of users actions based on their qualitative differences (Hurst et al. 2007). Research has have shown that not only do expert users have better performance than novice users when achieving task goals but novice users require more operations to achieve those goals (Dillon and Song 1997; Oka and Nagata 1999). Expert users are also capable of making faster menu selections compared with novice users, given that experts are more capable of recalling where menu items are. Novice users must still discover where the menu options are (Jason 2008). As a result novices and experts can be identified by their searching mechanisms. These differences have consequences for design and are discussed further below.
3.4 Designing user interfaces for novice and expert users Novices can be categorised as users that are new to a UI, based on the qualitative and quantitative differences. The design implications of the differences discussed above are illustrated in Figure 3.7. This figure shows the spectrum of user needs for novice and expert users. The design of UIs to accommodate both types of users must allow novice users to achieve their goals, but manage this so it is not at the expense of expert users (Jason 2008). Crow and Smith (1993) designed two separate UIs for novice and expert users, rather than accommodating both users on a UI. Multi-layered UIs facilitate Crow and Smith‘s (1993) approach by layering the UI. Users are gradually exposed to interactive system functionality as they gain experience using the system.
67
Adaptive User Interfaces and User Expertise
Figure 3.7: The Spectrum of Users‘ Needs (Padilla 2003)
Figure 3.8 illustrates the concept of multi-layered UIs. Initially (Figure 3.8 A), common commands are shown above the text area, in full view of any user who is unfamiliar with the system being used. Once the system deems the user to be knowledgeable enough in regard to the system, it affords such a user an extra layer of functionality and control Figure 3.8 (B).
A
B
Figure 3.8: Layered user interface: Layer 1(A) and Layer 2(A) (Shneiderman 2003)
3.5 Related works In this section, existing related work on IUI and AUI models will be discussed. The discussions examine work done in the Department of Computer Science at the Nelson Mandela Metropolitan University in the development of intelligent models for contact centres.
68
Adaptive User Interfaces and User Expertise
3.5.1 An IUI for contact centres AUIs are a subset of IUIs (Section 3.2.1) therefore Models for IUIs have key components that are part of AUIs (Jason 2008). Singh (2007) investigates IUI models for the development of an IUI model for contact centres (CC). The result of this investigation was a three element model which addressed the architectural, component and interface elements for an IUI (Figure 3.9) (Singh 2007). The architectural component of Singh‘s (2007) model is based on the Tyler et al. (1991) model for IUIs. Components of this model include (Singh 2007): 1. Input/Output (I/O) Manager: this component is responsible for the acquisition of userinteraction data and the presentation of adaptation or information to the user; 2. Plan Manager: this component is responsible for determining the plans or goals of users by comparing low level input data from the I/O manager against values held by the task manager in order to infer the plans and goals of the user. The task manager is discussed in Section 3.2.5.1; 3. Knowledge base: this component is responsible for the storage of application, domain and communication knowledge as well as task information. The knowledge base is a key component of IUIs because it stores all information on which intelligent inferences are made in IUIs. AUIs use the knowledge base to store information on which inferences are made for adaptation. The IUI model in Singh (2007) specialised the knowledge base for contact centres; 4. Adapter /Agent Manager: this component is responsible for the updating or retrieval of information from the knowledge base, based on the interaction with the plan manager; and 5. Presentation Manager: in the IUI model of Tyler et al. (1991) IUI model, this component is responsible for determining the most suitable modality to display user information. In an AUI, this model is responsible for determining how best to adapt the UI based on the user specifications. Singh‘s (2007) model for IUIs consists of two other elements, namely the component level element and the interface level element. The component level element stores user task and solution models in the knowledge base. The interface element provides a template design which specifies sections of the presentation of task-based information, user input and system feedback.
69
Adaptive User Interfaces and User Expertise
Figure 3.9: IUI Model for Contact Centres (Singh 2007)
A proof of concept was implemented and its evaluation showed that the proposed model could be used to develop IUIs for contact centres. An AUI for contact centres was developed by Jason (2008) using aspects of the IUI model in Singh (2007). This research will be discussed in the following section.
3.5.2 An AUI for contact centre agents In a Contact Centre (CC) the goal is to resolve customer queries. Once a query is initiated, the typical steps performed to resolve the query include (Jason 2008): 1. Capture customer details; 2. Capture call details; 3. Assign the call; and 4. Provide the call resolution details. Jason (2008) successfully developed an AUI for Contact Centre Agents (CCAs), dubbed Adaptive HelpDesk, to improve the CCA performance when performing the call resolution steps (hereafter referred to as Call Logging steps). Figure 3.10 shows the AUI model proposed by Jason (2008) to achieve this. The AUI model for CCAs has the same architecture component used by Singh (2007). The architecture component (hereafter referred to as the IUI architecture), was discussed in detail in Section 3.5.1. It was modified to address the original IUIs (Tyler et al. 1991) inability to infer a user‘s goals (Singh 2007). In addition to the architectural component, Jason‘s (2008) model includes an AUI Component Design and an Interface Design component (Figure 3.10). The AUI component of the model
70
Adaptive User Interfaces and User Expertise
consists of the components of adaptivity which were discussed in Section 3.2.5. Together, these components provide for adaptation of the UI. The components of adaptivity that Jason‘s (2008) model support are:
The Agent Manager: this component satisfies the afferential component of adaptivity;
The Presentation Manager: this component satisfies the efferential component of adaptivity;
The Analysis Engine: this component satisfies the inferential component of adaptivity; and
The Knowledge Base: this contains the User and Task Model. It is part of the afferential component of adaptivity.
+
+
Figure 3.10: An AUI Model for Contact Centre Agents (Jason 2008)
The Agent Manager, Presentation Manager and Knowledge Base are components of the IUI architecture. Because AUIs are a subclass of IUIs, components of IUIs also supports AUIs and
71
Adaptive User Interfaces and User Expertise
are, in consequence, included in Jason‘s (2008) model for AUIs. This model is discussed in more detail in the following sections.
3.5.2.1 Knowledge base The knowledge base implemented by Jason (2008) consists of two components, namely, the user model and the task model. The user model and the task model allow the AUI to be specialised to CCs by incorporating CC knowledge into the Knowledge base (Singh 2007; Jason 2008). The Knowledge base therefore stores the following information which is necessary for the AUI:
Customer query information;
Customer query information;
User models of the CCAs using the application; and
Task model relating to the tasks of logging customer calls.
The user model is a critical component of AUIs because it holds information about the user that is needed for adaptation. Jason‘s (2008) user model resides in the Knowledge base and consists of Information Moments (IM) and Predictive Features (PF) associated with that IM. Hurst et al. (2007) propose the use of IM to measure user performance. Hurst et al. (2007) define IMs as ―user actions which can be readily isolated, are indicative of the phenomena they wish to study, model or predict, and can be easily and accurately labelled‖. The PFs are not taskspecific, nor are they based on a task model since they are low-level data. These characteristics allow PFs to be used effectively in different applications. The Call Logging task was found to be list-intensive, that is, a large number of selections had to be made from list options, and as such, the PF approach is suitable for CCA performance measurement. Of the different possible IMs, Jason‘s (2008) study chose to have an IM represented as a list. Essentially, the PFs are metrics which measure the performance of users when they make list selections. Each IM has 10 PFs associated with it. Figure 3.11 shows the PFs captured for each IM and Table 3.3 provides a summary of the PFs for a list selection action. The Keystroke Level Model (KLM) can be constructed from the data of an IM. The Keystroke Level Model (KLM), as used by Jason (2008), is derived from Hurst et al. (2007). The KLM
72
Adaptive User Interfaces and User Expertise
specifies a detailed and task-specific model for expert behaviour. Expert users‘ performance is presumed to fall close to or above the KLM. Total Time
Average Dwell Time
YMouse Velocity
Nr. Items Visited
YMouse Acceleration
Unique Items Visited
Dwell Time
Selection Time
KLM Ratio
KLM Difference
Informative Moment
Figure 3.11: Potential Predictive Features
Table 3.3: Summary of Predictive Features
Predictive Feature
Description
Low-Level motion characteristics Cumulative total time spent selecting an item from a list. Total Time It stores the total of all selection times for a list action. Average velocity, on the vertical axis (Y-axis), of the Ymouse Velocity mouse during a list selection action.
Unit Seconds Pixels / second
Ymouse Acceleration
Average (unsigned) acceleration, on the vertical axis (Yaxis) of the mouse during a list selection action.
Change in velocity / second
Dwell Time
Time spend without movement during a list selection action.
Seconds
Interaction Technique Average Dwell Time
Average dwell time during a list selection action.
Nr. Items Visited
Total count of items visited during a list selection action. Total count of unique items visited during a list selection action. Elapsed time for a list selection action.
Unique Items Visited Selection Time Performance Models KLM Difference KLM Ratio
Difference between the Keystroke Level Model (KLM) predicted selection time and the actual selection time for a list selection action. Time for a list selection action as a ratio of the KLM.
Seconds / No. Items visited Count Count Seconds
Seconds Dimensionless
73
Adaptive User Interfaces and User Expertise
Nine IMs are used and each belongs to a step in the Call Logging task. Figure 3.12 shows the IMs and the Call Logging step to which they belong, for example the Capture Customer Details step has one IM: IM Search Customer, while Assign the Call has two IMs: IM Campus and IM Cause. Capture Customer Details
IM Search Customer IM Service Name
Capture Call Details
IM Call Type IM Priority IM Source
Assign the Call
Provide Solution Details
IM Campus IM Contact IM Cause IM Resolved
Figure 3.12: Informative Moments and the Corresponding Logging Steps (Jason 2008)
The Task Model consists of representations of the tasks that users can perform with a system. AUIs are able to recognise a user‘s goals using a task model. The task model used by Jason (2008) provides task support in two forms: task status information and error checking. Users are shown where in the Call Log process they were at any given time. Errors are also shown to CCAs based on incomplete task information.
3.5.2.2 Analysis engine The analysis engine in Jason‘s (2008) CCA model performs the critical role of user modelling This is achieved by using information from the user models to obtain and infer information about users. By performing the user modelling of users, the analysis engine fulfils the role of the inferential component of adaptivity. T-Scores are used to determine the performance of users. This is achieved by calculating a single performance value for each of the nine IMs from the PFs. Each PF is, however, expressed in a different unit of measure (e.g. seconds). In order to arrive at a single value, T-Scores were used to standardise the PF values but to determine the T-Score, a Z-Score must first be calculated for the PF. The Z-Score is a linear transformation of the values, while the T-Score shows how far a
74
Adaptive User Interfaces and User Expertise
Z-Score lies from the mean by using its standard deviation. The formula for calculating the ZScore is: Z-Score = (x-μ) / σ Where, x = the score to be transformed (raw value) μ = the mean of the distribution of those scores σ = the standard deviation of the distribution of those scores The T-Score is then calculated by substituting the Z-Score value in the following equation: T-Score = μ + σ * (Z-Score) Where,
μ = the mean σ = the standard deviation The PFs are then assigned positive directions to ensure that they move in the same direction (negative values are multiplied by -1 to make them positive). This is done because the T-Scores need to be averaged later and this requires that they be moving in the same direction. Finally, the IM T-Score is determined by calculating the weighted mean of PFs using the following formula: IM T-Score = weighted mean of PFs = Σ Wi Ti / (ΣWi) Where, Wi = weight of PF Ti = T-score of PF The weights are determined by first ranking the PFs in their order of importance and then inversing the PFs value rank. Table 3.4 shows the PFs, their ranks, and the final weights. Table 3.4: Predictive Features and their associated weights (Jason2008)
1 2 3 4 5 6 7 8 9 10
Predictive Feature
Rank
Weight
Total Time Y Mouse Velocity Y Mouse Acceleration Dwell Time Average Dwell Time Nr Items Visited Unique Items Visited Selection Time KLM Difference KLM Ratio
1 9 9 2 3 6 7 3 5 8
1 0.11 0.11 0.5 0.33 0.167 0.143 0.33 0.2 0.125
The T-Score for the user‘s performance is then determined by applying weights to the nine IMs
75
Adaptive User Interfaces and User Expertise
and the Total Task Time for a task by inversing their ranks. Table 3.5 shows the IMs, their ranks and associated weights. Table 3.5: Informative Moments and Associated Weights (Jason 2008)
1 2 3 4 5 6 7 8 9 10
Informative Moments and Total Task Time
Rank
Weight
Total Task Time Search Customer Service Name Call Type Priority Source Campus Contact Cause Resolved
1 8 2 2 9 10 5 5 4 5
1 0.125 0.5 0.5 0.111 0.1 0.2 0.2 0.25 0.2
3.5.2.3 Agent manager The function of the Agent Manager in IUIs is to update the user model with information received from the plan manager (Section 3.5.1). This allows the UI to be modified according to the user‘s needs. Jason‘s (2008) AUI model caters for this by providing this functionality in the Watcher component as is illustrated in previously shown model in Figure 3.10. The function of the Watcher component is to acquire user-interaction information from the interaction between the application and the user. This is achieved implicitly by observing the user‘s actions. Information regarding the user collected through this component is stored in the user model.
3.5.2.4 Presentation manager The Presentation Manager decides how the UI is to be adapted to best suit the user‘s needs. This is achieved by using the input from the agent manager and knowledge from the knowledge base. Jason (2008) refers to this component as the Adaptation Effect. The adaptation effect serves the same role as the presentation manager which is to determine how best to adapt the UI to match the user‘s behaviour. Information used to make this inference is acquired from the knowledge base. Various adaptations at different levels could be provided by the following components:
Information;
Presentation;
76
Adaptive User Interfaces and User Expertise
User Interface; and
Functionality.
The adaptation effect uses the Interface Design component to adapt the UI. The interface-design component of the model is a multi-layered UI which consists of two layers, namely the novice layer and the expert layer. The novice layer caters for novice users and the expert layer caters for expert users. Both UIs support the same task; however the UI design for each UI is different. The novice layer consists of a series of steps designed in a wizard-type interface with a separate screen for each step. This allows novice users to familiarise themselves with the interface and the task. The expert layer is not restricted in a step-by-step manner, thus allowing users to perform more effectively. Instead, experts are able to navigate the tasks using tabs. Up to this point, adaptation to the presentation layer that has been discussed as it deals with the adaptation of the components of the UI. Some adaptations, however, generate entirely new interfaces to suit the user‘s preferences. The following section summarises research in this area.
3.6 Adaptive user interface generation Gajos (2008) argues that traditional manual UI design does not scale with constantly changing user contexts, appliances, platforms, tools, experiences, skills and needs. He et al. (2008) argues that, currently, redesign of the UI is necessary, whenever user requirements change or a new device or platform is introduced. He et al. (2008), therefore, proposes adaptively generating the UI as a means of overcoming this. Figure 3.13 shows SUPPLE, an AUI developed by Gajos (2008) which adapts to the computing platform and to users‘ preferences for input and motor skills. The different screens shown were rendered from a single task definition. This type of adaptation is based on the multi-layered approach. However, the different layers are not simply augmented at the different layers. Instead, entirely new interfaces are generated to suit the different preferences or characteristics of the various users.
77
Adaptive User Interfaces and User Expertise
Figure 3.13: Automatically rendered interface for five different platforms (Gajos 2008)
He et al. (2008) propose a similar approach to that of Gajos (2008), although their approach operates in a distributed web service environment where the UI elements are created using cost functions. The cost functions are determined by the users preferences, and each generated UI element is evaluated to determine the degree to which generating this element in a specific way deviates from the particular user‘s preferences. He et al. (2008) have introduced the Object Layout Hierarchy (OLH) in their work on the dynamic generation of UIs for web services. This component defines how the elements in a WSDL are related, and by implication, how the elements in the generated UI are related. The relationships are defined as nested groups and a parent-child relationship is thus created. Elements that are the same reside in the same group. Child elements within a group belong to the parent element in which they reside. The OLH component is important as it allows related UI elements to be grouped together without any specific declaration of the positions of the elements. For example, an application which processes a WSDL considers ―home address‖ and ―work address‖ as two unrelated elements. However, by using the OLH, such similar terms can be defined as ―addresses‖, thereby prompting the placement of these elements closer together in the UI.
78
Adaptive User Interfaces and User Expertise
3.7 Summary The aim of this chapter was to answer research question R2: What are AUIs and what are the components of an AUI? This chapter achieved the objective by investigating the functions of AUIs and by determining that the components of an AUI are the afferential, inferential and efferential components. This was achieved through a review of existing literature on AUIs. an understanding of what AUIs are and the components required to implement an AUI. The increased complexity of software applications has resulted in an increased complexity of UIs of these applications. Furthermore, an increasingly diverse population is making use of computer applications. UIs do not cater for these users‘ differences and AUIs have been proposed as a solution for this problem. The literature shows that AUIs can increase the flow of information between humans and computers by adapting themselves to suit the needs, preferences and traits of different users. AUIs are capable of, for example, completing mundane tasks in order to save users time and allow them to complete more critical tasks. The afferential component is responsible for capturing user-interaction data and storing it in the knowledge base in order to learn more about the user. Various methods and techniques are applied to learn more about users and to provide meaningful adaptations; for example, machine learning uses complex algorithms to make inferences about what a user may want to do next in an application, while stereotyping classifies a user based on a predefined set of characteristics defined for the particular stereotype. This function is performed by the inferential component. Finally, the efferential component decides how adaptation should occur. Depending on the capabilities of the AUI, the efferential component can alter various aspects of the UI to suit the user. It can, for example, alter the layout of information, or change the controls used to interact with the UI. Application users differ in a variety of ways, such as experience in using applications. This is referred to as user expertise. Users with different levels of expertise have been shown to differ in the way they think and their approaches when it comes to performing tasks. These differences can be classified qualitatively or quantitatively. In addition, these differences have design implications for UIs. AUIs cater for such differences between users. For example, Adaptive
79
Adaptive User Interfaces and User Expertise
HelpDesk is an application that has been used to increase the performance of novice CCAs by monitoring low-level user-interaction data such and modelling it using the KLM. Existing AUIs, concerned with user expertise have not however been implemented using a SOA and web services. AUIs that use distributed architectures are focused on adapting to device characteristics rather than user characteristics. They, however, use a generated UI approach to adapt the UI to users by effectively creating a new UI, when changing to meet user needs. An AUI can therefore be implemented using an SOA by generating UIs for users, based on their inferred levels of expertise. The following chapter proposes a service oriented analysis and design method which is applied to an existing AUI in a contact centre scenario. A model for AUI generation in service oriented architecture is the outcome of this method and it is discussed in order to show how an AUI can be designed using SOA.
80
Chapter 4: Service-Oriented Analysis and Design 4.1 Introduction Service-oriented architectures (SOA) and Adaptive user interfaces (AUI) were discussed in previous chapters (Chapter 2 and 3 respectively). SOA has been found to be an architectural style that advocates the design of computing systems using loosely coupled and reusable components. Web services are currently the most popular way of realising SOAs, and as such were discussed. AUIs were identified as user interfaces (UI) that adapt themselves to match distinct user characteristics. Three distinct components of AUIs exist, the afferential, inferential and efferential components, each of which plays a critical role in the how an AUI functions. This chapter aims to design an AUI using a Service-oriented (SO) method. This is achieved by answering research question R3: How can an AUI be designed using an SOA? The objective of this chapter is, therefore, to investigate how an AUI can be designed using SOA. In order to achieve this objective, a discussion on SO analysis and design methods (Section 4.2) is given in order to first establish existing SO analysis method and secondly to get an idea of how SOA analysis and design could be applied to an AUI. Due to the proprietary nature of some useful methods, a hybrid method is devised by combining two SO analysis and design methods. SO analysis (Section 4.3), SO design (Section 4.4) and realisation (Section 4.5) according to the hybrid method are discussed and subsequently applied to an AUI (Sections 4.6 and 4.7). The result of the hybrid SO analysis and design is a proposed AUI services model (Section 4.7.2). Service realisation of the model is discussed to determine how services identified using the hybrid SO analysis and design methods can be realised (Section 4.8). Finally, the AUI service model interaction is explained to show how the different service and the UI interact to adapt the UI (Section 4.9) and a summary of the Chapter is provided (Section 4.10).
4.2 SO analysis and design Section 3.5.2 discussed an AUI designed to improve the performance of contact centre agents (CCA). The model developed by Jason (2008) was found to contain all necessary components of
Service-Oriented Analysis and Design
an AUI. Furthermore, Jason‘s (2008) model included several component level elements such as screen design and task breakdown to assist novice CCAs in learning how to use the UI. The architecture used to develop Jason‘s (2008) model is a client/server architecture. The application logic is deployed on a client computer, and a database storing the user model and domain models is deployed on a server. The architecture used in this study however, is SOA. The purpose of this section is to discuss existing methods in SO analysis and design. The best method to use in this study will be proposed. The design of an SOA without the use of a sound methodology or guidelines runs the risk of failure because it is not understood how the design should be carried out (Erl 2009; Patig 2009). Service-oriented analysis is a way of defining business automation requirements as loosely coupled and agnostic services or Services-Orientation (Erl 2005). The objective of SO analysis is to obtain requirements for potential candidate services. Candidate services are defined as business processes or units of logic that have reusable, agnostic and independent (of other processes or system logic) characteristics. Essentially, these components contain logic that has the potential to be abstracted as services (Erl 2005). Service requirements are obtained using various methods, which will be discussed later in Section 4.3. SO analysis is followed by SO design. While SO analysis involves identifying candidate services and modelling them to provide some functionality, SO design is the process of modelling the service candidates into useful applications (Terlouw 2009). The objective of service-oriented analysis and design is to identify suitable service candidates, to design and realise them. Various methods such as Service-Oriented Modelling and Architecture (SOMA), Service-Oriented Analysis and Design (SOAD), Service-Oriented Development of Applications (SODA) and Service-Oriented Unified Process (SOUP) exist to aid the identification, design and realisation of services (Arsanjani 2004; Zimmermann et al. 2004; Mittal 2006; Arsanjani et al. 2008). Table 4.1 shows a comparison of existing methods for developing SOA solutions by looking at specific characteristics of SOA development approaches, namely (Ramollari, Dranidis and Simons 2007):
Delivery strategy: Top-down (T), bottom-up (B) or meet-in-the-middle (M). Delivery strategies are discussed more in Section 4.3.1;
82
Service-Oriented Analysis and Design
Lifecycle coverage: Support for full SOA lifecycle or just phases (Planning, analysis and design, construction, testing etc.);
Prescriptive: Perspectives that specify phases, tasks deliverables, etc;
Proprietary: Availability of detailed specifications;
Agile: Use of agile methods to manage risks;
Existing process: Use of existing development processes such a Rational Unified Process (RUP) and eXtreme Programming (XP);
Existing techniques: Use of existing techniques such as Business-Process-Management (BPM) or Component-Based Development (CBD);
UML: Use of existing notations;
Applied in industry: Applied in industry to validate methodology; and
Consumer / Provider view: Developmental view of service design and implementation. Table 4.1: Comparison of SOA Development Methods (Ramollari et al. 2007)
Delivery strategy
Lifecycle coverage
M
A&D
M
A&D
RUP
-
SOA RQ
M
complete
RUP
-
CBDISAE
M
complete
-
-
SOAF
M
A&D and planning phases
NO
SOUP
M
complete
RUP XP
Papaz
M
complete
RUP
T
BPMN to BPEL Jones‘ SA
IBM SOAD IBM SOMA
Erl‘s
SOADM
Proprietary
Existing Existing process techniques OOAD, BPM
UML
Applied in industry
-
Extensively Extensively
-
Not Yet
-
A Case Study Not Yet
CBD, BPM
Not Yet
A&D
BPM
Not Yet
T
A& D and Implementation.
BPM
Not Yet
T
Initial Planning
Not Yet
The IBM SOMA approach and Erl‘s (2005) approach were selected as the development methodologies for the AUI services. SOMA is a proven approach used extensively in industry and its phases provide a solid analysis and design framework. It uses the RUP approach for the
83
Service-Oriented Analysis and Design
elicitation, design and implementation of services. RUP is software development process which defines, amongst other things, phases for the development of software (IBM 2007b). The goal of RUP is to provide a disciplined approach to software development thereby increasing team productivity and ultimately software quality. RUP is, however, a proprietary product and its most detailed specifications are not publicly available. Erl‘s (2005) Service-Oriented Analysis and Design Methodology (SOADM) fill this gap. SOADM provides detailed specification information where SOMA information is not available. Another benefit of SOADM is its vendor neutrality. It does not require specific or specialised vendor tools or assets to be used. The SOADM approach has also recently been updated with SOA modelling and design notation, based on the notations used in Erl (2008). Figure 4.1 (A) shows the analysis, design and development phases according to SOADM. These steps form the analysis and modelling component of the service-delivery lifecycle. SOMA prescribes similar steps but gives them different names: service identification, specification and realisation (Figure 4.1 B). The results of following these steps leads to the identification of service candidates, the design of services and their contracts and the development of the identified services. The following section discusses the SO analysis, design and implementation in more detail. Erl‘s
SOMA
Service-Oriented Analysis
Service-Oriented Design
Service Development
B A
Figure 4.1: Erl‘s (2005) service-oriented analysis process (A) and Arsanjani‘s (2004) SOMA (B)
84
Service-Oriented Analysis and Design
The following sections discuss SO analysis and design using a hybrid method This method is a combination of SOADM method and the SOMA method because, as previously mentioned, the SOMA method is proprietary and certain details are not made publicly available; therefore, combining it with SOADM provides details on specific aspects of SO analysis and design.
4.3 Service-oriented analysis The aim of the SO analysis step is to firstly identify which services must be built and secondly, to determine the logic that each service must encapsulate (Erl 2005). Figure 4.2 illustrates the analysis process used to achieve these aims.
Define Business Requirements
Identify Automation System
Model Candidate Services
Figure 4.2: Service-oriented analysis (Erl 2005)
4.3.1 Define business requirements This step involves the identification of services by defining the operational business requirements for candidate services. Once operations have been identified, they are grouped into logical candidates to form the basis of a service (Erl 2009). Service identification can be achieved in several ways: top-down, bottom-up or middle-out technique (Arsanjani 2004). These approaches are referred to as ―Service-delivery‖ approaches. The top-down strategy, sometimes referred to as domain decomposition, initiates the modelling and design process from a domain perspective (Erl 2005). The strategy entails breaking down a domain into its functional areas. These are often good candidates for services (Arsanjani 2004). This process generally results in high quality services, since the design of each service is carefully analysed. This results in services that align well with the business requirements (Johnston 2005; Arsanjani et al. 2008). However, it imposes a heavy burden on time and money because of the upfront design investment and this makes managers reluctant to use it in practice (Erl 2005).
85
Service-Oriented Analysis and Design
The bottom-up approach involves the analysis of existing systems to identify re-usable components that have the potential to be services (Arsanjani 2004). The focus here is on providing application-centric services that best suit the needs of an application (Erl 2005). Figure 4.3 illustrates the bottom-up approach to service identification and how the results of the steps are used in modelling and developing services. The first step involves analysing the applications service needs, then designing application services to meet these needs. Once the design is complete, the services can be developed and tested to ensure that they meet the application requirements. Finally, the services are deployed and are made accessible to the application. A disadvantage of this approach is that it sometimes results in simple create, read, update and delete (CRUD) services (Johnston 2005).
Figure 4.3: Bottom up strategy (Erl 2005)
The middle-out method ties services to business goals by identifying services based on the business goals (Arsanjani 2004). This approach provides a means of identifying which goals a service satisfies; and allowing the scope of the analysis to remain strictly within the boundaries of a project (Arsanjani et al. 2008). Hubbers, Ligthart and Terlouw (2007) outline various other methods of indentifying services from a business perspective. Most of these methods are a variation of the top-down or bottom-up analysis and identification technique. The meet-in-the-middle technique is an iterative process that uses a combination of the top-down and bottom-up approach in identifying services (Arsanjani
86
Service-Oriented Analysis and Design
2004; Terlouw 2009). Service identification is enhanced by first identifying core business processes, and then continuously analysing them to uncover possible service candidates.
4.3.2 Identification of automated systems This step is usually conducted on large SO solutions and is therefore not always necessary (Erl 2005). In essence, it involves a bottom-up approach to identify service candidates within the existing systems. The outcome of SO analysis is a set of candidate services. The process used to derive tangible service designs from the service candidates is the SO design process (Erl 2005). The physical service designs can then be pieced together to form business processes. The following section discusses SO design.
4.4 Service-oriented design The aim of SO design is to specify physical services and define interactions between them in order to realise business processes. This is achieved by modelling the service candidates into useful applications. The steps to SO design are illustrated in Figure 4.4.
Compose SOA
Design Business services (entity centric, application, task centric)
Design SO Business Processes
Figure 4.4: SO Design steps (Erl 2005)
4.4.1 Composing an SOA Composing an SOA is the first step in SO design. It involves (Erl 2005):
Selection of service layers: Large SOA solutions tend to be divided into service layers (Erl 2005) and the service layers are then used to represent groups of services that have similar characteristics as a result. This grouping is most commonly based on service models of the services (Section 2.3.1; Arsanjani 2004). Alternatively, it is done by the type of capabilities
87
Service-Oriented Analysis and Design
the services provide. It is important to identify which layers are necessary for a particular solution in order to logically separate services.
Positioning of the core standards: This step involves the selection of SOA-related standards that will facilitate the realisation of physical services (Section 2.3.2). Examples include the decision to use RPC or document-style messaging for an SOA solution or whether to use REST services (Section 2.4.1) or RPC type services.
Selection of the applicable SOA extensions: This step allows individual SOAs to be created (Erl 2005). Specifications such as WS-BPEL are used to orchestrate entire applications and processes thereby enabling the realisation of SO applications.
Composing an SOA therefore identifies the appropriate layers to include in an SOA. When this step is complete, candidate services must be allocated to the layers.
4.4.2 Design of Business Services The application of this step differs depending on the service model. Task services, utility services and entity services are designed and modelled using slightly different approaches. The reason for this is that the different service models (which reside on different service layers) have different properties. Task services, for example, are top level services that can invoke lower layers services to achieve a business function. A basic level of business knowledge, at least, is required in order to achieve this. The utility services, on the other hand, are purely agnostic and require no business analysis skills. At this stage, the identified services must also be specified. Service specifications provide information about a service that service consumers can use to evaluate a service and decide whether to use it or not (Zhang et al. 2005; Amsden 2007). The following section discusses service specification.
4.4.2.1 Service specifications Services must be formally specified once analysis has been completed and candidate services have been identified. A service specification defines a service and provides information about the service capabilities. This has several advantages. Firstly, service specifications form the basis for
88
Service-Oriented Analysis and Design
the creation of service contracts (Amsden 2007). Secondly, the service specification provides information for the implementation of candidate services. Services that have been implemented are referred to as physical services. Finally, the specifications allow different services to be developed independently from the specifications alone, since all the information required for the service to interact with other services is provided in the specification (Terlouw and Maarse 2009). Terlouw and Maarse (2009) propose a service specification framework to define services. The specification framework is shown in Figure 4.5. It contains three sections, namely, the Service Provider, the Service Function and the Service Usage. The Service Provider stores information on the entity responsible for the service. It is necessary to store a service‘s owner information, especially in cases where service responsibility may be delegated or shared. Service responsibility is shared when different people or organisations are in charge of different aspects of a web service. The Service Function section provides information about the capability that the service provides. A service type is provided for service classification purposes. These facilitate the searching for services by type. The service types can be defined by the service owner or by the registry supporting the services. The service type may, alternatively, be based on service models (Section 2.3.1). Information regarding the functions that the service supports is specified in this section. Input and output parameters required by the service are specified along with any message errors, preconditions or post-conditions of the service. Definitions of terms can be specified to avoid semantic conflicts between the service provider and the service consumer. The Service Usage section provides information on how to access the service. Information, such as the location of the service (the URL), the protocols needed to communicate with the service and the service version are included. The use of a service specification framework to specify the technical aspects of a service provides two distinct advantages. Firstly, all critical service information is captured. Secondly, all information is captured in a uniform and consistent manner. This is important, as it provides documentation on a service regarding the service capabilities, and makes the maintenance of the service easier, since its critical information is readily available. Furthermore, service specification
89
Service-Oriented Analysis and Design
provides information for realising services. Service realisation will be discussed in the following section.
Figure 4.5: Service Specification Framework (Terlouw and Maarse 2009)
4.4.3 Design of SO Business Processes This step defines the orchestration of services into meaningful applications (Erl 2005). The logic for the application can be formally expressed using XML languages, such as WS-BPEL or just BPEL. The services identified in the previous step can be combined in different ways to create new or different applications. Essentially, this step abstracts certain logic and responsibility that make web services abstract, agnostic and loosely coupled (Erl 2005). The completion of this step
90
Service-Oriented Analysis and Design
concludes the SO design phase. The SO design is followed by the service realisation phase which provides information on how services can be realised.
4.5 Service realisation A service‘s specification provides detailed information on how a service candidate can be implemented. Once specifications have been drawn up for candidate services the service must be realised and provided. Service realisation is the use of notations such as UML to show the design of services and how they can be implemented. An Implementation design is drafted in order to (Amsden 2007):
Decide which service providers will provide which services;
Design the service implementations; and
Assemble and connect service consumers and the providers required to model complete implementations.
Service realisation forms part of service provisioning. Service provisioning involves deciding exactly how services are to be realised. This decision is assisted by the use of a gap analysis to compare planned services with existing software implementations (Papazoglou and Yang 2002). The outcome of a gap analysis is a proposal to develop the services in-house, re-use existing software services or purchase web services. These outcomes can be one of several approaches being selected:
In-house development: Service analysis, design and realisation are performed by the organisation requiring the services;
Using adapters or Wrappers: Legacy systems or database functionality are both wrapped around service components to expose the legacy functions as services;
Outsourcing: Once a service is specified, the design and implementation are outsourced to a third party; and
Leasing/Purchasing/Paying: Services are leased from service providers and a fee is paid for every execution of the web service. This fee may be on a per-use basis, per subscription, per lease or for the lifetime of the service.
91
Service-Oriented Analysis and Design
This section discussed how services that have gone through the analysis and design phases can be realised. The next phase of this research is therefore to apply the process of SO analysis and design discussed in the previous sections to an AUI in order to realise AUI services.
4.6 Service-oriented analysis of an AUI The aim of the SO analysis is to identify services that can be built and, to determine the logic that each service must encapsulate (Erl 2005). This section discusses the approach taken to identify AUI services. SOA is a business-oriented architecture and it strongly advocates matching services with business requirements. The use of the term business is consequently found in SO analysis and design literature. In this study, the term business is used to refer to processes or artefacts that are specific to the domain in which they are applied.
4.6.1 AUI service identification Services can be identified by analysing scenarios. Scenarios give an idea of how services can be used in an application. The Adaptive HelpDesk for a Contact Centre (CC) developed by Jason (2008) provides the scenario for this study. This scenario is described in detail in Section 3.5.2 as well and later in Section 5.2. The bottom-up approach is used to identify services in this case since the scenario describes the interaction of AUI components. The existing AUI can be analysed to identify service candidates. The identification of services can be achieved by decomposing a process into ―the most granular representation of processing steps‖ (Erl 2005). Figure 4.6 illustrates how steps in a process can be extracted to create reusable services. Depending on the accepted level of granularity for an SOA implementation, almost every process step, sub-process or process can be implemented as a service. The components of an AUI can be viewed as a workflow or a series of steps used to achieve adaptation. Information is moved from component to component until the process is complete. Section 3.5 established that an AUI consists of three main components, the afferential, inferential and efferential components of adaptivity. Figure 4.7 illustrates the interaction between the components of an AUI and how the components can be abstracted as services. The components of an AUI form part of the general schema for processing an AUI: capture user-interaction
92
Service-Oriented Analysis and Design
(afferential), make inferences about users by using the captured information (inferential), and finally, provide relevant adaptations based on the inferences made (efferential). The components of an AUI can therefore, be designed as services to provide re-usable AUI components.
Figure 4.6: Encapsulating parts of a process as a service (Erl 2005)
Figure 4.7: The components of adaptivity
The components of an AUI have all the characteristics of services, namely: they are loosely coupled, agnostic and independent when the adaptation process is decomposed to a sufficiently
93
Service-Oriented Analysis and Design
granular level. Three service candidates can be identified in the process: A Watcher Service, an Analysis Engine Service and a Transformation Service. The Watcher Service fulfils the afferential component of adaptivity since it is derived directly from the afferential component and its role is solely to collect user-interaction data and update the user model (Section 3.2.5.1). The Analysis Engine Service fulfils the inferential component of adaptivity, since it provides the same function as the inferential component of adaptivity (Section 3.2.5.2). User-interaction data collected by the Watcher component is stored in the knowledge base. The inferential component uses this user-interaction data to make inferences about users by employing user modelling techniques. The efferential component of adaptivity decides how to adapt the UI in an AUI. The decision on how this occurs is based on inferences made by the inferential component. The Transformation Service provides this functionality and therefore satisfies the efferential component of adaptivity (Section 3.2.5.3). Table 4.1 provides a summary of the identified AUI services. Short descriptions of each service are provided to outline the scope of functionality required for each service. The AUI services are derived from the components of adaptivity and encapsulate the functionality that each component provides in an AUI. Table 4.2: Identified Services
Service Name Watcher Service Analysis Engine Service Transformation Service
Service Description Capture user-interaction information and update the knowledge base with this information. Make inferences about users by employing user modelling techniques using data from the knowledge base. Perform relevant adaptations to the UI based on the results of invoking the Analysis Engine Service.
Candidate services have been identified by analysing existing AUI components. These service candidates are based on the components of adaptivity that interact in order to provide relevant adaptations to users. The following section explains how the candidate services identified in Table 4.2 are specified for use in an SOA and CC environment.
94
Service-Oriented Analysis and Design
4.7 Service-oriented design of an AUI The aim of SO Design is to specify physical services and define the interactions between them. As mentioned in Section 4.3.1, this phase includes the selection of service layers, the positioning of core standards and the selection of applicable SOA standards.
Selection of service layer: The services previously identified are classified as AUI utility services. This is because they are agnostic of their environment and provide low level AUI functionality;
Positioning of Core Standards: The WSDL is the standard way of defining a web service contract (Section 2.3.2.1). It will therefore be used to define the contracts of the identified services. Remote Procedural Call (RPC) services are going to be used because a WSDL must be defined since synchronous services are required (Section 2.4.1); and
Selection of applicable SOA standards: An Enterprise Service Bus is used in SOAs when a large number of services must interact using a standard messaging protocol for example (Section 2.5). Only a small number of services were identified in this research, therefore an ESB is not necessary. The point-to-point approach will be used instead.
The following step in the analysis of an AUI is the design of business services. The identified services are of the same type, and once realised, they will be invoked using the RPC approach. The specification of the services is, however, necessary in order to develop the service WSDLs and provide specific service information for development and for the documentation of the service. The following section discusses the specification of the AUI services.
4.7.1 AUI service specification Terlouw and Maarse‘s (2009) specification framework contains a comprehensive list of service specification information. In this section, the framework is used to specify the services identified in the previous section. In order to avoid repeating the same information in service specifications, Table 4.3 provides information that is common to all the services. This information will be made accessible in the documentation of all services as required by the framework. The table includes information of the specific service provider (an individual or organisation) and possible contact
95
Service-Oriented Analysis and Design
details. The messaging protocols supported by the service, the service location (URL) and the service version are provided. Table 4.3: Common Service Specification Information for all services
Aspect Service Provider Provider Name Provider Contact Details
Service Usage Version Protocols Location
Information Emile Senga Department of Computing Sciences, Nelson Mandela Metropolitan University, University Way, 6001. Tel: 041 504 2049. Email:
[email protected] 1.0 HTTP, SOAP. http://pegasus:12001/
4.7.1.1 Agent manager – Watcher This section provides specification information for the Watcher Service. The Watcher Service satisfies the afferential component of adaptivity by capturing user-interaction information and interacting with the knowledge base to update the user model. Table 4.4 shows service-specification information for the Watcher Service. The supported operations are shown along with the parameters to invoke them. The only operation accessible via the Watcher Service interface is the ListMetrics function. The rest of the operations are delegate functions that are invoked by ListMetrics to store appropriate performance data into the appropriate sections of a user‘s profile. Table 4.4: Watcher Service Specification
Aspect Service Function
Information
Service Type Supported Transactions
AUI Service Operation: ListMetrics – this is a switch type function that invokes the appropriate private method to store user-interaction data in the user model. Operation: ServiceName Description: Updates the user profile with the PFs for the IM ‗Service Name‘. Parameters: _AUI , String userid Operation: CallType Description: Updates the user profile with the PFs for the IM ‗CallType‘. Parameters: _AUI , String userid
96
Service-Oriented Analysis and Design
Table 4.4: Watcher Service Specification (continued)
Aspect
Information
Supported Transactions
Operation: Priority Description: Updates the user profile with the PFs for the IM ‗Priority‘. Parameters: _AUI , String userid Operation: Source Description: Updates the user profile with the PFs for the IM ‗Source‘. Parameters: _AUI , String userid Operation: Campus Description: Updates the user profile with the PFs for the IM ‗Campus‘. Parameters: _AUI , String userid Operation: Contact Description: Updates the user profile with the PFs for the IM ‗Contact‘. Parameters: _AUI , String userid Operation: Cause Description: Updates the user profile with the PFs for the IM ‗Cause‘. Parameters: _AUI , String userid
Description Input
Operation: Solution Description: Updates the user profile with the PFs for the IM ‗Solution‘. Parameters: _AUI , String userid Capture KLM data for each informative moment and update the current users profile with this information at the end of every task. Operation: ListMetrics() Description: A list of objects containing predictive features (PFs) for informative moments (IMs) Parameters: List Objects: AUI = TotalTime, SelectionTime, YmouseVelocity, YmouseAcceleration, DwellTime, AverageDwellTime, No.ItemsVisited, No.UniqueItemsVisited, InformationMomentID.
4.7.1.2 Analysis engine This section discusses the specification of the Analysis Engine Service. The analysis engine makes inferences about a given user‘s level of expertise by employing user modelling techniques. It satisfies the inferential component of adaptivity. It also interacts with the knowledge base by selecting the user model which is stored in the knowledge base. Table 4.5 provides servicespecification information for the Analysis Engine Service.
97
Service-Oriented Analysis and Design
The Analysis Engine Service supports just one operation, isExpert. This operation performs user modelling for the user whose ID is passed as a parameter to this operation. Its output value is a Boolean, which is true if a user is found to be an expert and false if the user is a novice. The Analysis Engine Service requires that user-interaction data exist in the user model for users. If none exist, then its default return value is false, i.e. the user is a novice. Furthermore, it does not affect the user model in any way, and only reads the values of the parameters stored in the model. Table 4.5: Analysis Engine Service Specification
Aspect Service Function Service Type Supported Transactions Description Input
Output Preconditions Postconditions QoS constraints
Information AUI Service isExpert – performs user modelling analysis for a given user to determine their level of expertise. Make inferences about users by employing user modelling techniques using data from the knowledge base. Operation: isExpert Description: performs user modelling analysis for a given user to determine their level of expertise Parameters: String userid Boolean – true if user is found to be an expert, false if otherwise User-interaction data exists in knowledge base concerning said user. If none, default to novice. User model is unaffected by the inferences. -none-
4.7.1.3 Presentation manager - Transformation This section discusses the specification of the Transformation Service. The Transformation Service generates UIs based on the outcome of the user modelling performed by the Analysis Engine Service. It creates UIs that are matched to a user‘s level of expertise. Several documents are used to accomplish this, and they will be discussed in Chapter 5. Table 4.6 shows the specification for the Transformation Service. The service supports just one operation which takes as input well-formed XML documents in order to create UIs. This section discusses the design of AUI services by applying SO design to an AUI. The outcome is that appropriate standards for the services have been identified and service specifications have been provided for the services. The next step is to design business processes and finally, to provide realisation information for the services. The single business process in this case is the adaptation
98
Service-Oriented Analysis and Design
process. This is discussed as the proposed model for this study which outlines how adaptation can occur in a SOA. The following section will discuss this. Table 4.6: Transformation Service Specification
Aspect Service Function
Information
Service Type Supported Transactions Description
AUI Service TransformXML Generate UI for novice or expert based on the inferences made by the Analysis Engine Service. Operation: TransformXML Description: transforms the given xml (appropriate OLH + WSDLs) using the given XSLT. Parameters: String XML, String XSLT Generated HTML mark-up from transformation of input documents. XML input documents must be well formatted. -none-none-
Input
Output Preconditions Postconditions QoS constraints
4.7.2 Proposed model The service specification step, as previously stated, provides details on how services can be implemented. The specified services must now be orchestrated to create meaningful applications. A model is proposed for the interaction of AUI services for this study.
Figure 4.8: Proposed Model
99
Service-Oriented Analysis and Design
Figure 4.8 illustrates how the AUI services for this model interact in order to adapt and generate UIs. The following sections discuss the specific aspects of the AUI services model.
4.7.3 Knowledge base The function of the knowledge base in the proposed model for AUI services is to store the user and task models. The user model defines the user and represents the characteristics that are important for adaptation to take place (Section 3.2.5.1). The task model represents the tasks that the user can perform (Section 3.2.5.1). This section shows and discusses the user and task models in the proposed AUI model.
4.7.3.1 User model The function of the user model in the AUI services model is to store information which is subsequently used for adaptation. Novice and expert CCAs in a CC environment differ in performance at the physical level of interaction i.e. the speeds at which CCAs are able to log calls differ significantly (Jason 2008).
Figure 4.9: User Model Schema
100
Service-Oriented Analysis and Design
The user model must consequently contain performance-related information to differentiate between novice and expert user. Informative Moments (IM) (Section 3.5.2.1) are used to represent specific UI elements with which users interact. Each IM has associated Predictive Features (PFs). Figure 4.9 shows the task model used to store user performance information
4.7.3.2 Task model The task model represents the tasks that the user can perform with the system. The task model in the AUI services model stores information on the Call Logging task. AUIs use task models to recognise a user‘s goals. Task support and error checking can be performed using the task model.
Figure 4.10: Extract of Task Model Schema
In an SOA environment, the task model stores specific service information which is used to find service descriptions when generating the UI. Services that support the Call Logging task are
101
Service-Oriented Analysis and Design
references from the task model. The UI itself is generated from the operations of web services. Using this approach allows the UI to be flexible, loosely coupled and independent of implementation. In order to add a new operation to the UI, for example, only requires a reference to a web service that supports the operation to be included in the task model. Figure 4.10 depicts the task model used. The task model represents the tasks that the user can perform with the system by defining the different aspects of the task as steps. Each step includes different operations. Each operation includes the operation name, and the location of the web service that supports that operation.
4.8 Service realisation Once services have been identified, and processes in which they are used have been defined, the next phase is to decide how the services will be realised. Service realisation determines how services will be provided. The in-house approach (Section 4.5) was selected for the realisation of services in this study. In-house development consists of the analysis, design, realisation and implementation of services within the organisation planning the services. Wrappers are also used in several places to provide functionality from legacy source code as services.
4.9 Service interaction The analysis and design of AUI services has already been discussed. This section describes how the services in the implementation of the prototype will interact. The UI interaction with the AUI services is discussed to illustrate how these components interact to allow CCAs to complete the Call Logging task. The actual implementation of the services will only be discussed in Chapter 5. Service annotations diagrams can be used to illustrate the final interactions of the services once they have been implemented (Erl 2008). Figure 4.11 illustrates how the UI interacts with the AUI services during the Call Logging task using a sequence diagram. Users must first login into the system to differentiate between the different users. A utility login service authenticates the user at this step. The current level of expertise of the user, as it is in the user model, is retrieved next. The Transformation Service is invoked with the retrieved user expertise level as a parameter. The appropriate UI is then generated based on this expertise passed on to this service.
102
Service-Oriented Analysis and Design
If the user is a novice, then the first step of the Call Logging task is generated. Once this step is complete, and the user would like to move to the next step, the next step function is invoked. All the user-interaction data is then submitted to the Watcher Service, which updates the user model of the current user. The Transformation Service is then invoked to generate the UI for the next step. For each subsequent step, the Watcher Service captures the user-interaction data and updates the user model of the current user. Finally, once the entire task is complete, the user-interaction data are submitted and the Analysis Engine Service (‗Expertise‘ in Figure 4.11) is invoked to determine whether the user‘s latest performance moves him up to the level of experts. User modelling takes place and if a user is found to be an expert then an expert UI is generated using the Transformation Service. If the user is not an expert, then he will continue using the novice UI.
Figure 4.11: AUI components and Call Logging processes sequence diagram
103
Service-Oriented Analysis and Design
The user‘s performance is continually evaluated while he interacts with the application to determine whether the user is performing at the level of experts. Once several tasks have been completed with the application, the user‘s expertise may be elevated to the expert level. An expert UI is generated to allow the user to interact faster with the UI. In this case the user-interaction data are only captured by the Watcher Service once the entire task is complete.
4.10 Summary The aim of this chapter was to answer research question R3: How can an AUI be designed using an SOA? This chapter has shown the analysis and design phases of an AUI using a hybrid approach developed by combining the phases of Erl‘s (2005) method for SO analysis and design and the SOMA method (Arsanjani 2004). Various SO analysis and design methods exist. However, those which are used extensively in industry and have a proven record, are proprietary methods, hence the use of a hybrid method. The SOMA approach developed by IBM (Arsanjani 2004) defines the different phases of SO analysis, design and implementation while Erl‘s (2008) approach provides the details on the specific steps in a generic and vendor agnostic manner. Jason (2008) proposed and successfully implemented an AUI for contact centres (CC) which was designed and implemented using a client/server architecture. The hybrid approach is used to analyse and design AUI services based on Jason‘s (2008) implementation and the result is a model for AUI services. This model defines how AUI services can be implemented to provide adaptivity to generated UIs. The model consists of the traditional AUI components (the Afferential, Inferential and Efferential components) as services that can be invoked over a network. In order to validate the model, it must be implemented and evaluated. The next chapter discusses the realisation of the model discussing the implementation of a prototype for CCs.
104
Chapter 5: Implementation 5.1 Introduction The literature chapters (Chapter 2 and 3) discussed service oriented architectures (SOA) and adaptive user interfaces (AUIs). Chapter 4 developed a model for AUI service interaction using the knowledge gained in the literature chapters. Furthermore, a hybrid approach which combined Erl‘s (2008) method and the SOMA (Arsanjani 2004; Arsanjani et al. 2008), was used to analyse Jason‘s (2008) existing model and the result was the design of a SOA based AUI services model. This chapter describes the implementation of a SOA based prototype of the AUI services model. The objective of this chapter is to demonstrate how the proposed AUI services model proposed in Chapter 4 was implemented. This implementation has been undertaken in order to demonstrate whether the model can be effectively used in the design and development of a prototype incorporating AUIs and making use of an SOA, thereby answering research question R4: How can an AUI be implemented using an SOA? A discussion on the domain of the prototype has been
provided to give the setting in which the prototype was developed (Section 5.2). The implementation tools selected to realise the prototype are also discussed (Section 5.3). The realisation of the AUI model services are discussed beginning with the Knowledge Base (Section 5.4), followed by the Agent Manager (Section 5.5), the Analysis Engine (Section 5.6) and the Presentation Manager (Section 5.7). The interaction between the model services is discussed in Section 5.8 and the user interfaces (UIs) created from the interaction between the AUI model services, are discussed in Section 5.9. Finally, pilot studies used to evaluate early prototypes are discussed in Section 5.10.
5.2 The implementation domain Section 3.5.2 discussed the implementation of an AUI in a contact centre (CC). This section provides a brief discussion on CCs and the need to train CC personnel using AUIs. The objective is to provide a domain context for the prototype implemented in this chapter.
Implementation
CCs are the main point of contact between companies and their customers. There has been an increase in the investment in CC infrastructure and the accompanying workforce (Mandelbaum 2004). The goal of the CC and the task assigned to Contact Centre Agents (CCAs) is to resolve customer queries. CCAs are the personnel responsible for interacting with customers in a CC and they respond to customers‘ queries concerning company products or services. The query resolution process begins with logging the customer‘s query (Jason 2008). The steps that follow usually take the following sequence (though this may vary depending on the query):
Provide the customer‘s details;
Provide the call‘s details;
Assign the call; and
Provide the call‘s solution (resolution) details.
The majority of funds invested in a CC workforce is to train CCAs to respond effectively to customer queries (Heathcote 2003). Various approaches have been proposed to reduce training costs, including IUIs (Singh 2007) and AUIs (Jason 2008). An AUI has been implemented to improve the performance of novice users in resolving customer queries. Novice and expert users have been shown to perform and think differently when performing tasks (Jason 2008). The implication of difference between users is that UIs must match the user‘s level of expertise. Jason (2008) implemented an AUI to improve the performance of novice CCAs by providing different UIs based on the user‘s inferred level of expertise. Two UIs were created, one for novice users and the other for expert users. The design of the UIs was influenced by research on qualitative (Section 3.3.1) and quantitative (Section 3.3.2) differences in user expertise. Each UI was, therefore, specifically designed to match the expertise of users. The prototype implemented in this chapter was developed in the setting explained above. The prototype allows novice CCAs to perform the query resolution steps and to respond to customers‘ queries. This is, however, achieved using an SOA. Essentially, the AUI services model has been developed to provide the necessary functionality to achieve the query resolution
106
Implementation
steps using an SOA. The following section discusses the implementation tools used to achieve this.
5.3 Implementation tools In this section the implementation tools used to develop the prototype of the AUI services model, as specified in Chapter 4 are discussed. Different aspects of the model required the use of different development tools. The model was consequently implemented using the tools discussed. Service development language – A deployed web service can be accessed from any platform; therefore the implementation language of the services is not of great concern. Each web service was evaluated to determine which platform would best provide the necessary functionality. The existing source code acquired from a previous study (Jason 2008) was, however, in C#. Web services were therefore implemented in C# using Visual Studio 2008 (Microsoft 2009e). In addition, the .Net platform offers a mature and simple web service implementation platform with annotations and support for web service standards (Microsoft 2009c). Transformation language – Web services leverage XML (OMG 2009) in order to exchange information and define service contracts. The Transformation Service uses the Web Services Description Language (WSDL) (W3C 2009d) document of a service to generate the UI. Although parsing of XML is possible on most platforms, Extensible Stylesheet Language Transformation (XSLT) (W3C 2009e) was used to transform the necessary information from WSDL, and object layout hierarchy (OLH) documents. XSLT is a flexible and powerful language for manipulating XML. The use of XSLT in this research offers the possibility of easily extending the platforms for which the UI is generated. If, for example, the platform for which the UI is generated changes, then generating UI code for the new platform is much easier using XSLT than it would be when using a different language such as C# or Java. In addition, XSLT can also be run on any platform, while using languages such as Java or C# would require specific platforms for the transformation of XML. Service Deployment – The web services are published on Internet Information Services (IIS) 7 running on Microsoft‘s Windows Server 2008 (Microsoft 2009b). This was chosen as the application server of choice because the web services were developed for the .NET platform.
107
Implementation
Microsoft‘s Windows Server 2008 runs on a Sun Fire V40z server. The configuration of the server is shown in the table below. Table 5.1: Windows Server 2008 Server Specification
Processors Memory Disks Network Adapter Operating
Four AMD Opteron Model 848 2.19 GHz 6 GB (4 x 1GB, 4 x 512 MB) 3 x 73 GB Ultra320 SCSI 10 000 rpm 2 x Gigabit Ethernet 64-Bit Windows Server 2008 Service Pack 2
Knowledge Base – The User Model is stored using a MS SQL 2005 Database (Microsoft 2009b) which is deployed on Microsoft‘s Windows Server 2008. The User Model stores user performance information including XML snippets of the Information Moments (IMs) (Section 4.6.3.1). System Interaction – Firefox v3.5.5 web browser was used to interact and evaluate the prototype. W3Schools (2009) is a web resource that maintains a list of web browser statistics. The generated UIs were tested on the following five most popular web browsers, according to W3Schools (2009):
Chrome v4.0.249 (Google 2009b);
Firefox v3 (Mozilla 2009);
Internet Explorer 8 (Microsoft 2009d);
Opera v10 (Opera 2009); and
Safari v4 (Apple 2009).
During this research it was found that none of the currently existing browsers, except Firefox, support the programmatic access to events fired when interacting with HTML drop-down list elements. In order to capture and measure predictive features (PFs) for IMs, such a feature is crucial. The browser of choice for development and testing was therefore limited to Firefox v3. The implementation of the AUI services model will be discussed in the following sections. They elaborate on how the Knowledge Base, Agent Manager (Watcher Service), Analysis Engine Service and Presentation Manager (Transformation Service) are implemented.
108
Implementation
5.4 Knowledge base The knowledge base stores the user and task models. Both the user and task models are implemented using XML. The User Model is used to store the parameters related to user performance. The Task Model is used to define the task the user performs as well as to define the aspects of the generated UI. These components are discussed further below.
5.4.1 User model AUIs generally utilise a user model. The purpose of the user model is to store user related information; which is used in the adaptation process. User‘s unique characteristics are either stored or derived from the data stored within the user model. For the prototype, user performance data are stored as an XML document within a user‘s profile in a database. In addition, the user profile contains user‘s log-in times, and time taken to complete tasks. Performance separates novice users from experts since experts complete tasks faster and more efficiently than do novice users (Section 3.3.2). The performance data are used to analyse the users‘ skills as they interact with the UI. Depending on the results of the analysis, a user is subsequently classified by using a stereotype as either novice or an expert. Every user begins as a novice regardless of expertise and experience. Once the performance matches the performance of predicted expert users, the prototype ceases to generate the novice UI and now generates the expert UI. The Keystroke Level Model (KLM), discussed in Section 3.5.2.1, defines the threshold used to determine whether a user is an expert or a novice (Hurst et al. 2007). Performance at or above this threshold indicates that the user in an expert while performance below this figure indicates that the user is a novice. Although user-interaction data are collected during interaction with the application, the transition from novice UI to expert UI occurs at the beginning of a task. This is because analysis of the data on a user‘s performance is preformed at the beginning of the task.
109
Implementation
5.4.2 Task model The task model maintains a model of a task or goal the user is trying to achieve. The model defines a task and its sub-tasks in an hierarchical structure. The sub-tasks are marked as being complete or incomplete as the user interacts with the UI and completes different sub-tasks. In this study, the task model is stored as an XML document. It is also exploited to provide additional capabilities, for example, element dependencies within the UI are addressed using the task model. Elements that depend on other elements have an attribute with the value as the name of the element on which it is reliant, as well as the nature of the relationship. Navigation of the application is also managed using the task model, since it defines the steps required to complete a task and the order (if necessary) of execution. The task and user models are both implemented using XML.
5.5 Agent Manager - Watcher Service The function of the Watcher component is to capture user-interaction information and store this information in the knowledge base. In order to achieve this as a service, the generated UI is created with JavaScript code to collect user-interaction information for each IM. An AUI object is created for each IM and updated if the user interacts with the IM. Figure 5.1 shows the JavaScript AUI object that captures PFs for each IM. The Watcher Service is invoked at the conclusion of a task to update the user model of the current user with the information stored in the AUI objects. The PFs that have time as a unit of measurement (Dwell Time, Total Time and Selection Time) are measured using the start-time and the end-time of the action. The Dwell Time measures the time (in seconds) during which a user was inactive for longer than 1 second while making a list selection as determined by Jason (2008) and discussed in Section 3.5.2.1. The Total Time measures the cumulative total time that a user has interacted with an IM. The Selection Time measures the time taken from when a user selects a list until an item is selected in the list. Y Mouse Velocity is measured by dividing the Selection time by the distance travelled by the mouse along the Y-axis.
110
Implementation
The distance travelled by the mouse is determined by multiplying the number of items visited in the list by the pixel height of the items in the list (it is assumed that the heights of all items in the list are of equal height). Y Mouse Acceleration is determined by dividing the Y Mouse Velocity by the Selection Time. The Average Dwell Time is determined by dividing the Dwell Time by the number of items visited. The Unique Items Visited is determined by maintaining a list of unique items that are visited during a list selection action. The KLM Predicted Time is a constant value (2.65 seconds) and is obtained from the design of a KLM (Jason 2008). The KLM Difference is obtained by subtracting the current Selection Time, with the KLM Predicted Time. It represents the difference between a user‘s actual selection time, and the expected times of experts. Experts are therefore expected to have a smaller KLM than novice users (Jason 2008).
Figure 5.1: JavaScript Object showing the 9 Predictive Features (PF) for Informative Moments (IM)
The user model is updated when all the values for the PFs have been obtained. The UpdateUserModel class is responsible for updating the user model with the PFs (Figure 5.2). Updating is achieved by first retrieving all the PFs collected by the Watcher Service, and then storing the IM information as XML in the Knowledge Base. The update process occurs in the following sequence: The function GetUserModelComboBoxXML is used to retrieve the IM XML from the Knowledge Base; The Update methods are called to update the appropriate sections of the retrieved IM XML with values from the PFs obtained by the Watcher Service; and
111
Implementation
Once all PFs have been updated to the IM XML, the UpdateUserModelComboBox function is used to save the updated IM XML to the Knowledge Base.
Figure 5.2: UpdateUserModel Class for updating the IM data in the User Model
The User Model in this study is updated with new interaction information at the end of each step for novice users, and again at the end of each task for expert users. The User Model stores a separate record of each task performed. Therefore, for novices the record of the task is updated after each step, while an entire task record is stored at the end of each task for experts. Basically, the UpdateUserModel class is only invoked for novice users as the record of the task is updated.
5.6 Analysis Engine – Analysis Engine Service The role of the Analysis Engine Service is to make inferences about users from the information stored in the user model. This service, when invoked, uses statistical inference techniques to determine whether the current CCA‘s performance is equal to or better than the performance of previously defined (not part of this study) expert users. This service functionality is exactly that as provided in Jason (2008), as described in Section 3.5.2.2. Figure 5.3 shows the implementation of this functionality. The CalculateFinalT function determines the performance of the user for all the tasks completed by the user. Additionally, it furthermore determines the performance of a user by calling the GetArrayUserModelComboBoxXML function which acquires the user‘s User Model from the Knowledge Base and then calling the GetArrayUserModelComboBoxExperts function to retrieve the User Model of all expert users. The isExpert function then compares the performance of the current user against the performance of the experts.
112
Implementation
If a user‘s overall T-Score is above the value of 52, then that user is classified as an expert (Jason 2008). In this case, isExpert function returns true, which means that the user is an expert. The TScore value of 52 is taken from Jason (2008); who statistically determined that the minimum TScore for experts performing the Call Logging task was 52. Tullis and Albert (2008) suggest that users perform at least four tasks in order to get acquainted with a system. Hence, the rule that users must have performed at least four tasks before the system can update the user‘s level of expertise.
Figure 5.3: The Analyse Skill class for the Analysis Engine Service
The Analysis Engine Service is invoked by the Transformation Service to determine which type of UI to generate for the user. The implementation of this service and its components will be discussed next.
5.7 Presentation Manager – Transformation Service The presentation manager, which satisfies the efferential component of adaptivity, specifies how an AUI should adapt. In this study, adaptation is provided by generating a UI for a user, based on the user‘s inferred level of expertise. The functionality of the presentation manager is provided by the Transformation Service. The appropriate UI for a user‘s level of expertise is generated once the expertise of the user is determined using the Analysis Engine Service. The Transformation service performs its function by using Extensible Stylesheet Language Transformation (XSLT) (W3C 2009e) rules to combine information from the Task Model, the WSDL for the services that support Call Logging steps and the Object Layout Hierarchy to create the UI. The following sections discuss the elements used by the Transformation Service.
113
Implementation
5.7.1 XSLT The XSLT used in the UI generation process consists of a set of rules that generate UIs based on the information stored in the Task Model. XSLT templates are defined in the XSLT document in order to generate HTML mark-up for UI layout and user controls, whenever certain a XML mark-up is encountered. The XSLT documents used to generate UIs are the WSDL XSLT, the Novice XSLT and the Expert XSLT.
5.7.1.1 WSDL XSLT The primary XSLT document used to generate UIs is the WSDL XSLT. This document contains various templates which transform the WSDL of a web service, in order to create UI controls that match the input elements of the web service. An XSLT template is a snippet of code that is executed whenever a predefined pattern is found in a source XML document. The generated UI allows users to input data in the appropriate format for a web service which the web service is able to consume. Figure 5.4 illustrates the different aspects of a WSDL and shows how they relate to each other. An understanding of the relationships between the different aspects of the WSDL is required to understand how the XSLT transformation is able to generate UIs. The Service element defines the name of the service as a port (Figure 5.4 A). It is referenced by binding and a port-type (Figure 5.4 B) element which defines the operations supported by the web service using that port name (Figure 5.4 C). The operation element defines the input and output messages for the operations of a web service. The input and output messages are referenced in the schema of the WSDL (Figure 5.4 D) which precisely defines the format and data types of the input and output messages of the web service‘s operations. The WSDL transformation process functions as follows:
For each operation element in the WSDL:
if the matching element in the WSDL is of labelled display;
then generate user controls for the output message defined in the schema
114
Implementation
else, generate the user controls for the input message defined in the schema.
D C
B
A Figure 5.4: The relationships between the elements of a WSDL Document (Burr 2006)
Figure 5.5 illustrates how the UI controls are generated from the WSDL schema. XML elements and their descendents are represented as nested elements. This can be explicitly defined as a situation whereby the elements are defined in a hierarchy, or by reference, where a reference element represents the actual child element. The element ―CreatePackage‖ in Figure 5.5 is a reference to an operation called ―Create Package‖. The children of the ―CreatePackage‖ operation define the input and output messages of the operation. Figure 5.5(b) and (d) illustrate how elements are transformed to UI controls. Figure 5.5 (c) shows an element referencing another element, and how this is transformed to a UI control.
115
Implementation
Figure 5.5: Creating User Interface Controls from XML elements
Table 5.2 shows XML data-type element and the XHTML control mappings used to generate user controls. Whenever a built-in-type element is encountered in the WSDL schema, an appropriate control must be generated to either provide means for data input or to display information in the format specified in the WSDL schema. A parameter is used in the task model to specify whether a service is a display service or an input service. A display service displays information on the UI, while an input service requires input from the UI. Although not all the mappings shown in Table 5.2 are eventually used in this study, they were designed and implemented to cater for services that might require them. Table 5.2: XML Simple Data- Type to XHTML Control Mapping (Song and Lee 2007)
XML Simple Data- Type Built-in Type String of restricted length 2 Selectable items/ Restrictions Boolean List of selectable Lists items Union of various items Unknown
XHTML Control Input Input / Text area Radio Select Composition of controls Input
116
Implementation
The WSDL XSLT document is thus able to generate user controls for the input and output messages of a web service‘s operations by matching operation the templates it contains with operation information in a services‘ WSDL. The Task Model plays a part in the transformation process. The URLs of the service WSDL for which a UI must be generated are stored in the Task Model. Using this approach web services can easily be interchanged by simply changing the URL of the WSDL in the task model. 5.7.1.2 Novice XSLT The Novice XSLT document is used to generate UIs for novice users. This document was designed by taking into account the design principles suitable for novice user UIs (Section 3.4). The Call Logging steps that are defined in the Task Model are generated as separate input screens when this document is applied. These screens are linked in a workflow format, thus allowing novice users to move from step to step until the entire Call Logging task has been completed. The step-by-step functionality is achieved by defining the layout of the screens in the Object Layout Hierarchy (OLH) (See Section 5.7.2) and by importing the WSDL XSLT document to generate the UIs for operations from a service‘s WSDL. More detail, including screenshots of the generated UIs are provided in Section 5.9.1. 5.7.1.3 Expert XSLT The expert XSLT document is used to generate UIs for the expert users. It was designed taking into consideration the design principles suitable for expert user UIs. The expert XSLT combines all the steps of the Call Logging task into a single screen, in so doing allowing expert users to interact with the UI and quickly complete tasks. This is achieved by defining templates to generate UI controls in a layout specified in the OLH. The user is able to navigate through the different steps of the Call Logging task with the flexibility to quickly switch between the different steps of the task. This document uses the WSDL XSLT document to generate the UIs for operations from a services‘ WSDL. A Screenshot of the generated expert UI is provided in Section 5.9.2.
117
Implementation
5.7.2 Object layout hierarchy The Object Layout Hierarchy (OLH) is an XML document which uses nested XML elements to define groups of UI elements in a UI and the layout that these groups have (He et al. 2008). This document is accessed with the Task Model and the XSLT documents to determine the UI layout during the generation process. The layouts supported include:
Ordered Horizontal Group (OH): UI elements in this group are ordered horizontally with equal lengths and are numbered;
Ordered Vertical Group (OV): UI elements in this group are ordered vertically, with equal heights and are numbered;
Plain Vertical Group (PV): UI elements in this group are ordered vertically without any specific length or numbering;
Plain Horizontal Group (PH): UI elements in this group are ordered horizontally without any specific length or numbering;
Plain Group (P): No layout information is provided for a group; and
Ordered Group (O): UI elements in this group are of equal length and width, but no orientation information is provided.
Ordered Horizontal Group
Ordered Vertical Group
Figure 5.6: Example of the application of the layout groups to the Novice Step 1
118
Implementation
The layout groups defined above allow UI elements, generated from web service operation information, to be grouped and laid out on screen. Figure 5.6 illustrates how the layout definitions are applied to the UI in order to achieve the layout of elements. Additional styling of the UI is required however. The Element Styling document defines the styling of specific UI elements and is discussed in the following sub-section.
5.7.3 Element styles Element styles allow the generated UIs to be styled by adding colour, additional layout information and the spacing of UI elements. The UI generated in this study is HTML which runs in a browser. Cascading Style Sheets (CSS) were therefore used to define the element styles (W3C 2009a). CSS describes how a document is presented on screen. It provides a mechanism to define specific presentation information about a document. A CSS document is specified separately to the document it describes. This makes defining document presentations more flexible and easily manageable (W3C 2009a).
5.8 User interface interaction The generated UIs must be dynamic and support user-interaction if they are to be successful. This section discusses how UI interaction is achieved in the prototype. Several web technologies were employed to achieve a suitable level of interaction. The following are discussed to elaborate on how this was achieved:
The choice of technology for the UI;
The mechanism used to invoke the AUI web services;
How dependencies are achieved in the UI; and
How the capturing of user-interaction data is achieved.
5.8.1 Technology for the UI Various scripts were developed to allow the UI to interact with the AUI components as services. The scripts, developed using JavaScript (ECMA 2009), were designed to work with any web service that has a WSDL. JavaScript was chosen as the language for the UI for two reasons. Firstly, it is a powerful and flexible scripting language with libraries such as jQuery (jQuery
119
Implementation
2009) which facilitate the creation of rich interface applications (RIA). A responsive, flexible and usable UI is therefore possible using JavaScript. Secondly, JavaScript is capable of using the Document Object Model (DOM) (W3C 2009b) to manipulate XML. DOM provides a ―platform and language-neutral interface for programs and scripts looking to access documents and update the content, structure and style of those documents” (W3C 2009b). Web services standards are highly dependent on XML. Therefore, the ability to manipulate the WSDL, to capture messages being exchanged between services and craft messages based on web service WSDL is extremely useful.
5.8.2 Querying web services from JavaScript The generated UI is capable of interacting with the AUI web services using the XMLHttpRequest object (W3C 2009c). The XMLHttpRequest object allows scripts to perform HTTP requests to servers and retrieve data directly from the server (W3C 2009c). The HTTP requests for submitting or retrieving data (SET or GET respectively) are crafted from the message definition found in the WSDL of the AUI services. This approach allows any web service to be invoked from the generated UI in a loosely coupled manner and the flexibility of the entire application can consequently be maintained quite easily.
5.8.3 Managing UI element dependencies It is critical for web services to maintain their characteristics of autonomy and independence from their environment and other services as far as is possible (Section 2.2.3). Dependencies in the UI are however inevitable. Certain elements require input from other elements in order to show appropriate selection options themselves. The Task Model is used to define which elements are dependent on the values of other elements. Scripts are then capable of invoking the appropriate web services to populate the dependent elements.
5.8.4 Capturing user-interaction data This research defines Informative Moments (IM) which are UI elements with which users interact. For each IM that users interact with, various metrics, referred to as Predictive Features (PFs) are captured. From the formal definition of a PF, as stated by Hurst et al. (2007) and given
120
Implementation
in Section 3.5.2.1, a PF relates to a specific, measurable action. It can be measured for any UI element such as a drop down list. Since the Call Logging task consists of a series of screens, where CCAs must search for information that matches the customer quires, PF data can be collected for the drop down list selections that CCAs make when logging a call. In order to collect the data, it was necessary to capture the PFs for all drop-down lists. In HTML, drop-down lists are defined using the tag. jQuery, the JavaScript framework used in this research, provides ways to select specific UI controls such as text boxes, checkboxes and drop-down lists (jQuery 2009). jQuery can also incorporate Cascading Stylesheet (CSS) (W3C 2009a) ‗selectors‘ to select UI controls based on the CSS class to which the UI control belongs. A single binding function such as an event handler can be attached to all UI controls of a certain type or belonging to a specific CSS class using jQuery. This facilitated the selection of all drop down lists for which PFs were to be captured. Functions were then written to capture the PFs whenever users interacted with drop down lists. Appendix J shows the code used to capture PFs whenever users interacted with drop-down lists. Various challenges were faced, however, when implementing this, for example, because the UI is generated, event handlers which allow code to be executed whenever a user interacts with a specific user control, could not be attached to UI controls in the generated UI. This was surmounted by using a bind function which not only bound existing UI controls of a certain type or CSS class to an event handler, but also bound any future elements of that type or class to that event handler. This meant that future generated UI could link to the event handler which captured the PF data required. Once PF data for a drop-down list is collected, it is added to an array containing PF data for other drop-down lists. The Watcher Service is then invoked and the array containing the PF data is passed as a parameter to the Watcher Service which, in turn, stores this information in the appropriate user‘s user model.
5.9 Generated user interfaces This section illustrates the functionality of the generated novice UI for CCAs. The functionality is limited in scope to the Call Logging task (Section 3.5.2).
121
Implementation
5.9.1 Generated novice user interface The novice UI that is generated is consistent with the task-based UI design presented by Jason (2008). It consists of the four Call Logging steps which the Contact Centre Agent (CCA) navigates in a sequential manner. This is done to accustom the novice CCA to the tasks performed when logging a call. Figure 5.7 illustrates the Call Logging task by means of a hierarchical task analysis. The figure shows the steps and the sub-steps required to log a call. The Log Call task and its steps are defined in the Task Model. The sub-steps are also defined in the Task Model. The UIs to perform the sub-steps are, however, generated from the WSDL documents of the web services that support the capability to perform the sub-steps.
Log Call Capture Customer Details
Capture Call Details
Assign the Call
Provide Solution Details
Select By
Select Call Description
Select the Assignee's Campus
Solution Description
Search Value
Select Call Categorisation
Select the Assignee's Contact
Solution Classification
Select Customer
Select Call Classification
Figure 5.7: Task Analysis for Logging a Call
In Figure 5.7 all the sub-steps in white have a corresponding web service to provide the functionality. UI controls are generated using the UI generation process to allow users to interact with the service (Section 5.7). The remainder of this section shows the UIs generated to support the steps and the sub-steps for the novice UI. Step 1: Capture Customer Details This screen allows a CCA to:
122
Implementation
1. Select By: Select how to search for the customer (firstname, userid or lastname). 2. Search Value: The value to search by. 3. Select Customer: Select the customer from a list of customers retrieved. Figure 5.8 illustrates the generated UI that allows the CCA to perform the Capture Customer Details step. The UI supports dependencies between generated UI elements. This allows the user to search for a customer, select a customer from a list of results and review the details for a selected customer. The areas of the UI generated from specific web services are also highlighted by the red boxes. The Search Customer service, Search Results service and the Customer Details service are used to create this UI.
Search Customer Web Service
Customer Details Web Service
Search Results Web Service
Figure 5.8: Novice UI – Step 1
Step 2: Capture Call Details Figure 5.9 shows the generated UI for the Capture Call Details step. This step allows a CCA to: 1. Select Call Description: Provide a description of the problem the customer is having. 2. Select Call Categorisation: Categorise the call by specifying categorical details. 3. Select Call Classification: Classify the call by providing classification details.
123
Implementation
Figure 5.9: Novice UI – Step 2
This screen is generated from the WSDL documents of the Call Description service, the Call Categorisation Service and the Call Classification service. The View Selected Customer information is a part of the UI that is repeated throughout the Call Logging steps (Jason 2008). The Task Model is used to define this property, and UI controls to interact with this service are generated on each page. Step 3: Assign Call Figure 5.10 shows the generated UI for the Assign Call step. This step allows a CCA to: 1. Select Assignee Campus: Specify the campus of the assignee. 2. Select Assignee Contact: Specify the contact to which the call is assigned. This screen is generated from the WSDL documents of the Search Assignee service and the View Selected Assignee which displays assignee details. The view selected assignee service is defined as a dependent on the Search Assignee.
124
Implementation
Figure 5.10: Novice UI – Step 3
Step 4: Provide Solution Details
Figure 5.11: Novice UI – Step 4
125
Implementation
Figure 5.11 shows the generated UI for the Provide Solution Details step. This step allows a CCA to provide: 1. Solution Description: Provide a description of the solution to the customer‘s problem which has been resolved. 2. Solution Classification: Categorise the cause of the problem with the customer and define how it was resolved. The screen in Figure 5.11 is generated from the WSDL documents of the Service Classification service and the Service Description service.
5.9.2 Generated Expert User interface This section illustrates the expert UI that is generated when the user‘s performance is classified as being at the level of experts. The scope of the functionality of this UI is also limited to the Call Logging task. Figure 5.12 shows the generated UI for expert users. The expert UI supports the Call Logging task by providing the user with a more compact UI which allows them to quickly navigate between the steps of the Call Logging Task. This is because expert users require a highly efficient UI which requires minimal interaction to complete a task (Section 3.4).
Step 1
Step 2
Figure 5.12: Expert UI – Steps 1 to 4
Step 3
Step 4
126
Implementation
The expert UI is generated using the same process as for the novice UI. Different documents are, however used to define the layout of the UI. The OLH defines the layout of the expert UI. It was designed to create a compact and tabbed UI.
5.10 Pilot studies The development methodology selected for this study was the prototyping methodology. Preece, Rogers and Sharp (2007) define a prototype as a design in limited form that allows users to interact with it to investigate its suitability. Two prototypes were implemented and formatively evaluated. Feedback from the evaluations was used to refine the prototypes. The results from the two pilot studies of these two prototypes will now be discussed.
5.10.1 Pilot study 1: evaluation of generated user interface Song and Lee (2008) proposed a method for generating UIs for web services using XForms. The method was evaluated by generating UIs for web services from a remote repository after which participants were asked to interact with the generated UIs. Participants were then asked to answer a post –test questionnaire containing the questions shown in Table 5.3. The questions were created to determine the users‘ convenience to the generated UIs and were rated using a five-point Likert scale (Song and Lee 2008). The goal of this pilot study is to gauge the quality of the generated UIs. Gauging the quality involves determining whether the generated UIs for the web services were adequate for interaction and to determine whether the quality of the UI is suitable for users. Table 5.3: User Testing Questionnaire (Song and Lee 2008)
No
Question
1 2 3 4 5
How fast were you able to input data using the screen? How fast were you able to understand the overall structure of input controls? How easy was it to learn how to use the user interface? How efficient was it in helping you to reduce input errors? Overall satisfaction of the user interface
5.10.1.1 Participants A convenience sample of ten computer science students (8 males and 2 females) was selected to evaluate the system. All participants had at least 5 years of computer experience and used
127
Implementation
computers daily. In addition, all participants had 5 years or more experience using web browsers. These participants can therefore be considered expert users as they are familiar with computers in general and web based UIs. Participants‘ ages ranged from 20-35 years. 5.10.1.2 Procedure Web services were developed for the NMMU ICT Helpdesk; and UIs were generated for these web services. Participants were required to complete a demographics questionnaire and were subsequently asked to complete two tasks with the generated UI. Once the tasks were complete, participants were given a questionnaire containing the questions in Table 5.3. The questionnaire was used to elicit participant responses regarding their opinions of the UI and what it allowed them to achieve. It consisted of the five questions Song and Lee (2008) used to rate generated UIs. Each question pertained to a specific aspect of the UI. Participants rated the system UI and overall satisfaction with the UI on a five-point likert scale. The questionnaire also included space for comments from participants. 5.10.1.3 Results Figure 5.13 shows a summary of the results collected using the questionnaire. Overall UI satisfaction (Question 5) was very high (mean=4.2, std. Dev=0.84), indicating that participants were satisfied with the generated UI. Results also indicate that users were able to understand the overall structure of the generated UI and its controls as this question received a high rating (mean=4.4, std. Dev=0.55). Users also rated the learnability of the UI as high (mean=4.2, std.dev =0.45). These results are supported by positive post-testing comments about the UI such as:
―Simple, intuitive user interface‖ ; and
―Good layout‖ (n=4).
128
Implementation
Questionnaire Results Likert Scale Score
5
4 3 2
1 0 Mean
1.Input Speed
2.Understanding
3.Learnability
4.Effeciency
5.Satisfaction
3.8
4.4
4.2
4
4.2
Median
4
4
4
4
4
Std Dev.
0.45
0.55
0.45
1.22
0.84
Figure 5.13: Summary of user testing results (n=10)
The results of this evaluation showed that the generated UIs were of usable quality and allowed participants to interact with the UI for web services. Several participants did not like the ―overly simplified‖ UIs that were generated for the web services however. They stated that ―the UIs were too simple‖ to accomplish any meaningful tasks. The UIs were simplified to test the UI generation process. Therefore, only simple UIs were generated. Since this pilot study found that the UIs generated from web services were of suitable quality for use, a second prototype was developed which uses this UI generation ability to generate a UI that has AUI capabilities. This prototype used a task based UI generated entirely from web services. The pilot evaluation of this second prototype will be discussed next.
5.10.2 Pilot study 2: formative evaluation of helpdesk AUI A second formative evaluation was conducted after refinements in the UI generation process were implemented from the feedback of the first evaluation. A task-based UI for contact centres was introduced at this point, to allow users to complete meaningful tasks using the generated UI. The goal of this evaluation was to discover any technical or usability problems that would affect user performance and task completion.
129
Implementation
5.10.2.1 Participants A second convenience sample of five computer science students and a systems analyst was selected to evaluate the prototype. None of the participants from Pilot study 1 were used in Pilot study 2. Figure 5.14 shows the demographics profiles of the participants selected for the pilot study. Half (n=3) of the participants were female and the other half (n=3) were male. Half (n=3) of the participants were in the 20-25 year age group; two participants are in the 25-30 year age group , while one participant was in the 15-20 year age group.
Gender Males
Age
Females
15-20
20-25
25-30
17% 33%
50%
50% 50%
Occupation Student
Systems Analyst
Computer Experience >6
17%
83%
100%
Figure 5.14: Pilot study Gender (A), Age (B), Occupation (C) and Computer Experience (D) (n=6)
All the participants selected had at least six years of computer experience. This provided the experience and familiarity of interacting with web based UIs in order to receive meaningful feedback from the participants.
130
Implementation
5.10.2.2 Procedure Participants were required to perform two tasks with the UI (Appendix A). User performance was not measured as this was not the goal of the evaluation. The UI was rated based on:
Overall reaction to the system;
UI design;
System Navigation; and
System Learnability.
A post-test questionnaire (Appendix B) was used to gauge participants‘ responses to the generated UI. The questionnaire collected quantitative and qualitative data about the participant‘s interaction with the UI. 5.10.2.3 Results Figure 5.15 shows a summary of the results from the post-test questionnaire given to participants. The results are also available in Appendix C. The overall reaction to the system was positive (mean=4.33, std.Dev=0.55). The design received the lowest rating (mean=3.50, std.Dev=0.55), while navigation was found to be intuitive (mean=4.67, stdDev=0.55). This was because the design of the UI was incomplete, and contained reported issues such as typographical errors and misaligned UI elements. The learnability of the system was also rated highly (mean=4.33, stdDev=0.84). Several technical issues were also identified during this evaluation, for example, user-interaction data was not properly captured due to errors in some of the generated UI code. This did not affect this pilot study, since user-interaction data was not being captured, but it allowed the problem to be rectified to ensure the prototype functioned properly. The first pilot study therefore found that the generated UI was suitable for use in an application. The controls were appropriate for the tasks at hand, and participants had little trouble understanding and learning to use the UI.
131
Implementation
The second pilot study included a more complex UI which allowed participants to complete contact centre tasks. The evaluation revealed various technical issues in the capturing of userinteraction data. The problems discovered during the pilot studies were rectified to ensure that the main evaluation could be conducted. The main evaluation is discussed in Chapter 6.
System Rating Likert Scale Score
5.00 4.00 3.00 2.00 1.00 0.00
Mean Median Standard Deviation
Overall reaction to the system
Design
Navigation
Learnability
4.33
3.50
4.67
4.33
4
4
5
4
0.55
0.55
0.55
0.84
Figure 5.15: Pilot study post test questionnaire results (n=6)
The results indicated that a generated task-based UI was possible and could be implemented with an AUI in an SOA. The following section concludes the chapter, and introduces the next phase of the research, the evaluation and the results of the study.
5.11 Summary The objective of this chapter was to determine how an AUI can be implemented using an SOA. Research question R4: How can an AUI be implemented using an SOA? was therefore answered in this chapter. This was achieved by discussing the implementation of the AUI components, which were analysed and designed in Chapter 4 as services. The Analysis Engine Service, Transformation Service and Watcher Services were realised to provide the adaptation in an SOA. A component of AUIs that was also implemented to enable user modelling and adaptation using an SOA is the knowledge base. The knowledge base contains the user model and the task model.
132
Implementation
The user model was implemented to define the users characteristics related to performance since it was found that CCAs differ greatly at the performance level (Section 3.3.2). The task model was taken from Jason‘s (2008) model and enhanced to support references for web services. The transformation was realised using a number of technologies including XML, XSLT transformations to create the UI and JavaScript to enable interaction with the UI. Two pilot studies were conducted to validate the UI generation process; and the results show positive feedback from the test subjects. The first pilot study showed that the UI generated were appropriate for users to interact with. A second prototype was therefore developed incorporating the UI generation components from the first pilot study. A second pilot study was conducted to uncover problems that might affect the main evaluation. Various technical issues were uncovered and rectified. Chapter 6 will discuss a comprehensive evaluation of the AUI services and the SOA application in which they are consumed.
133
Chapter 6: Evaluation and Results 6.1 Introduction Chapter 2 and 3 discussed the literature associated with the thesis statement (Chapters 1) concerning AUIs and SOA. A model was designed (Chapter 4) based on this literature and implemented as a prototype (Chapter 5). The objective of this chapter is to evaluate the design and implementation of this prototype. An evaluation strategy was devised (Section 6.2) in order to evaluate the design and implementation, thereof, based on the thesis statement: ―An adaptive user interface can be designed and implemented using service-oriented architecture principles‖. The objectives of this study as derived from the thesis statement can be achieved by answering the following research questions:
R4: How can an AUI be implemented using an SOA?
R5: Does the prototype indeed adhere to SOA design principles?
R6: How effectively can an AUI be achieved in a SOA?
R7: What is the usability of the generated user interface?
Prototyping can be used to test or evaluate a design (Preece et al. 2007). A prototype was therefore developed, based on the model proposed in Chapter 4, to answer the research question R4: How can an AUI be implemented using an SOA? This prototype was subsequently evaluated using the research questions R5 to R7. Various authors have used the verification approach to ensure that services in an organisation conform to SOA principles (Erradi, Anand and Kulkarni 2006; Kohlmann 2007). Verification of the prototype‘s services based on SOA principles will establish the services‘ conformity to SOA design principles (Section 6.3). Distributed systems are innately complex (Sommerville 2006; Josuttis 2007). Software Engineering metrics are used to measure the complexity of applications and the effort required to
Evaluation and Results
realise the applications (Pressman 2004). The prototype must therefore be evaluated using software engineering metrics to determine how effectively the implementation has been achieved using SOA (Section 6.4). UIs are central to any GUI application. In this study the UIs are generated from documents and scripts, and therefore there exists a possibility that the UI may not be generated with a usable interface (Gajos 2008). Usability testing is therefore conducted to determine the effect that generating the UIs has on novice CCA performance (Section 6.5). The usability evaluation is the main study in this research.
6.2 Evaluation strategy An evaluation strategy was devised to incorporate the various approaches required to achieve the objectives of this research. The strategy consists of four components, namely: a proof of concept, analytical evaluation, evaluation of software metrics and a usability evaluation. Each component of the evaluation strategy seeks to achieve a specific objective. This section motivates the evaluation strategy.
6.2.1 Proof of concept Chapter 5 discussed the implementation of an AUI in a CC using SOA. The implementation can be considered a proof of concept for an AUI using SOA. This component answered the research question R4: How can an AUI be implemented using an SOA? The prototype functionality was implemented in the form of services and a task model was used as a basis for the creation of novice and expert UIs.
6.2.2 Analytical evaluation Software services can be checked to ensure that they conform to SOA design principles (Patig 2009). Evaluation against design principles can be achieved using an analytical evaluation. Analysing the prototype can establish the extent to which software services conform to SOA principles. Erl (2008) outlines seven design principles for SOA systems which define best practice guidelines for designing SOA systems. An analytical evaluation will therefore be used to
135
Evaluation and Results
determine whether the prototype satisfies the SOA design principles. This component answered the research question R5: Does the prototype indeed adhere to SOA design principles?
6.2.3 Software metrics evaluation Current research on metrics for software development in general, focuses on traditional approaches to software development such as Object-Oriented (OO) and Procedural design (Perepletchikov et al. 2007). These metrics cannot thereby be readily applied to SOA because of the considerable structural differences between OO or Procedural systems and SOA (Perepletchikov et al. 2007). Coupling is the cornerstone to SOA design, since SOA advocates the loose coupling of components. Measuring the coupling between services in an SOA environment is an indicator of the maintainability, adaptability and flexibility of the service components in the environment (Perepletchikov et al. 2007). Effective SOA implementations depict loosely coupled characteristics between the implementation components. Degree of Coupling within a given set of services (DCSS) measures the coupling between the services in a system (Quynh and Thang 2009). This metric discussed offers a measurable way to determine the coupling between a set of services. Architectural design metrics are able to measure characteristics of a program‘s architecture (Pressman 2004). In order to evaluate the prototype architectural design, and ultimately its validity as an SOA application, these metrics give insight into the structural data and system complexity of the design. Architectural complexity affects the efforts required to integrate web services. The following architectural design metrics will therefore be measured:
Structural Complexity (SC): Measures of the structural complexity of a piece of code.
Data Complexity (DC): Indicates the complexity in the internal interface of a service.
System Complexity (SC): The sum of the structural and data complexity.
Evaluating the prototype based on SOA metrics thus answers the research question R6: How effectively can an AUI be achieved in a SOA? The results of the analysis of the proof of concept based on these metrics will be displayed in tabular format and the interpretations explained. This table will display all the main classes in the proof of concept and how the metrics apply to them.
136
Evaluation and Results
6.2.4 Usability evaluation The function of the UI is to provide an interface with which users can access the functionality of the underlying application. The UI must perform this function and allow its intended users to complete tasks using the applications underlying functionality. This section evaluates how effectively the generated UI allows users to perform the Call Logging task. A summative usability study is used to answer the research question R7: What is the usability of the generated user interface? Research has shown that novice users are primarily concerned with how to complete tasks (Section 3.4). For this reason, the users‘ goals for the usability study are performance-based. The goal of the usability study is therefore to determine the effect of the generated interfaces on novice CCA agents‘ performance. The Call Logging task has a clearly defined beginning (search customer) and end (call resolution). Furthermore, it is a task that is performed continuously by CCAs. Based on these characteristics, the Call Logging task can be classified as a transaction. The scenario used in this study is therefore the completion of a transaction of which the metrics typically involves the use of the following usability metrics (Tullis and Albert 2008): 1. Effectiveness: Task success to measure successful completion of the ―log call‖ task; and 2. Efficiency: Combination of the time-on-task and task success as a measure of efficiency. Vermaak (2008) states that CCAs at the NMMU ICT helpdesk, the helpdesk on which the prototype is based, are required to resolve tasks within two minutes of the call being placed. If a CCA is unable to resolve the call within this period he or she must assign the call to a technician. Efficiency will therefore be measured using this benchmark as the CCAs task success rate per two minutes. Research suggests 10-100 participants for a summative study (Tullis and Albert 2008). This study will use 30 participants for the usability evaluation. The following section outlines the evaluation by discussing the analytical evaluation of the AUI services using SOA design principles.
137
Evaluation and Results
6.3 Analytical evaluation In Chapter 1, the question has been asked R1: How can an AUI be implemented using an SOA? Chapter 5 answered this question by discussing the implementation of an AUI using SOA. This section argues that the software services of the prototype (the AUI components) indeed adhere to SOA design principles. An analytical evaluation is presented to show how the AUI services conform to the following SOA design principles, as proposed by Erl (2008) (Section 2.2.3): A. Service composability: ―Services are effective composition participants, regardless of the size and complexity of the composition”; B. Service coupling: ―Service contracts impose low consumer coupling requirements and are themselves decoupled from their surrounding environment‖; C. Service abstraction: ―Service contracts only contain essential information and information about services is limited to what is published in service contracts‖; D. Service statelessness: ―Services minimize resource consumption by deferring the management of state information when necessary; E. Service re-usability: ―Services contain and express agnostic logic and can be positioned as reusable enterprise resources‖; F. Service autonomy: ―Services exercise a high level of control over their underlying runtime execution environment‖; and G. Service discoverability: ―Services are supplemented with communicative meta data by which they can be effectively discovered and interpreted‖. Table 6.1 shows the SOA guidelines and how they can be measured (Erl 2008). The desirable and undesirable characteristics are labels that are applied to services depending on how well they conform to a principle. The levels that are underlined represent the highest level at which a service can conform to that principle. The AUI services include the Transformation Service, the Watcher Service and the analysis service. The following sections discuss the evaluation of these components according to the SOA design principles.
138
Evaluation and Results
139
Table 6.1: SOA Design Guidelines and how to measure them
Guideline
How to Measure Measure
Service Composability Service Coupling
Service Abstraction
Service Statelessness
Consumer Coupling Contract Content Abstraction Levels: Access Control Levels: Open / Controlled / No Access
Management
Service Reusability Service Autonomy
Implementation Isolation:
Service Discoverability
A.
Desirable Levels
Undesirable Levels
Composable
Not Composable
Centralised
Non Centralised
1.Concise 2.Optimised
Detailed
1.Partial Architectural (Moderate) 2.Full Architectural (High) 3.Internally Deferred (High) 1.Intention of re-use service 2.Frequency of use 1.Service logic (partial) 2.Pure (full) Sufficiently Described
Non-Deferred (Low to no) Partially Deferred Memory (reduced)
1.Service Contract (n/a) 2.Shared (none) Insufficiently described
Service composability: ―Services are effective composition participants, regardless of
the size and complexity of the composition”. The AUI services are designed to be autonomous and loosely coupled and therefore can interact with any applications or services that use the WSDL to interact with the AUI service. This effectively enables the AUI services to participate in any composition where the capabilities they possess are required. B.
Service coupling: “Service contracts impose low consumer coupling requirements and
are themselves decoupled from their surrounding environment”. Using a service contract essentially centralises the coupling at the service contract. The only binding that occurs is at the service contract. This type of binding is known as the consumercontract-coupling, and is a recommendation for services (Erl 2008). The service contract eliminates potential for direct connection to the service logic. This may lead to consumer-toimplement coupling (Erl 2008). Consumer-to-implement binding occurs when a service or
Evaluation and Results
application binds directly to a service‘s implementation. If, for example, the implementation of the service is altered, applications or services that use the altered service must also be updated. The services are decoupled from their implementation because service logic is hidden from the interface. The Transformation Service‘s service contract defines how services can transform any well-formed XML documents with well-formed XSLT documents by using the service. The Watcher Service‘s service contract defines how services can store user-interaction information in the user model. The Analysis Engine‘s Service contract defines how services can input a user‘s identification to perform user modelling. C.
Service abstraction: ―Service contracts only contain essential information and
information about services is limited to what is published in service contracts‖. Information that does not directly support service invocation is abstracted to the service logic. Each AUI service‘s WSDL contains information necessary for service invocation as a result. Access to documentation is closed and the only information accessible to designers is that which is available in the WSDL. The AUI services are each assigned an abstraction level as a result (Table 6.1). This is because minimal validation constraints are applied at the service contract since the major portion of the validation is performed in the web service logic. D.
Service statelessness: ―Services minimize resource consumption by deferring the
management of state information when necessary”. State information refers to dynamic information about the state of the web service. Two measures are taken to minimise the use of state information within the AUI services model. Firstly, web service annotations are applied which render services stateless, and all the state information is disregarded. Secondly, critical state information is deferred to appropriate resources which allow the services to work with state information. This allows the services to not manage state information themselves,. For example, a working data xml document is used to store ―in memory‖ data which services can access when the current user or call log information is required. E.
Service re-usability: ―Services contain and express agnostic logic and can be positioned
as reusable enterprise resources‖.
140
Evaluation and Results
The AUI services are not coupled to their implementation, external consumer applications or other services. Coupling refers to the level of dependency between services. This increases their potential for re-use. Tactical re-use refers to a services potential for re-use due to its highly decoupled design. Tactically, the Transformation and Analysis Engine can be re-used by any service looking in order to transform an XML document or perform user modelling for a specific set of users in a CC domain respectively. The Watcher Service is strictly designed to capture predictive features (PF) for specific information moments (IM). This service therefore has low tactical re-use. It does, however, have a high actual re-use rate within the study as it is constantly invoked to determine user expertise. Actual re-use for the Transformation and Analysis Engine services is limited to invocation for UI generation and the user modelling of users respectively. This service is invoked for every task defined in the task model; and re-use within the study is consequently high. It is important to note that service re-usability in a larger solution would most probably be much higher. This is a limited case study and the focus is on a small number of services; hence the low actual re-use of the services. F.
Service autonomy: ―Services exercise a high level of control over their underlying
runtime execution environment‖. The services are designed to operate independently of external environmental influences. This increases the reliability and predictability of services (Erl 2008). The service contract clearly defines the boundaries of the service logic, thus providing means to ensure there is little or no overlap in functionality with other services. G.
Service discoverability: ―Services are supplemented with communicative meta data by
which they can be effectively discovered and interpreted‖‖. The WSDLs of the AUI services are supplied with enough information to easily distinguish the services should they be deployed in a service repository. This information, known as meta-data provides not only documentation concerning the service and its capabilities; it also provides classification information which allows service consumers to search for services using keywords, for example.
141
Evaluation and Results
Table 6.2: Summary of analytical evaluation
Transformation A. Service Composability B. Service Coupling C. Service Abstraction
Composable Centralised Concise
D. Service Statelessness
Partial Architectural Tactical Actual
E. Service Reusability F. Service Autonomy G. Service Discoverability
High High Pure (full) Sufficiently Described
Watcher
Analysis
Composable Centralised Concise Partial Architectural Low High Pure (full) Sufficiently Described
Composable Centralised Concise Partial Architectural Low High Pure (full) Sufficiently Described
Analyisis
Transformation Service Coupling 100%
Service Autonomy
Service Coupling 100% Service Abstraction
50%
Service Autonomy
0%
50%
Service Abstractio n
0%
Service Reusability (Actual)
Service Statelessne ss
Service Reusability (Actual)
Service Reusability (Tactical)
Service Statelessn ess
Service Reusability (Tactical)
Watcher Service Coupling 100% Service Autonomy
50%
Service Abstraction
0% Service Reusability (Actual)
Service Statelessness
Service Reusability (Tactical)
Figure 6.1: Visualisation of Analytical Evaluation
142
Evaluation and Results
Table 6.2 provides a summary of the service evaluation using SOA design principles. The table shows the rating assigned to the AUI services based on the characteristics portrayed by the services. Green cells in the table represent full adherence to the design principle by the service. Yellow cells represent partial adherence. The information in Table 6.2 is evidence that the AUI services conform to SOA principles. Figure 6.1 illustrates the extent, as a percentage of achieved desirability to which the services adhere to the SOA design principles. As an example, for service autonomy, achieving pure autonomy equates to 100% while achieving Service logic (partial) equates to 75% (See Table 6.1). Table 6.2 and Figure 6.1 show that the required levels for SOA design are all clearly achieved. The desirable qualities of the SOA principles (Table 6.1) are achieved. It can therefore be stated that, according to the SOA principles, the AUI services are SOA-based.
6.4 Evaluation of software metrics Software engineering (SE) metrics measure the complexity and effort required to develop a system. They can also be used to measure the specific quality attributes of a system. The following section discusses SE metrics used to evaluate the prototype to show how effectively it was implemented by measuring the coupling and architectural design metrics.
6.4.1 Coupling metrics Degree of coupling within a given set of services (DCSS) This section discusses DCSS and how it is measured. It also explains how the DCSS was measured for the prototype in this study. The DCSS metric measures the degree of coupling between a given set of services. DCSS is computed on a given set of services and a low value signifies loose coupling between the given set of services while a high value signifies tight coupling. DCSS is measured using the equation in Figure 6.2:
143
Evaluation and Results
𝐷𝐶𝑆𝑆 = Where 1. 2. 3. 4.
𝑀𝑎𝑥 −
𝑢∈𝑉
𝑢∈𝑉 𝑑
𝑢, 𝑣
𝑀𝑎𝑥 − 𝑀𝑖𝑛
u and v are two services in the set of services d(u,v) is the distance between services u and v Max = K*V*(V-1) Min = V*(V-1) Where, a. K = Maximum value between any two services in the graph b. V = number of services (nodes in the graph)
Figure 6.2: Formula for DCSS
Measuring the DCSS of a group of services requires that firstly, a graph be created which depicts the interaction between the services for which the coupling will be measured. Figure 6.3 shows the graph for the AUI services and illustrates the interaction between the services. The nodes of the graph represent services, while the edges of the graph represent the interaction between the services. Figure 6.3 illustrates how the Transformation Service invokes the analysis engine to determine user expertise, and the analysis engine returns a value based on the query.
Transformation (A) 1
A
B
C
A
0
1
3
B
1
0
3
C
3
3
0
1 Analysis Engine (B) Watcher Service (C)
Figure 6.3: AUI Services Graph and Matrix
The Watcher Service does not interact with any of these services since its sole responsibility is to capture user-interaction data from the generated UI and to update the user model. The graph
144
Evaluation and Results
therefore has three nodes (the services) and an edge with a value of two (for the two-way interaction between the Transformation Service and the analysis engine). The next step involves calculating the K, V, Max and Min values and constructing a matrix of interaction. K is the highest edge value in the group of services and V represents the total number of nodes in the graph. The Max and Min are determined using the formula for max and min in Figure 6.3. The matrix in Figure 6.3 is used determine the coupling between the services. The AUI model services are labelled with letters in Figure 6.3. A is the Transformation service; B is the Analysis Engine and C is the Watcher service. The letters on the outer left most column and top row represent the above mentioned services. The values in the matrix represent the interactions between services. Where no interaction occurs, the value of K is inserted since K represents the highest interaction value. A Service cannot interact with itself; therefore 0 is used to represent that interaction. Service A does not interact with itself, so a value of 0 is assigned to that interaction. A interacts with B; therefore a value of 1 is assigned. B returns a value to A therefore that interaction is assigned a value of 1. A does not interact with C; therefore, the K value is assigned to that interaction. This continues until the entire matrix is complete. The occurrences of values are then summed up to give a total of all the interactions, that is 1 appears twice and 3 appears four times (i.e. (1*2) + (3*4) = 14). These values are then used in the DCSS equation to calculate coupling between the services. The DCSS was found to be 0.33 (abs). Quynh and Thang (2009) state that a lower value DCSS value equates to a lower degree of coupling between services. Any result between 0 and 1 means that coupling for that set of services is low. The coupling between the services can therefore be concluded to be low.
6.4.2 Architectural design metrics Architectural design metrics can be used to measure various characteristics of an application‘s architecture (Pressman 2004). Characteristics of an application such as structural complexity, data complexity and system complexity can be measured using software engineering metric models (Card and Glass 1990).
145
Evaluation and Results
6.4.2.1 Structural complexity Structural complexity measures the complexity of a module using the Fan-out approach (Card and Glass 1990; Pressman 2004). A module is any piece of code being evaluated and it could be a class or a procedure. Fan-out refers to the number of function calls made to external modules from within the module. For the purposes of this evaluation, fan-out refers to procedural calls to dependent classes and web services, i.e. calls to other web services as well as subordinate classes (e.g. data access class for a service). Fan-out is calculated for each procedure in a module, and the sum of all procedures‘ fan-out values is the fan-out of the module. Figure 6.4 shows the formula used to calculate the structural complexity of a system 𝑆 by adding up the fan-out for each module 𝑖 (Kan 2002):
𝑆=
𝑓2 𝑖 𝑛
Figure 6.4: Structural complexity formula
Where,
𝑓 2 (𝑖) is the fan-out of each class or module being evaluated and 𝑛 is the number f modules in a system. 6.4.2.2 Data complexity Data complexity is a measure of the complexity in the internal interface for a given module (Card and Glass 1990; Pressman 2004). Figure 6.5 (A) shows how the data complexity is measured for each module of a system, while Figure 6.5 (B) shows how the data complexity of each module in a system is added up to get the data complexity of a system.
𝐷 𝑖 =
𝑣(𝑖) 𝑓 𝑖 + 1
𝐴
𝐷=
𝐷 𝑖 𝑛
[𝐵]
Figure 6.5: Data complexity formulae
Where, 1. 𝑣(𝑖) is the number of input and output parameters passed to and from the module.
146
Evaluation and Results
2. 𝑓(𝑖) is the fan-out of each class or module being evaluated 3. 𝑛 is the number of modules in a system.
6.4.2.3 System complexity System complexity is a measure of the overall system complexity. Overall system complexity is affected when the structural and data complexity of components within a system change (Kan 2002; Pressman 2004). System complexity is measured by adding the structural and data complexity of a system using the formula in Figure 6.6:
𝐶 𝑖 = 𝑆 𝑖 + 𝐷 𝑖 Figure 6.6: System complexity formula
The AUI services of the prototype were evaluated using the above-mentioned architectural design metrics. The metrics show the level of complexity of the components when implemented in a SOA. High complexity values mean that complex code had to be written in order for the modules to function in an SOA, while low values mean that the complexity is low. Low complexity values are also a result of the abstraction of complexity to other modules (Kan 2002). Table 6.3 shows a summary of the metrics when applied to the AUI services of the prototype. Increased structural complexity increases the problem and perceived complexity of a system (Bundschuh and Dekkers 2008). A complex system requires more effort to implement. Low complexity values therefore indicate less effort in implementing a module. Table 6.3: Summary of Architectural Design Metrics for AUI services
Service
Architectural Design Metrics Structural Complexity Data Complexity
System Complexity
Transformation
0
2
2
Watcher
9
1.43
10.43
Expertise
1
1.5
2.5
Overall
10
4.93
14.93
The values in Table 6.3 show the structural and data complexity for the AUI services. The transformation and expertise services have extremely low structural complexity values. This was done intentionally to decouple the services from their external environment. The watcher class, however, has some level coupling and dependency hence the elevated complexity values.
147
Evaluation and Results
The structural, data and system complexity alone do not provide values that effectively determine the quality of a system. In order to determine good and bad quality values, the relative system complexity (RSC) must be determined for a system (Card and Glass 1990). This averages out the structural, data and system metrics over the entire system. The formula for RSC is shown in Figure 6.7 (Card and Glass 1990).
𝑅𝑆𝐶 = 𝑆 𝑛 + 𝐷 𝑛 Figure 6.7: Relative System Complexity
Using the values in Table 6.3, the AUI services RSC is 4.98. Card and Glass (1990) state that Good RSC = 26.5. The RSC value obtained for the AUI services is significantly lower than the threshold for Good RSC. The tables used to determine this are available in Appendix H.
6.4.3 Summary of evaluation by software engineering metrics This section discussed SE metrics to measure the complexity and effort required to implement the prototype. It was found that the coupling between services is low. Coupling between services was measured using the DCSS approach proposed as by Quynh and Thang (2009) which measures coupling between services using graphs. Architectural design metrics were also measured and they showed that the structural complexity and the data complexity of the AUI services were low. It can therefore be concluded that the overall system complexity for the AUI services is low. This implies that the AUI was achieved effectively using an SOA.
6.5 Usability evaluation of proof of concept The purpose of this section is to evaluate the generated UI by testing its usability. The experimental design of the evaluation is discussed, while with the evaluation metrics were used to measure user performance. The instruments used in the evaluation are also discussed. The exact procedure followed with each participant is presented and the participant selection methods are discussed. Finally, the evaluation results are presented.
148
Evaluation and Results
6.5.1 Experimental design Performance metrics are measured for the eight tasks outlined for users. The independent variables for the evaluation are the tasks; and the dependent variable being measured is the participant‘s performance. Participants are not expected to complete all the tasks, however, since the system may adapt when changing from one task to the next. The maximum number of tasks a user can perform as a novice is 7 tasks. The final task (task 8) is performed using the expert UI. This was done in order to allow all users to experience using the expert UI. As such, only the 7 novice tasks will be evaluated. The task plan is discussed further in Section 6.5.3.4.
6.5.2 Evaluation metrics Effectiveness Task success can be used to measure how effectively a user is able to complete a given set of tasks on a UI (Tullis and Albert 2008). Task success can be measured in two ways: binary success or levels of success. Binary success is a simple method that measures task completion as ‗Complete‘ or ‗Not Complete‘. The level of success method measures the degree to which users have completed a task. This can be measured as the percentage of a task the user has completed. The Call Logging task consists of four steps, namely: provide customer details, provide call logging details, assignment to technician and call resolution (Section 3.5.2). The appropriate measure of task success in this case is therefore the level of success, considering the different steps needed to complete the task and the varying importance of each step. This metric measures the degree to which users are able to complete the Call Logging task. Each sub-task represents a percentage of the overall task. There are four steps and each step therefore contributes 25% to the task completion. For this evaluation a 100 % completed task is one where the participant requires no aid and captures at least 75% of the query information correctly. Efficiency Time-on-task is a metric that measures the length of time a participant takes to complete a task. This is an important metric for tasks that are performed repeatedly since short completion times
149
Evaluation and Results
would mean more tasks can be completed (Tullis and Albert 2008). Combining this metric with task success shows the participant‘s task efficiency as the completion rate per unit of time.
6.5.3 Evaluation instruments This section describes the instruments used to conduct the evaluation including: location, hardware and software, questionnaires, task plan and the statistics used for analysis. 6.5.3.1 Location and Hardware Participants performed the required tasks in the Usability Laboratory in the Department of Computing Sciences at the Nelson Mandela Metropolitan University. The hardware used during the evaluation is the Tobii T60 Eye Tracker. Participants sat in the evaluation room, away from distractions, where they completed the tasks on the eye-tracking equipment while the evaluator sat in the control room monitoring the participants and issuing instructions.
6.5.3.2 Software The evaluation was conducted on a Tobii T60 Eye Tracker running Windows XP. The eye tracker allows evaluators to track where participants are looking during an evaluation. This information gives insight into a user‘s cognitive processes (Tullis and Albert 2008). It also provides quantitative statistics on where users look while using an application, allowing the evaluator to determine the effectiveness of UI designs and layouts. The software used to capture and manage eye tracking data is Tobii Studio 1.5.7. This software comes with the Tobii T60 Eye Tracker. It allows evaluators to perform usability experiments and provides various visualisation and comparison features used to analyse eye tracking data (Tobii 2009). Users interact with the application being evaluated while Tobii Studio runs in the background capturing eye tracking metrics. Tobii Studio can also be used to capture other metrics such as time on task since it captures screen recordings of participants performing tasks which can later be reviewed to establish the exact time on task. Participants were able to access and navigate the prototype using Firefox v3.5.5. This browser was selected because it was found to be the only browser that provides mouse event information for elements of a drop down list. Section 5.3 elaborated on the reasons for this.
150
Evaluation and Results
6.5.3.3 Questionnaire The evaluation in this study required participants to have some level of computer experience, sound knowledge of IT and no application or domain experience. A background questionnaire was therefore developed to capture user‘s details (Appendix F). This document is based on the Common Industry Format (CIF) document typically used in usability evaluations (Scholtz 2000). The background questionnaire provided a means to determine if participants met the requirements for the study. It was used to collect the following information:
Demographic Details: Demographic details such as gender, age, education and occupation;
Professional Experience: Participants experience at their current profession in years (if any);
Computer Experience: The numbers of year‘s participants have been using computers and their basic technical expertise (novice, intermediate or expert); and
Product Experience: The numbers of year‘s participants have been using call centre software.
6.5.3.4 Task plan A test plan which provided instructions on how to complete the tasks and information on the tasks to perform was created for the evaluation (Appendix G). The task plan was however only meant for the evaluator. The minimum number of tasks for a participant to complete before system adaptation is four. This allows the system to collect sufficient user-interaction data for user modelling and gives participants the opportunity to familiarise themselves with the UI (Tullis and Albert 2008). Some of the questions included in the task plan were taken from Jason‘s (2008) study. These were queries with solutions. Queries with solutions refer to queries that participants could solve themselves. Only four such queries were in the Jason study and therefore, additional queries were extracted from the customer query database at the NMMU ICT helpdesk and added to the task plan. These
151
Evaluation and Results
additional tasks have the same difficulty level as the previous four tasks and each has a solution. The task plan therefore consisted of 8 tasks in total.
6.5.3.5 Statistics The NMMU research statistician, Mr. Danie Venter, was consulted for all statistical related work during this study. Mr. Venter assisted with planning of data collection, and evaluation of data and results (Venter 2009). Microsoft Excel (Microsoft 2009a) was used to analyse metric data collected during the evaluation. Excel provides various statistical analysis and visualisation tools such as graphs and pie charts to analyse data. Descriptive statistics are used to describe data without making statements about the population from which the data is collected. Descriptive statistics were used to describe the data collected in the evaluation. The mean, median and standard deviation were used to describe the data in this evaluation:
Mean: This is the most common descriptive statistic (Tullis and Albert 2008). It shows the arithmetic average for all observations (Terre Blanche 2002a).
Median: This is the middle of the distribution. Half of all data falls below this point and the other half is above it.
Standard deviation: This measures the average that all observations have from the man (Terre Blanche 2002b).
6.5.4 Evaluation procedure The steps for conducting the evaluation were adopted from Pretorius (2005). Table 6.4 shows the procedure used for the evaluation. One participant was evaluated at a time. A role playing scenario was used for the evaluation and a simulated CC environment was created whereby the participant played the part of a CCA, while the instructor took the role of a customer calling into a CC with a query. This was so as to simulate how queries are resolved in practice. The instructor read queries to the user for two reasons. First, it simulates how queries are resolved at the NMMU ICT Helpdesk – the helpdesk being simulated - and it allowed the user to focus solely on the task at hand and not get distracted by having to read the task plan. This also maintains the users gaze on the eye-tracker (Pretorius 2005).
152
Evaluation and Results
Each participant completed the tasks in the test plan as the evaluator read the queries out to the participant. Participants were not required to complete a post-test questionnaire after the evaluation. Table 6.4: Evaluation procedure
Step
Step Description
1
Participants were welcomed by the test administrator
2
Participants were briefed about the following: The environment (usability laboratory) The eye-tracking equipment The purpose of the evaluation The evaluation procedure
3
Participants were asked to read the preamble letter (Appendix D) and complete a consent form (Appendix E)
4
The eye-tracker was calibrated for the participant.
5
The test administrator sat in the observer room whilst the participant sat in the participant room.
8
Participants were asked to commence with the evaluation. All interaction and eyetracking data were captured. The test administrator monitored the participant at all times. When the participant completed all tasks the session was ended and the test administrator answered any queries by the participants. The participant was thanked for his/her time.
9
Results (interaction and eye-tracking) were gathered and analysed.
6 7
6.5.5 Participant selection The intended user group for this study consists of novice CCAs. Novice CCAs have sound knowledge of IT-related issues, but have no experience using CC software. Participants were selected, based on their knowledge of IT, to allow them to assist users with queries. Consequently, the majority of participants were recruited from the NMMU Department of Computing Sciences Department. Thirty participants were recruited for the evaluation. The screening of participants was necessary in order to select a representative sample of users. A demographics questionnaire (Appendix F) was issued prior to the evaluation of participants to
153
Evaluation and Results
determine whether they possessed the appropriate knowledge and expertise to take part in the evaluation. The participants were not compensated for their participation.
Gender
Age 15-20
21-25
Male
26-30
Female
3% 14%
30%
70% 83%
A 10%
B Computer Experience (yrs)
Occupation
3% 3% 3%
2-5
4%
5-10
10+
3% 77%
Student Analyst Programmer Trainee Accountant Premiere Banker Self-Employed
C
Intermediate
D Call Centre Software Experience (yrs)
Computer Expertise Novice
44%
53%
Expert 0
7%
50% 43% 100%
E Figure 6.8: Demographic profile of test participants (n = 30)
F
154
Evaluation and Results
Figure 6.8 shows a summary of the participants selected for this study. Figure 6.8 (A) shows the age distribution of the participants (n=30). A total of 84% (n=25) of the participants were aged between 21-25 years old, while only 13% were between 26-30, and only 3 % (n=1) were between the ages of 15-20. The genders are shown in Figure 6.8 (B) and 70% (n=21) of the participants were males while 30% (n=9) were females. Figure 6.8 (C) shows the occupation of all participants. Seventy seven percent (n=23) of the participants were IT students from the Department of Computing Sciences; 10% (n=3) of the participants were lecturers from the department, and the remainder of the participants were from various occupations, namely: trainee accountants (n=1), premiere banker (n=1), analyst programmer (n=1) and a self-employed entrepreneur (n=1). Figure 6.8 (D) shows the computer experience of the participants. This represents how long participants have been using computers. A high of 97% (n=29) of the participants had more than five years of computing experience of which 44% (n=12) had five-to-ten years experience and 53% (n=17) had more than 10 years experience. Only 7% (n=1) had less than five years of computer experience. Figure 6.8 (E) shows the computer expertise and the Call Centre Software Experience of the participants. This Figure shows that 50% (n=15) of participants considered themselves to be computer experts; 43% (n = 13) of participants considered themselves to be intermediate computer experts while only 7% (n = 2) thought they were still novices. Figure 6.8 (F) shows that all participants (n = 30) had 0 years experience using Call Centre Software and could therefore be considered novices.
6.5.6 Evaluation results The results of the evaluation are discussed in terms of the performance metrics measured during the evaluation.
6.5.6.1 Effectiveness The log call task consists of four steps: provide customer details, provide call logging details, assignment to technician and call resolution. Task success is used to measure the completion of
155
Evaluation and Results
each task. Each completed step without assistance from the evaluator and at least 75% of the query information captured correctly constitutes a successful step completion (that is, 100% completion).The task plan consisted of eight tasks, but depending on the participants‘ performance the UI would adapt after at least four tasks. This meant that not all participants completed the same number of tasks. The only tasks that all participants completed were tasks one to four.
Task Completion Rates 100%
Percentage of Participants
90%
80% 70% 60% 50% 40%
30% 20% 10% 0%
Task 1 (n = 30)
Task 2 (n = 30)
Task 3 (n = 30)
Task 4 (n = 30)
Task 5 (n = 14)
Task 6 (n = 6)
Task 7 (n = 5)
0%
3.33%
0.00%
0.00%
0.00%
0.00%
0.00%
0.00%
25%
26.67%
0.00%
3.33%
3.33%
0.00%
0.00%
0.00%
50%
10.00%
13.33%
3.33%
6.67%
7.14%
0.00%
0.00%
75%
30.00%
30.00%
30.00%
26.67%
14.29%
33.33%
0.00%
100%
30.00%
56.67%
63.33%
63.33%
78.57%
66.67%
100.00%
Figure 6.9: Stacked bar chart showing levels of success
Figure 6.9 shows the task success and failure rates for tasks 1 to task 7. Each bar represents a task, and it is subdivided into blocks which represent the completion rate attained by participants. Task one shows poor performance, with only 30% of the participants (n=9) completing the task with a 100% success rate and only 60% (n=18) completing more than 75% of the task successfully. Over the course of the evaluation, however, the task completion rate is observed to increase. Task 4 has 90% (n=27) of the participants completing more than 75% of the tasks and task 7 has 100% of the participants completing 100% of the task. Only five participants
156
Evaluation and Results
attempted task 7, however, since the UI adapted for all the other participants before they attempted this task. This increase in the completion rate can be attributed to the learning effect. The more users interact with a UI, the more they become familiarised with it, thereby becoming more proficient at completing the tasks.
6.5.6.2 Efficiency Efficiency was measured using two metrics: time-on-task and a combination of time-on-task and task success rate. Figure 6.10 shows the mean time-on-task achieved by all participants (n=30) for task 1 to task 7. The average time to complete tasks reduced drastically after the first task showing that users required only one task to familiarise themselves with the UI. Figures 6.10 and 6.11 together show that participants did became more effective with every task, although the task time changed significantly after the first task. The success rate for each task was combined with the time-on-task to give a value for efficiency. CCAs from the NMMU ICT helpdesk are given approximately two minutes to resolve a query, after which the call must be assigned to a technician who can resolve the query (Vermaak 2008). Efficiency was therefore measured as the task completion rate per two minutes, that is, how many calls an agent resolves every two minutes. Figure 6.11 illustrates the efficiency rates for all the tasks completed by participants. This was done by measuring the efficiency as the completion rate per unit of time (two minutes in this case). A learning curve can also be observed from task 1 to task 7. Task 1 had the lowest efficiency rate of 37% which means that users were only capable of completing 37% of tasks every two minutes. This can be explained by the learning required to complete tasks. The lack of familiarity with the UI meant users could not use it efficiently. This is supported by the increase in efficiency rates in later tasks. Task 5 has the highest efficiency rate of 77%. Tasks 2, 4 and 7 had efficiency rates of 70%, 70% and 73% respectively, while task 3 and task 6 had efficiency rates of 68% and 69% respectively.
157
Evaluation and Results
Mean Time-on-task 250.00
Time-on-task
200.00
150.00
100.00
50.00
0.00
Task 1
Task 2
Task 3
Task 4
Task 5
Task 6
Task 7
Mean Time-on-task
223.82
146.18
155.43
149.14
143.86
160.17
163.33
Std.Dev
61.86
34.30
66.18
51.21
38.08
28.41
33.86
Figure 6.10: Mean Timer per task (sec)
Effeciency (Completion/time)
Efficiency 90 80
70 60 50 40 30 20 10 0 Effeciency
Task 1 Task 2 Task 3 Task 4 Task 5 Task 6 Task 7 37
70
68
70
77
Figure 6.11: Efficiency as Completion Rate/Time.
69
73
158
Evaluation and Results
These results indicate that the users could effectively and efficiently complete the tasks outlined in the task plan. By completing the tasks in good time and with few incomplete sections, it can be inferred that the generated UIs did allow users to complete the tasks. The results for this study are available in Appendix I.
6.5.7 Eye-tracking results Goldberg et al. (2002) as well as Pretorius (2005) have shown the added value that eye-tracking provides to usability evaluations. Eye-tracking data captured during the evaluation of the prototype for this study provided additional information on the efficiency and effectiveness with which participants were able to complete the tasks. Heat maps and areas of interests (AOI) were used to analyse eye-tracking data on the UIs of the four novice steps that comprise the Call Logging task. Heat maps reveal which areas participants focus on the most by showing areas of high eye-fixation as red areas, while regions with fewer fixations are green. Timer
Header Step Counter
Input Section
Customer Information
Figure 6.12: AOI for Novice Steps
AOIs are areas of an applications GUI that designers of the application see as an important element that users require to complete tasks using the application. Demarcating AOIs provides empirical evidence to evaluators as to the use of these elements. The generated novice UIs all have the same general layout, therefore, for each of the four steps four AOIs were defined, namely: the Header, Input Section, Timer and Step Counter. Each of these AOIs is shown in Figure 6.12.
159
Evaluation and Results
The AOIs were demarcated to establish which areas of the screen users were focusing on. Wandering fixations usually reveal that users are either lost, or do not understand what to do (Pretorius 2005). The heat maps in Figure 6.13 show the heat map for step one to four of the Call logging task for all participants (n=30).
Figure 6.13: Heat map showing fixations for step one to four of Call Logging task (n=30)
The heat maps reveal that users did notice all the major elements that were generated as part of the novice UI. The input section received the largest majority of fixations (count=221) for all participants (n=30) and is clearly where the majority of red areas appear in Figure 6.13. This was expected since this is the section where users input information related to resolving customer queries. Evidence from the heat map images points to the fact that the UI generated did not confuse or distract the users. In fact, users were able to clearly distinguish the different sections of the UI and thus complete the tasks effectively and efficiently. Users regularly checked the customer
160
Evaluation and Results
information AOI when entering customer data, as it was important to keep a track of the customer during the course resolving the customer query.
AOI fixation count: Step 1-4 (n=30) 250 200 150 100 50 0 Customer Input Section Step Header Information
Timer
Step Counter
fixation count
Figure 6.14: Fixation count of AOIs
Figure 6.14 supports the heat maps by showing the total fixations for each AOI for steps one to four of the Call Logging task. Customer information and Input Section have the only visible fixation counts in Figure 6.14. Although users did notice the other elements, such as the Step Header, which provides the step name, and the Step Counts, which provides information as to the current step, they did not see these as important in assisting them with the tasks, hence the very low fixations.
6.6 Conclusions This chapter has discussed the evaluation of this project by employing a four component evaluation, namely, a proof of concept (Chapter 5), an analytical evaluation (Section 6.3), an evaluation of software engineering metrics (Section 6.4) and a usability evaluation (Section 6.5). The four components of the evaluation strategy together prove that an AUI can be implemented using an SOA effectively and the UI is usable. The aim of the evaluation was to answer research questions R4 to R7 outlined in Section 1.4.4. The proof of concept is the implementation of the prototype which is explained in Chapter 5 which answered the research question R4: How can an AUI be implemented using an SOA? The analytical evaluation involved the evaluation of the implementation to determine if the AUI
161
Evaluation and Results
services conform to SOA principles. It answered the question R5: Does the prototype adhere to SOA design principles? The AUI services were analysed using SOA design principles. The results of this evaluation indicated that the services conform to the SOA design principles. Table 6.5: Summary of the results of the evaluation
Research Question
Answer
R4: How can an AUI be implemented using an SOA? R5: Does the prototype indeed adhere to SOA design principles? R6: How effectively can an AUI be achieved in a SOA? R7: What is the usability of the generated user interface?
The evaluation of software engineering metrics used coupling metrics and architectural design metrics to evaluate how effectively – in terms of software engineering – the implementation was achieved. It answered the question R6: How effectively can an AUI be achieved in a SOA? It can be inferred that the AUI services were indeed effectively implemented based on the results of this evaluation which show that:
The coupling between the AUI services is low; therefore, the services are easily interchangeable, reusable and loosely coupled. Furthermore, they are self contained and not influenced by external environment.
The complexity of the AUI services is also low, thereby showing that the services were implemented without extraneous effort.
The evaluation of the usability of the SOA application created using the AUI services was performed to evaluate the effect that generating the UI has on the effectiveness and efficiency of CCAs. This component answered the question R7: What is the usability of the generated user interface? Results of the usability study and eye-tracking show that users were capable of completing the Call Logging task at the required efficiently rates and with minimal incomplete sections and errors. Literature has shown that UIs for SOA research is on the increase. This is attributed to the benefits of the loosely coupled design of SOA components. The evaluation in this study has shown that the UIs for SOA can be made adaptive thus providing AUIs in a loosely coupled
162
Evaluation and Results
manner. This can be achieved effectively with low complexity. Usability testing and eye-tracking results show that this approach does not impede end-users ability to perform their tasks. The results of the evaluation strategy clearly indicate that an AUI can indeed be designed and implemented effectively using SOA. Chapter 7 concludes this study summarising its contribution and achievements, as well as outlining possibilities for future research.
163
Chapter 7: Conclusions and Recommendations 7.1 Introduction Service-oriented architectures (SOA) are being adopted in industry at an unprecedented rate. The benefits gained by using SOA such as business agility and short response times are driving this growth in adoption. Providing user interfaces (UIs) in a service-oriented (SO) environment poses various challenges. One such challenge is the UIs inability to cater for the differences in user needs, preferences and abilities. Adaptive user interfaces (AUIs) have been proposed as a solution to the growing disconnection between the needs, preferences and abilities of users and the capability of UIs to accommodate these differences to the individual users. The aim of this dissertation was to develop an AUI using an SOA. A model was developed (Chapter 4) using knowledge acquired from the existing literature (Chapters 2 and 3) consequently a proof of concept prototype was implemented (Chapter 5) and evaluated (Chapter 6) to demonstrate its adherence to SOA principles, its effective implementation and its ability to allow novice contact centre agents (CCAs) to complete Call Logging tasks. In this chapter, the objectives of this research are to be revisited in order to determine whether these objectives have been achieved. Theoretical and practical contributions of this research are highlighted and the limitations of this research are presented. Finally, recommendations for theory, practice and future research will be made.
7.2 Research contributions The research objectives, as stated in Section 1.4.3 were:
To gain a comprehensive understanding of SOA and its enabling technology – Web Services (Chapter 2).
To understand AUIs and their components (Chapter 3).
To understand user expertise and the implications it has on UI design (Chapter 3).
To determine how an AUI can be designed using an SOA (Chapter 4).
To determine how an AUI can be implemented using an SOA (Chapter 5).
Conclusions and Recommendations
To evaluate the SO design and implementation of an AUI (Chapter 6).
These objectives and the research questions in Section 1.4.4 were analysed and discussed in the chapters of this dissertation. Table 7.1 shows the research question from chapter 1 and how each research question was answered by a comprehensive discussion in a chapter. Table 7.1: Research Questions and Methodology
R1 R2 R3 R4 R5 R6 R7
Research Questions
Chapter Answered
What is SOA and what are its components? What are AUIs and what are the components of an AUI? How can an AUI be designed using an SOA? How can an AUI be implemented using an SOA? Does the prototype adhere to SOA design principles? How effectively can an AUI be implemented in an SOA? What is the usability of the generated user interface?
Chapter 2 Chapter 3 Chapter 4 Chapter 5 & 6 Chapter 6 Chapter 6 Chapter 6
This remainder of this section outlines the theoretical and practical contributions of this research.
7.2.1 Theoretical contributions The theoretical achievements of this research are highlighted in the investigation done into AUIs and SOA. The achievements include:
Research into SOA and AUIs;
The development of a method for the analysis and design of an AUI using SOA;
The application of this method and its outcome the AUI services model; and
The evaluation strategy used to evaluate the model and the prototype developed as a proof of concept.
7.2.1.1 Literature review Service-oriented architectures (SOA) Research Questions addressed: R1 - What is SOA and what are its components? This study undertook an in depth investigation of SOA and its components in Chapter 2. Its relation to enterprise architectures (EA) and distributed architectures highlighted the similarities as well as the differences between SOA and architectures similar to it. SOA is an architectural
165
Conclusions and Recommendations
style and design paradigm that advocates the loosely coupled and agnostic design and construction of distributed systems. The construction of a system in this way enables the system to be agile and thus more adaptable to changing business requirements. The components of a system are consequently designed as services. SOA applications and system consist of three main components, namely, the service consumer, the service provider and the registry. A service is an autonomous unit of functionality. Essentially, it provides a discrete function in a stateless and agnostic environment. Services or applications, referred to as service consumers, can re-use a service‘s functionality without having to implement it themselves. This is achieved by invoking the service, which subsequently performs its function and, if that is part of its function, returns a value. Various standards exist to facilitate the searching, linking and invocation of services (Bellwood et al. 2004; W3C 2006; W3C 2007; W3C 2009d). Universal Discovery Description and Integration (UDDI) is a repository protocol which allows service consumers to search a repository of services based on the descriptions of services. Service consumers are then capable of bind to any service, using the services‘ interface defined by the WSDL. Web Services Description Language (WSDL) defines the operations of a service and how external applications or other services can bind to the service in order to invoke its functionality. Simple Object Access Protocol, now simply known as SOAP, is a transportation protocol used to transport messages between services providers and service consumers.
Adaptive User Interfaces (AUI) Research question addressed: R2 - What are AUIs and what are the components of an AUI? Chapter 3 discussed the topic of AUIs. Research into AUIs has increased in recent years due to the increasing complexity of applications and their UIs. The aim of AUIs is to increase the flow of information between humans and computers by adapting the UI. AUIs provide a variety of functions, such as automatic completion of mundane tasks, giving advice about system use or controlling a dialogue. These functions assist the users of AUIs in achieving their goals with the system. Most notably, AUIs can adapt the UI to suit the needs, preferences or traits of its users. This is achieved by modelling users and monitoring the characteristics which differentiate users.
166
Conclusions and Recommendations
An AUI can be separated into three distinct components, namely: the inferential, afferential and efferential components of adaptivity. The afferential component captures user-interaction data and stores the data in the knowledge base. The knowledge base is a collection of models about the AUIs environment including the user, the task, the system and the domain. The AUI uses information in the knowledge base to make inferences about its environment and adapt itself if necessary. This inferring functionality is provided by the inferential component. The inferential component uses various methods to analyse the AUIs environment by using the data stored in the knowledge base. It subsequently makes inferences about the environment. The afferential component decides how to adapt the AUI based on the inferences made by the inferential component.
7.2.1.2 Service-oriented analysis and design method Research question addressed: R3 - How can an AUI be designed using an SOA? Existing service-oriented (SO) analysis and design methods are either proprietary or have not been proven as being effective through extensive use in industry. As such a hybrid method was devised in the analysis and design of the model for this study. This method combined two existing methods, namely, SOMA (Arsanjani 2004) by IBM, and Erl‘s (2008) SO analysis and development method (SOADM). SOMA is a proprietary method. IBM, however, provides sufficient information (Arsanjani 2004; Arsanjani et al. 2008) about the higher level components of this process to understand the process and possibly to apply it. SOMA is an industry proven but proprietary method, and as such information on specific aspects of the SOMA process is not publicly available (Ramollari et al. 2007). SOADM, although unproven in industry, provides details on specific aspects of SO analysis and design. The specific details provided SOADM, which relate to components found in SOMA, provide vital information that is not made public in the SOMA method. As such, SOADM specifics are used to complement the SOMA method and a hybrid SO analysis and design method is the result. The hybrid approach consisted of the three components of the SOMA approach, namely: SO Analysis (Section 4.3), Design (Section 4.4) and Realisation (Section 4.5). SO Analysis consisted of the definition of requirements (Section 4.3.1) and identification of automated
167
Conclusions and Recommendations
systems (Section 4.3.2). SO Design consisted of the composition of SOA by selecting the appropriate service layers (Section 4.4.1), designing services using service specifications (Section 4.4.2.1) and designing SO processes (Section 4.4.3). The final step of the process was the decision on how to realise the services (Section 4.5).
7.2.1.3 AUI services model Research question addressed: R3 - How can an AUI be designed using an SOA? The AUI services model developed in this research provides a means for AUI services to be implemented in a network and accessed as a discrete function. The model, by virtue of being implemented as services, is a collection of loosely coupled AUI components that interact together to provide adaptation functions. Research into SOAs has shown the increased adoption of this architectural style to integrate disparate platforms. A major hurdle identified is how to establish the right UI with which endusers can access information in an SOA. Various approaches exist as solutions to this problem such as web-based Portlets or desktop-based smart clients (Tibco 2006). By their very nature, integrated systems are high information environments. A second and sometimes less obvious issue with UIs in high information environments is that end-users of the UIs differ in many ways. End-users differ in preference, ability and needs; and currently UIs for integrated systems or complex desktop systems for that matter, do not adequately address this difference. AUIs have been proposed as a solution for this problem. This research consequently developed a model for AUIs based on existing SOA and web services UI methods to provide an AUI services model (Figure 7.1). This model was developed by applying the SO analysis and design method described in Sections 4.3 and 4.4 to an existing AUI scenario. The model consists of services developed around traditional AUI components: the afferential component, the inferential component and the efferential component of adaptivity. The afferential component of adaptivity (Section 3.2.5.1) consists of a Watcher Service which captures data and stores them in the knowledge base.
168
Conclusions and Recommendations
The AUI services model uses a knowledge base consisting of a user and task model. The user model stores characteristics that distinguish users from each other, for example, performancerelated information. The task model defines the task(s) that the end-users perform and which the AUI monitors. The inferential component of adaptivity (Section 3.2.5.2) consists of an Analysis Engine Service which performs user modelling on the user-interaction data captured by the Watcher Service. Finally, the efferential component of adaptivity (Section 3.2.5.3) consists of a Transformation Service which uses output from the user modelling component, the Analysis Engine Service, in order to generate UIs with appropriate adaptations included in this new UI.
Figure 7.1: AUI services model
7.2.2 Practical contributions The main practical contribution of this dissertation is the implementation of a prototype as proof of concept for the proposed AUI services model. The second practical contribution is the
169
Conclusions and Recommendations
evaluation of the prototype. These contributions and the research questions they addressed will be discussed in the following sub-sections.
7.2.2.1 Development of a prototype as proof of concept Research question addressed: R4 - How can an AUI be implemented using an SOA? This research provided several practical contributions. The implementation of a proof of concept of an AUI service model serves to show that an AUI can be implemented using an SOA (Chapter 4). The prototype was implemented effectively to adhere to SOA principles outlined in Section 2.2.3. An analytical evaluation proves this (Section 6.3). Various technologies came together around the web services to realise the prototype, most notably the XML based web service standards, JavaScript for the UI interaction and C# for the service functionality. Various web services were developed to provide functionality for contact centres (CC), which is the domain of the prototype. UIs were then generated for these web services to allow end-users to interact with them and complete the Call Logging task. The UI with which users would interact was design to be an AUI. The AUI services developed from the AUI service model in Chapter 4, provided this functionality by collecting user-interaction data, storing them in a user model, making inferences on this data and generating new UIs based on the inferences made. The prototype consisted of three layers, the UI shell, the application web services and the AUI services. The UI shell provided a blank HTML template where the generated UI was injected to create a new UI. The application services provided discrete CC functionality while the AUI services provided the AUI functionality.
7.2.2.2 Evaluation of the prototype This research set out to determine how to implement an AUI using SOA. Several objectives were also outlined to guide how this implementation was to be achieved. Research questions based on these objectives were formulated and they are:
R5: Does the prototype indeed adhere to SOA design principles?
R6: How effectively can an AUI be achieved in a SOA?
R7: What is the usability of the generated user interface?
170
Conclusions and Recommendations
A three component evaluation strategy was devised to answer the research questions above and determine if the research objectives were achieved. This evaluation consisted of the following:
An analytical evaluation: SOA is an architectural style and design paradigm. It advocates the development of application and system components as services. Erl (2008) proposes a set of SOA design principles for the development of SOA systems. In order to determine whether the prototype actually adhered to SOA design principles, it was evaluated against these principles using an analytical evaluation. The outcome of this analysis was that the AUI services model did indeed adhere to the SOA design principles as outlined by Erl (2008). This component thus answered the research question R5: Does the prototype indeed adhere to SOA design principles?
Evaluation by Software Engineering Metrics: SOA is a distributed architecture, with many of the components of SOA system designed to run on different platforms and servers and probably in different locations. Distributed systems are innately complex, but the AUI services model cannot be overly complex, otherwise it introduces new issues such as barriers of entry for organisations seeking to use it. The crux of SOA is that its components are loosely coupled. A software engineering coupling metric was, therefore used to measure the coupling between the AUI services model. A high degree of coupling means that changes to one service affect other services in its environment; therefore a low degree of coupling is always desired. System complexity metrics were used to measure the complexity with which the functionality of the AUI services model was achieved. Results showed that there was little coupling between the services and the prototype was implemented with little complexity. Therefore the research question R6: How effectively can an AUI be achieved in a SOA? was adequately answered.
Usability Evaluation of the Generated UIs: This research implemented the AUI services model by taking advantage of a currently existing method for creating UIs that change, generating the UI. By generating the UI, changes to the UI could be created on-the-fly. This approach implies that different adaptations can be included in the UI and the UI has control over very specific elements of the UI. Generating UIs however, does not always produce desirable results. Therefore, a usability evaluation was conducted to determine if the generated UIs allowed end-users to complete their tasks effectively and efficiently. The evaluation consisted of a convenience sample of thirty participants selected because
171
Conclusions and Recommendations
they have profiles similar to that of novice CCAs. A biographical questionnaire was used to determine if participants were suitable participants (Appendix F). Each participant was evaluated in a controlled environment to avoid distractions. In addition, eye-tracking was used to confirm the results of the evaluation. The usability evaluation results and the eyetracking results confirm that the participants completed the tasks in an effective and efficient manner, thus showing that the UI did in fact generate usable interfaces with which users could interact and also answering the research question R7: What is the usability of the generated user interface? The test results of the main study in which the prototype was evaluated prove that an AUI can be effectively implemented using SOA.
7.3 Benefits of the research This research showed that an AUI can effectively be implemented using an SOA. Various benefits can be derived from this research: Reduced development time: The UIs generated from the work in this study were generated directly from the task model. Using this approach, the development of AUIs can be reduced to defining the AUI using the task model and linking it to various services that provide adaptive functionality. Loosely Coupled Components: Since the components of the AUI are implemented as distributed services, they are easy to maintain thanks to their loosely coupled nature. Applications can also easily exchange functionality, for example, employ a different user modelling technique by simply changing the service that provides that function.
7.4 Limitations of the research The research has several limitations. The Watcher web service is not as re-usable as it could be, due to its nature of capturing data for specific interface events and elements. This is evident in its high complexity levels, as demonstrated in the software engineering evaluation section of this research (Table 6.3). Recommendations to improve this and make it more re-usable would be to
172
Conclusions and Recommendations
make the data capturing more generic. In this study, data from the UI was captured generically, that is, a data collection function managed event capturing for all the IMs. The Watcher Service required information about which IM the data related to, which resulted in some coupling issues. The capturing of different types of UI interaction events can be achieved without specifically noting the element from which this data came. For example, in this study, specific IMs were defined. However, if the IMs are marked as ‗drop-down list‘ or ‗button‘, then the data collected can be aggregated on-the-fly, and stored as a single parameter for all ‗dropdown lists‘ or ‗buttons‘. The AUI component of this study is based on an existing AUI developed by Jason (2008) comparing the prototype from this study with that of Jason is not possible since this study implemented an AUI by using an SOA.
7.5 Recommendations for future research SOA is an increasingly popular architecture for realising the goals of interoperability in industry. This research showed that an AUI can be implemented by using an SOA. This was achieved by leveraging existing research into UI generation by using a core component of the AUI, the task model, and generating a UI based on this. Various other avenues for future research were identified during the course of this research. These are discussed in this section. During this research, a need to provide definitions of UI elements and a means to define how these elements relate to each other was identified. The Object Layout Hierarchy was used to satisfy this need; however, the development of an ontology for web services UI could provide a more reliable means of defining web service elements, their layouts and the relationships between elements from different services. Generating the UI was chosen as the best approach to deliver the UI of web services. Currently there exist Abstract User Interface languages that provide a means to define a UI in abstract notation and subsequently create a concrete UI from this abstract notation. However, none of the abstract languages examined were found mature enough for use in this research. In future, when more work exists in abstract UI notation, the implementation of Web Service UI using Abstract
173
Conclusions and Recommendations
UI notation could provide better UI controls and a wider range of platforms for which UIs can be created. During this research, adaptable UIs and adaptive UIs were compared. Adaptable UIs were found to allow users to define how the UI must look. The combination of this approach and a dynamic task model could provide a means for users to dynamically define the UI for a business process. This is similar to what Nestler (2008) proposes, however, this could be looked at from the perspective of generating UIs for different platforms. The scope of SOA is usually the enterprise. Enterprise architectures are large and span multiple departments and even organisations. The prototype implemented in this study was evaluated in a closed and controlled environment. Further research could evaluate the AUI services model in a commercial environment with a greater number of services running on various platforms.
7.6 Summary The thesis statement for this research study, as stated in Section 1.4.2 was: An adaptive user interface can be designed and implemented using service-oriented architecture principles. The goal of this research was to implement an AUI using SOA. Following the thesis statement, an AUI model for contact centres (CCs) was analysed and designed using a service-oriented method (Chapter 4). The model was subsequently implemented (Chapter 5) as a proof of concept. The proof of concept serves to show how an AUI can be implanted using an SOA. It was evaluated using an analytical evaluation, to determine the extent to which the prototype adheres to SOA principles, software engineering metrics, to determine how effectively it was implemented and finally a usability study to evaluate the generated UI (Chapter 6). The statistical results from the evaluation show that the implementation was successful, and a usability evaluation, supported by eye tracking, showed that the prototype implemented allowed users to complete their tasks effectively and efficiently. The goal of this research was thus successfully achieved theoretically, with the SO analysis and design method for the proposed model, the model itself and its evaluation, and practically by the implementation of the model as a proof of concept.
174
References ABRAMS, C. and SCHULTE, R.W. (2008): Service-Oriented Architecture Overview and Guide to SOA Research [online]. Report Number G00154463. Gartner. Stamford, CT, USA. Available at: http://www.gartner.com/DisplayDocument?doc_cd=154463. [Accessed on: 12 November 2009]. ALVAREZ-CORTES, V., ZAYAS-PEREZ, B.E., ZARATE-SILVA, V.H. and URESTI, J.A.R. (2007): Current Trends in Adaptive User Interfaces: Challenges and Applications. In Proceedings of Electronics, Robotics and Automotive Mechanics Conference. pp. 312317. AMAZON (2009): Amazon Elastic Compute Cloud (Amazon EC2) [online]. Available at: http://aws.amazon.com/ec2. [Accessed on: 13 March 2009]. AMSDEN, J. (2007): Modeling SOA: Part 2. Service specification [online]. Available at: http://www.ibm.com/developerworks/rational/library/07/1009_amsden/index.html. [Accessed on: 20 May 2009]. ANDREWS, T., CURBERA, F., DHOLAKIA, H., GOLAND, Y., KLEIN, J., LEYMANN, F., LIU, K., ROLLER, D., SMITH, D., THATTE, S., TRICKOVIC, I. and WEERAWARANA, S. (2003): Business Process Execution Language for Web Services [online]. Version 1.1. OASIS. Billerica, MA. Available at: http://xml.coverpages.org/BPELv11-May052003Final.pdf. [Accessed on: 13 April 2009]. APPLE (2009): Safari 4 [online]. Available at: http://www.apple.com/safari/. [Accessed on: 11 June 2009]. ARMBRUST, M., FOX, A., GRIFFITH, R., JOSEPH, A.D., KATZ, R.H., KONWINSKI, A., LEE, G., PATTERSON, D.A., RABKIN, A., STOICA, I. and ZAHARIA, M. (2009): Above the Clouds: A Berkeley View of Cloud Computing [online]. UCB/EECS-2009-28. University of California at Berkeley. Available at: http://www.eecs.berkeley.edu/Pubs/TechRpts/2009/EECS-2009-28.html. [Accessed on: 18 December 2009]. ARSANJANI, A. (2004): Service-Oriented Modeling and Architecture (SOMA) [online]. Available at: https://www.ibm.com/developerworks/webservices/library/ws-soa-design1/. [Accessed on: 20 May 2009]. ARSANJANI, A., GHOSH, S., ALLAM, A., ABDOLLAH, T., GANAPATHY, S. and HOLLEY, H. (2008): SOMA: A method for developing service-oriented solutions. IBM Systems Journal. 47(3), July 2008, pp. 377-396. ATKINS, D.E., DROEGEMEIER, K.K., FELDMAN, S.I., GARCIA-MOLINA, H., KLEIN, M.L., MESSERSCHMITT, D.G., MESSINA, P., OSTRIKER, J.P. and WRIGHT, M.H. (2003): Revolutionizing Science and Engineering Through Cyberinfrastructure:Report of the National Science Foundation Blue-Ribbon Advisory Panel on Cyberinfrastructure [online]. National Science Foundation. Available at: http://www.nsf.gov/od/oci/reports/atkins.pdf. [Accessed on: 30 April 2008]. BELLWOOD, T., CAPELL, S., CLEMENT, L., COLGRAVE, J., DOVEY, M.J., FEYGIN, D., HATELY, A., KOCHMAN, R., MACIAS, P., NOVOTNY, M., PAOLUCCI, M., VON RIEGEN, C., ROGERS, T., SYCARA, K., WENZEL, P. and WU, Z. (2004): UDDI Version 3.0.2 [online]. Available at: http://www.uddi.org/pubs/uddi_v3.htm. [Accessed
References
on: 20 August 2008]. BENYON, D. and MURRAY, D. (1993): Applying user modeling to human-computer interaction design. Artificial Intelligence Review. 7(3/4), pp. 199-225. BIANCO, P., KOTERMANSKI, R. and MERSON, P. (2007): Evaluating a Service-Oriented Architecture [online]. CMU/SEI-2007-TR-015. Software Architecture Technology Initiative. Available at: http://www.sei.cmu.edu/reports/07tr015.pdf. [Accessed on: 28 October 2008]. BRAUN, C., BROBERG, J., CASSIDY, M., FREEDMAN, M., JONES, T.N., SCHAECK, T. and TAYAR, G. (2007): Web Services for Remote Portlets Specification [online]. The Organization for the Advancement of Structured Information Standards [OASIS]. Available at: http://www.oasis-open.org/committees/wsrp. [Accessed on: 23 May 2008]. BROWNE, D., NORMAN, M. and RICHES, D. (1990): Why Build Adaptive Systems? In Adaptive User Interfaces. pp. 15-58. BROWNE, D., TOTTERDELL, P. and NORMAN, M. (eds). London, UK: Academic Press. BRUSILOVSKY, P. (1996): Methods and techniques of adaptive hypermedia. User Modeling and User-Adapted Interaction. 6(2), pp. 87-129. BRUSILOVSKY, P. and SCHWARZ, E. (1997): User as Student: Towards an Adaptive Interface for Advanced Web-Based Applications. In Proceedings of the Sixth International Conference on User Modeling (UM '97). Chia Laguna, Sardinia, Italy. Springer. pp. 177-188. June 2-5 1997. BUNDSCHUH, M. and DEKKERS, C. (2008): The IT Measurement Compendium: Estimating and Benchmarking Success with Functional Size Measurement. Berlin / Heidelberg. Springer. pp 644. BURR, M. (2006): Processing WSDL documents with XSLT: Tips and tricks for transforming Web service WSDL documents using XSLT stylesheets [online]. Available at: http://www.ibm.com/developerworks/webservices/library/ws-xsltwsdl/. [Accessed on: 30 April 2009]. BUXTON, W.A.S., KURTENBACH, G.P. and SELLEN, A.J. (1993): An empirical evaluation of some articulatory and cognitive aspects of "marking menus". Human Computer Interaction. 8(1), pp. 1-23. BUZZWORD (2009): Buzzword [online]. Available at: https://buzzword.acrobat.com/. [Accessed on: 20 April 2009]. CAÑAS, M.A., HIERRO, J.J., HOYER, V., JANNER, T., LIZCANO, D., REYES, M., SCHROTH, C. and SORIANO, S. (2007): Enterprise Mashup. Putting a face on the next generation global SOA. In Proceedings of the 8th International Conference on Web Information Systems Engineering. Nancy, France. Lecture Notes in Computer Science. 4831: BENATALLAH, B., CASATI, F., GEORGAKOPOULOS, D., BARTOLINI, C., SADIQ, W. and GODART, C. (eds). Springer Berlin / Heidelberg.3-6th December, 2007. CARD, D.N. and GLASS, R.L. (1990): Measuring Software Design Quality. University of Michigan, Detroit, USA. Prentice Hall. CARPENTER, H. (2009): Gartner Hype Cycle for Emerging Technologies 2009: What‟s Peaking, What‟s Troughing? [online]. Available at: http://bhc3.wordpress.com/2009/07/27/gartner-hype-cycle-2009-whats-peaking-whatstroughing/. [Accessed on: 12 November 2009]. CERAMI, E. (2002): Web Services Essentials Distributed Applications with XML-RPC, SOAP, UDDI & WSDL. Sebastopol, California, USA. O'Reilly Media.
176
References
CHAPPELL, D. (2009a): Introducing Windows Azure [online]. White Paper. David Chappell and Associates. Available at: http://download.microsoft.com/download/0/C/0/0C051A30F863-47DF-BC539C3CFA88E3CA/Windows%20Azure%20David%20Chappell%20White%20Paper%20 March%2009.pdf. [Accessed on: 20 April 2009]. CHAPPELL, D. (2009b): Introducing The Windows Azure Platform: An Early Look at Windows Azure, SQL Azure, and .Net Services [online]. David Chappell and Associates. Available at: http://download.microsoft.com/download/8/2/5/825A26EF-8561-4891-A8B5516337590BF0/SplusS09_Ketnote_e.pdf. [Accessed on: 20 April 2009]. CLEMENT, L. and ROGERS, T. (2004): Using WSDL in a UDDI Registry [online]. Specification Report. Organisation for the Advancement of Structured Information Standards Available at: http://www.oasis-open.org. [Accessed on: 20 August 2008]. COLAB (2007): SOA and EA [online]. Available at: http://colab.cim3.net/file/work/pgfsoa/pgfsoaea/SOA%20and%20EA%20Key%20Messages_Final%20Draft.doc. [Accessed on: 12 January 2009]. CROW, D. and SMITH, B. (1993): The Role of Built-in Knowledge in Adaptive Interface Systems. In Proceedings of the 1st international conference on Intelligent User Interfaces. Orlando, Florida, United States. ACM. pp. 97-104. DAVIES, D. (2006): SOA at the User Interface [online]. Available at: http://www.looselycoupled.com/opinion/2006/davies-ui-dev0424.html. [Accessed on: 1 June 2008]. DIETERICH, H., KÜHME, T., MALINOWSKI, U. and SCHNEIDER-HUFSCHMIDT, M. (1993): State of the Art in Adaptive User Interfaces. In Adaptive User Interfaces. pp. 1148. Amsterdam, North-Holland. DILLON, A. and SONG, M. (1997): An Empirical Comparison of the Usability for Novice and Expert Searchers of a Textual and a Graphic Interface to an Art-resource Database. Journal of Digital Information. 1(1). DUBEY, A. and WAGLE, D. (2007): Delivering software as a service. The McKinsey Quarterly Business Journal(28 August 2008), May 2007, pp. 1-12. ECMA (2009): Standard ECMA-262 ECMAScript Language Specification [online]. Available at: http://www.ecma-international.org/publications/files/ECMA-ST/ECMA-262.pdf. [Accessed on: 05 April 2009]. EHLERT, P.A.M. (2003): Intelligent user interfaces: introduction and survey [online]. Research Report DKS03-01 / ICE 01. Delft University of Technology. Available at: http://www.kbs.twi.tudelft.nl/Publications/Report/2003-Ehlert-DKS03-01.html. [Accessed on: 24 January 2009]. ELLINGER, R.S. (2007): Service Oriented Architecture and the User Interface Services: The Challenge of Building User Interface Services. Technology Review Journal. 15(1),14 November 2008, pp. 43-61. ERL, T. (2005): Service-Oriented Architecture: Concepts, Technology, and Design. Upper Saddle River, NJ Prentice Hall PTR. ERL, T. (2008): SOA Principles of Service Design. Service-Oriented Computing. Upper Saddle River, NJ. Prentice Hall. ERL, T. (2009): SOA Methodology [online]. Available at: http://www.soamethodology.com/. [Accessed on: 05 June 2009].
177
References
ERRADI, A., ANAND, S. and KULKARNI, N. (2006): SOAF: An Architectural Framework for Service Definition and Realization. In Proceedings of the International Conference on Service Oriented Computing (SCC 2006). Los Alamitos. IEEE. EYEOS (2009): EyeOS [online]. Available at: http://Eyeos.org. [Accessed on: 13 March 2009]. FIELDING, R.T. (2000): Architectural Styles and the Design of Network-based Software Architectures. Ph.D thesis, University Of California. Irvine. FISCHER, G. (2001): User Modeling in Human-Computer Interaction. User Modeling and UserAdapted Interaction 11, pp. 65-86. FRANKEL, D.S. (2005): What happened to CORBA? [online]. Available at: http://www.bptrends.com/publicationfiles/05-05%20COL%20CORBA%20%20Frankel.pdf. [Accessed on: 30 October 2009]. GAJOS, K.Z. (2008): Automatically Generating Personalized User Interfaces. PhD thesis, Computer Science and Engineering, University of Washington. GALITZ, W.O. (2007): The Essential Guide to User Interface Design: An Introduction to GUI Design Principles and Techniques. 3rd ed., Hoboken, NJ. John Wiley & Sons. pp 640. GOLDBERG, J., STIMSON, M., LEWENSTEIN, M. and SCOTT, N. (2002): Eye Tracking in Web Search Tasks: Design Implications. In Proceedings of the symposium on ETRA: Eye tracking research and applications symposium. pp. 51-58. GOOGLE (2009a): Google Docs [online]. Available at: http://docs.google.com/. [Accessed on: 13 March 2009]. GOOGLE (2009b): Google Chrome [online]. Available at: http://www.google.com/chrome. [Accessed on: 11 June 2009]. GOOGLE (2009c): Google App Engine [online]. Available at: http://code.google.com/appengine/. [Accessed on: 13 March 2009]. GUDGIN, M., HADLEY, M., MENDELSOHN, N., MOREAU, J.J., NIELSEN, H.F., KARMARKAR, A. and LAFON, Y. (2007): SOAP Version 1.2 Part 2: Adjuncts (Second Edition) [online]. World Wide Web Consortium. Available at: http://www.w3.org/TR/2007/REC-soap12-part2-20070427/. [Accessed on: 12 September 2008]. HADDAD, C. (2005): Where‟s the ROI? [online]. Available at: http://www.ftponline.com/weblogicpro/2005_03/magazine/colums/soapbox. [Accessed on: 13 December 2009]. HANSEN, M.D. (2007): SOA Using Java Web Services. Upper Saddle River, NJ. Pearson Education, Inc. HAYES, B. (2008): Cloud computing. Commun. ACM. 51(7), pp. 9-11. HE, J. and YEN, I.-L. (2007): Adaptive User Interface Generation for Web Services. In Proceedings of the e-Business Engineering, 2007. ICEBE 2007. IEEE International Conference on. Washington, DC, USA. IEEE Computer Society. pp. 536-539. HE, J., YEN, I.L., TU, P., JING, D. and BASTANI, F. (2008): An Adaptive User Interface Generation Framework for Web Services. In Proceedings of the Congress on Services Part II, 2008. (SERVICES-2. IEEE). pp. 175-182. HEATHCOTE, P.M. (2003): Training. A-Level Information and Communication Technology, pp. 265. HENNING, M. (2008): The rise and fall of CORBA. Commun. ACM. 51(8), pp. 52-57. HOFSTEE, E. (2006): Constructing a Good Dissertation: A Practical Guide to Finishing a Masters, MBA or PhD on Schedule. Johannesburg, South Africa. EPE.
178
References
HOOK, K. (2000): Steps to take before intelligent user interfaces become real. Interacting with Computers. 12, pp. 409-426. HUBBERS, J.-W., LIGTHART, A. and TERLOUW, L. (2007): Ten Ways to Identify Services. SOA Magazine, December 10 2007. HURST, A., HUDSON, S.E. and MANKOFF, J. (2007): Dynamic detection of novice vs. skilled use without a task model. In Proceedings of the SIGCHI conference on Human factors in computing systems. San Jose, California, USA. ACM. pp. 271-280. IBM (2007a): Blue Cloud Project [online]. Available at: http://www03.ibm.com/press/us/en/pressrelease/22613.wss. [Accessed on: 12 July 2009]. IBM (2007b): IBM Rational Unified Process [online]. Available at: ftp://ftp.software.ibm.com/software/rational/web/datasheets/RUP_DS.pdf. [Accessed on: 05 June 2009]. JAMESON, A. (2003): Adaptive interfaces and agents. In The human-computer interaction handbook: fundamentals, evolving technologies and emerging applications. pp. 305330. Mahwah, NJ: Lawrence Erlbaum Associates Inc. JASON, B.A. (2008): An Adaptive User Interface Model for Contact Centres. Masters thesis, Department of Computer Science and Information Systems, Nelson Mandela Metropolitan University. Port Elizabeth. South Africa. JOHNSON, P., EKSTEDT, M., SILVA, E. and PLAZAOLA, L. (2004): Using Enterprise Architecture For CIO Decision-Making: On The Importance Of Theory In Proceedings of the Conference on Systems Engineering Research. University of Southern California, Los Angeles, California. April 15-16, 2004. JOHNSTON, S.K. (2005): Tooling platforms and RESTful ramblings [online]. Available at: https://www.ibm.com/developerworks/mydeveloperworks/blogs/johnston/entry/service_i dentification_top_down_or?lang=en. [Accessed on: 01 January 2009]. JOSUTTIS, N.M. (2007): SOA in Practice: The Art of Distributed System Design. Sebastopol, CA, USA. O'Reilly Media, Inc. JQUERY (2009): jQuery [online]. Available at: http://jquery.com/. [Accessed on: 11 December 2008]. KAN, S.H. (2002): Metrics and Models in Software Quality Engineering. Reading, Mass. Addison-Wesley Professional. KANNEGANTI, R. and CHODAVARAPU, R. (2008): SOA Security. Greenwich, CT. Manning Publications Co. KASSOFF, M., KATO, D. and MOHSIN, W. (2003): Creating GUIs for Web Services. IEEE Internet Computing. 7(5), pp. 66-73. KEEN, M., ACHARYA, A., BISHOP, S., HOPKINS, A., MILINSKI, S., NOTT, C., ROBINSON, R., ADAMS, R. and VERSCHUEREN, P. (2004): Patterns: Implementing an SOA using an ESB. IBM Redbook. KNIPPEL, R. (2005): Service Oriented Enterprise Architecture. Masters thesis, University of Copenhagen. Copenhagen. KOBSA, A. (2004): Adaptive Interfaces. In Encyclopedia of Human-Computer Interaction. BAINBRIDGE, W.S. (ed) Great Barrington, MA: Berkshire Publishing. KODALI, R.R. (2005): What is Service-Oriented Architecture? An Introduction to SOA [online]. Available at: http://www.javaworld.com/javaworld/jw-06-2005/jw-0613-soa.html. [Accessed on: 20 August 2008]. KOHLMANN, F. (2007): Service identification and design - A Hybrid approach in decomposed
179
References
financial value chains. In Proceedings of the 2nd International Workshop on Enterprise Modeling and Information Systems Architecture (EMISA ‟07). Koellen-Verlag, Bonn pp. 205-218. KOPECKÝ, J., VITVAR, T., BOURNEZ, C. and FARRELL, J. (2007): SAWSDL: Semantic Annotations for WSDL and XML Schema. IEEE Internet Computing. 11(6), December 2007, pp. 60-67. KROGSAETER, M. and THOMAS, C.G. (1994): Adaptivity: System-Initiated Individualization. In Adaptive User Support : Ergonomic Design of Manually and Automatically Adaptable Software. OPPERMANN, R. (ed) Hillsdale, New Jersey, USA Lawrence Erlbaum Associates Inc. KÜHME, T. (1993): A User-Centered Approach to Adaptive Interfaces. In Proceedings of the International Conference on Intelligent User Interfaces (IUI '93). Orlando, Florida, USA. ACM Press. pp. 243-245. January 4 - 7, 1993. KULES, B. (2000): User Modeling for Adaptive and Adaptable Software Systems [online]. Available at: http://www.otal.umd.edu/UUGuide/wmk/. [Accessed on: 13 March 2009]. LALIWALA, Z. (2007): Event-driven Service-oriented Architecture for Dynamic Composition of Web Services. PhD thesis, Information and Communication Technology, Dhirubhai Ambani Institute of Information and Communication Technology. Gandhinagar. India. LANGLEY, P. (1999): User modeling in adaptive interfaces. In Proceedings of the Seventh International Conference on User Modeling. Banff, Canada. Springer-Verlag New York, Inc. pp. 357-370. LAWLER, J.P. and HOWELL-BARBER, H. (2007): Service-Oriented Architecture: SOA Strategy, Methodology, and Technology. Boca Raton, FL, USA. Auerbach Publications. LEWIS, G.A. and WRAGE, L. (2006): Model Problems in Technologies for Interoperability: Web Services [online]. Technical Report CMU/SEI-2006-TN-021. Carnegie Mellon Software Engineering Institute Available at: http://www.sei.cmu.edu/reports/06tn021.pdf. [Accessed on: 28 October 2008]. LI, H. and WU, Z. (2009): Research on Distributed Architecture Based on SOA. In Proceedings of the International Conference on Communication Software and Networks. Los Alamitos, CA, USA. 0:IEEE Computer Society. pp. 670-674. LIZCANO, D., JIMÉNEZ, M., SORIANO, J., CANTERA, J.M., REYES, M., HIERRO, J.J., GARIJO, F. and TSOUROULAS, N. (2008): Leveraging the Upcoming Internet of Services through an Open User-Service Front-End Framework. In Proceedings of the 1st European Conference on Towards a Service-Based Internet. Madrid, Spain. 5377/2008:Springer Berlin / Heidelberg. pp. 147-158. LÓPEZ-JAQUERO, V., MONTERO, F., FERNÁNDEZ-CABALLERO, A. and LOZANO, M.D. (2004): Towards Adaptive User Interfaces Generation - One Step Closer To People. In Enterprise Information Systems V. pp. 226-232. Albacete, Spain: Springer Netherlands. MANDELBAUM, A. (2004): Call Centers: Research bibliography with abstracts [online]. Available at: http://ie.technion.ac.il/serveng. [Accessed on: 16 December 2009]. MARKS, E. (2004): The SOA Network Effect: Technical and Cultural Issues Drive Value [online]. Available at: http://www.computerworld.com/action/article.do?command=viewArticleTOC&specialRe portId=620&articleId=95258. [Accessed on: 24 February 2009]. MENGE, F. (2007): Enterprise Service Bus. In Proceedings of FREE AND OPEN SOURCE
180
References
SOFTWARE CONFERENCE 2007, Sankt Augustin, Germany. pp. 1-6. MICROSOFT (2006): Real World SOA [online]. Available at: http://download.microsoft.com/download/b/4/d/b4db580a-0361-4907-9a6e9d2866d8b581/Real%20World%20SOA.doc. [Accessed on: 28 August 2008]. MICROSOFT (2008): DCOM Technical Overview [online]. Available at: http://technet.microsoft.com/en-us/library/cc722927.aspx. [Accessed on: 28 August 2008]. MICROSOFT (2009a): Microsoft Office Excel [online]. Available at: http://office.microsoft.com/en-us/excel/default.aspx. [Accessed on: 11 December 2009]. MICROSOFT (2009b): Microsoft Support [online]. Available at: http://support.microsoft.com/ph/2855. [Accessed on: 13 December 2009]. MICROSOFT (2009c): Microsoft Visual Studio 8 [online]. Available at: http://msdn.microsoft.com/en-us/vstudio/default.aspx. [Accessed on: 11 December 2009]. MICROSOFT (2009d): Internet Explorer 8 [online]. Available at: http://www.microsoft.com/windows/Internet-explorer/default.aspx. [Accessed on: 11 June 2009]. MICROSOFT (2009e): The C# Language [online]. Available at: http://msdn.microsoft.com/enus/vcsharp/aa336809.aspx. [Accessed on: 11 December 2009]. MITTAL, K. (2006): Build your SOA, Part 3: The Service-Oriented Unified Process [online]. Available at: http://www.ibm.com/developerworks/webservices/library/ws-soamethod3/index.html. [Accessed on: 21 October 2008]. MOZILLA (2009): Firefox [online]. Available at: http://www.mozilla.com/enUS/firefox/firefox.html. [Accessed on: 11 June 2009]. MULIK, S. (2007): When to use REST and when to use SOAP [online]. Available at: http://shrikant-mulik.blogspot.com/2007/08/when-to-use-rest-and-when-to-usesoap.html. [Accessed on: 30 April 2009]. NESTLER, T. (2008): Towards a Mashup-driven End-User Programming of SOA-based Applications. In Proceedings of the 10th International Conference on Information Integration and Web-based Applications and Services. Linz, Austria. ACM. pp. 551-554. NESTLER, T., FELDMANN, M., PREUYNER, A. and SCHILL, A. (2009): Service Composition at the Presentation Layer using Web Service Annotations. In Proceedings of the ComposableWeb'09. San Sebastian, Spain. 1: DANIEL, F., CASTELEYN, S. and HOUBEN, G.-J. (eds). pp. 63-68. June 24-26, 2009. NESTLER, T., FELDMANN, M. and SCHILL, A. (2008): Design-Time Support To Create User Interfaces For Service Based Applications. In Proceedings of the IADIS International Conference WWW/Internet 2008. Freiburg, Germany. ISAÍAS, P., NUNES, M.B. and IFENTHALER, D. (eds). International Association for Development of the Information Society (IADIS). pp. 457-460. NEWCOMER, E. and LOMOW, G. (2005): Understanding SOA with Web Services. Addison Wesley. NIELSEN, J. (1993): What is usability? Usability Engineering. San Francisco. Morgan Kaufmann. pp 36-46. NIMBUS (2009): Nimbus is cloud computing for science [online]. Available at: http://www.nimbusproject.org/. [Accessed on: 20 April 2009]. NORMAN, R.J. (1998): CORBA and DCOM: Side by Side. Distributed Computing. 1(5), pp. 41-45.
181
References
OASIS (2006): Reference Model for Software Oriented Architectures [online]. Available at: http://www.oasis-open.org/committees/tc_home.php?wg_abbrev=soa-rm. [Accessed on: 15 March 2008]. OKA, M. and NAGATA, M. (1999): A Graphical User Interface Shifting from Novice to Expert. In Proceedings of the 8th International Conference on Human-Computer Interaction: Ergonomics and User Interfaces. Munich, Germany. 1: BULLINGER, H.-J. and ZIEGLER, J. (eds). Lawrence Erlbaum Associates Inc. pp. 341-345. August 22-26, 1999. OMG (2008): The Common Object Request Broker: Architecture and Specification [online]. Available at: http://www.omg.org/spec/CORBA/3.1/. [Accessed on: 05 November 2008]. OMG (2009): CORBA®, XML And XMI® Resource Page [online]. Available at: http://www.omg.org/technology/xml/. [Accessed on: 05 November 2008]. OPENGROUP (2003): TOGAF "Enterprise Edition" Version 8.1 [online]. Available at: http://www.opengroup.org/architecture/togaf8- doc/arch/. [Accessed on: 05 November 2008]. OPENNEBULA (2009): OpenNebula.org [online]. Available at: http://www.opennebula.org/. [Accessed on: 20 April 2009]. OPERA (2009): Opera [online]. Available at: http://www.opera.com/. [Accessed on: 11 June 2009]. OPPERMANN, R. (1994a): Adaptive user support: ergonomic design of manually and automatically adaptable software. Series on computers, cognition, and work. Hillsdale, NJ, USA. L. Erlbaum Associates Inc. OPPERMANN, R. (1994b): Adaptively supported adaptability. International Journal of HumanComputer Studies. 40(3), pp. 455-472. PADILLA, M. (2003): Strike a balance: Users' expertise on interface design [online]. Available at: http://www.ibm.com/developerworks/webservices/library/ws-soamethod3/index.html. [Accessed on: 15 November 2008]. PAPAZOGLOU, M., AIELLO, M. and GIORGINI, P. (2004): Service-Oriented Computing and Software Agents. In Extending Web Services Technologies. 13: pp. 29-52. Springer US. PAPAZOGLOU, M. and YANG, J. (2002): Design Methodology for Web Services and Business Processes. In Technologies for E-Services. Lecture Notes in Computer Science, 2444/2002: pp. 175-233 Springer Berlin / Heidelberg. PAPAZOGLOU, M.P. (2006): Web Services Technologies and Standards [online]. Available at: http://infolab.uvt.nl/pub/papazogloump-2006-97.pdf. [Accessed on: 08 August 2008]. PATERNÒ, F., SANTORO, C. and SPANO, L.D. (2008): Designing Usable Applications based on Web Services. In Proceedings of the Interplay between Usability Evaluation and Software Development (I-USED‟08). Pisa, Italy. ABRAHÃO, S., LAW, E.L.-C., STAGE, J., HORNBÆK, K. and JURISTO, N. (eds). pp. 67-73. September 25-26, 2008. PATIG, S. (2009): Cases of Software Service Design in Practice. In Software Service Engineering. 09021. LEYMANN, F., SHAN, T., HEUVEL, W.-J.V.D. and ZIMMERMANN, O. (eds). Dagstuhl, Germany: Schloss Dagstuhl - Leibniz-Zentrum fuer Informatik, Germany. PAYMANS, T.F., LINDENBERG, J. and NEERINCX, M. (2004): Usability Trade-offs For Adaptive User Interfaces: Ease of Use and Learnability. In Proceedings of the 9th International Conference on Intelligent User Interfaces. Funchal, Madeira, Portugal. ACM. pp. 301-303. PEREPLETCHIKOV, M., RYAN, C., FRAMPTON, K. and TARI, Z. (2007): Coupling Metrics
182
References
for Predicting Maintainability in Service-Oriented Designs. In Proceedings of the Australian Software Engineering Conference. Los Alamitos, CA, USA. 0:IEEE Computer Society. pp. 329-340. PREECE, J., ROGERS, Y. and SHARP, H. (2007): Interaction Design: Beyond HumanComputer Interaction. 2nd ed., New York, NY. John Wiley & Sons. pp530-540. PRESSMAN, R. (2004): Software Engineering: A Practitioner's Approach. 6 ed., New York, NY, USA. McGraw-Hill Science/Engineering/Math. PRETORIUS, M. (2005): The Added Value of Eye Tracking in the Usability Evaluation of a Network Management Tool. Masters thesis, Department of Computer Science and Information Systems, Nelson Mandela Metropolitan University. Port Elizabeth. South Africa. PRUMPER, J., FRESE, M., ZAPF, D. and BRODBECK, F.C. (1991): Errors in computerized office work: differences between novice and expert users. SIGCHI Bulletin. 23(2), pp. 63-66. QUYNH, P.T. and THANG, H.Q. (2009): Dynamic Coupling Metrics for Service--Oriented Software. International Journal of Computer Science and Engineering. 3(1), pp. 46-46. RAMOLLARI, E., DRANIDIS, D. and SIMONS, A. (2007): A Survey of Service Oriented Development Methodologies. In Proceedings of the Second European Young Researchers Workshop on Service Oriented Computing. Univeristy of Leicester. GORTON, S., SOLANKI, M. and REIFF-MARGANIEC, S. (eds). Univeristy of Leicester.11-12 June 2007. REICHENBACHER, T. (2003): Adaptive Methods for Mobile Cartography. In Proceedings of the 21st International Cartographic Conference. Durban, South Africa. pp. 1311-1323. RICH, E. (1998): User Modeling via Stereotypes. In Readings in intelligent user interfaces. San Francisco, CA, USA: Morgan Kaufmann Publishers Inc. pp. 329-342. ROSS, E. (2000): Intelligent User Interfaces: Survey and Research Directions. [online]. Research Report CSTR-00-004. Available at: http://www.cs.bris.ac.uk/Publications/Papers/1000447.pdf. [Accessed on: 24 February 2009]. SALESFORCE (2009): Salesforce.com [online]. Available at: http://www.salesforce.com/. [Accessed on: 13 August 2009]. SCHMETZER, R. and BLOOMBERG, J. (2004): Three Roads to the SOA Implementation Framework [online]. Available at: http://searchwebservices.techtarget.com/ originalContent /0,289142,sid_gci958544,00.htm. [Accessed on: 20 May 2009]. SCHOLTZ, J. (2000): Common industry format for usability test reports. In Proceedings of the Conference on Human Factors in Computing Systems. The Hague, The Netherlands. CHI '00: CHI '00 extended abstracts on Human factors in computing systems. ACM. pp. 301-301. SERVFACE (2008): Service engineering methodology (inital version) [online]. 216699. SAP. Available at: http://141.76.40.158/Servface/index.php?option=com_docman&task=doc_download&gi d=3&Itemid=61. [Accessed on: 05 August 2008]. SHEN, H.T. (2007): Service-Oriented Architecture [online]. INFS 3204/7204 University of Queensland, Australia. Available at: http://www.itee.uq.edu.au/~infs3204/Lecture_Notes/M1.pdf. [Accessed on: 5 October 2008].
183
References
SHNEIDERMAN, B. (2003): Promoting universal usability with multi-layer interface design. In Proceedings of the 2003 conference on Universal usability. Canada. ACM. pp. 1-8. SINGH, A. (2007): An Intelligent User Interface Model for Contact Centre Operations. Masters thesis, Computer Science and Information Systems, Nelson Mandela Metropolitan University. Port Elizabeth. South Africa. SOMMERVILLE, I. (2006): Software Engineering. 8 ed., Reading, MA, USA. Addison Wesley. pp 864. SONG, K. and LEE, K.-H. (2007): An Automated Generation of XForms Interfaces for Web Service. In Proceedings of the IEEE International Conference on Web Services 2007. pp. 856-863. 9-13 July 2007. SONG, K. and LEE, K.-H. (2008): Generating multimodal user interfaces for Web services. Interacting with Computers. 20(4-5), September 2008, pp. 480-490. SPILLNER, J., BRAUN, I. and SCHILL, A. (2007): Flexible human service interfaces. In Proceedings of the 9th International Conference on Enterprise Information Systems. Funchal, Madeira, Portugal. pp. 79-85. SPILLNER, J., FELDMANN, M., BRAUN, I., SPRINGER, T. and SCHILL, A. (2008): AdHoc Usage of Web Services with Dynvoker. In Proceedings of the 1st European Conference on Towards a Service-Based Internet, Madrid, Spain. pp. 208-219. SpringerVerlag. STATUS (2009): Status Project [online]. Available at: http://www.acis.ufl.edu/vws/. [Accessed on: 20 April 2009]. TAYLOR, R.N., MEDVIDOVIC, N. and DASHOFY, E.M. (2009): Software Architecture: Foundations, Theory, and Practice. Hoboken, NJ. Wiley, John & Sons, Incorporated. TERLOUW, J. (2009): An Assessment Method for Selecting an SOA Delivery Strategy Determining Influencing Factors and Their Value Weights. Masters thesis, Information and Computing Sciences, Utrecht University. Utrecht. TERLOUW, L. and MAARSE, K.E. (2009): A Service Specification Framework for Developing Component-Based Software: A Case Study at the Port of Rotterdam. In Advances in Enterprise Engineering III. 34: pp. 100-114. Springer Berlin / Heidelberg. TERRE BLANCHE, M. (2002a): Tutorial 3: Central tendency. In Numbers, Hypotheses & Conclusions. pp. 52-69. TREDOUX, C. and DURRHEIM, K. (eds). Lansdowne: UCT Press. TERRE BLANCHE, M. (2002b): Tutorial 4: Variability. In Numbers, Hypotheses & Conclusions. pp. 52-69. TREDOUX, C. and DURRHEIM, K. (eds). Lansdowne: UCT Press. TIBCO (2006): Rich Portals: The Ideal User Interface for SOA [online]. Available at: www.tibco.com/resources/mk/rich_portals.pdf. [Accessed on: 14 May 2008]. TILKOV, S. (2007): A Brief Introduction to REST [online]. Available at: http://www.infoq.com/articles/rest-introduction. [Accessed on: 25 February 2009]. TOBII (2009): TOBII EYE TRACKING TECHNOLOGY [online]. Available at: http://www.tobii.com/corporate/eye_tracking/our_technology.aspx. [Accessed on: 12 August 2009]. TOMLINSON, B., BAUMER, E., YAU, M.L., ALPINE, P.M., CANALES, L., CORREA, A., HORNICK, B. and SHARMA, A. (2007): Dreaming of Adaptive Interface Agents. In Proceedings of the Conference on Human Factors in Computing Systems. San Jose, CA, USA. ACM. pp. 2007-2012. April 22-27, 2006
184
References
TRENMAN, A. (2005): Using Open Source Software for SOA [online]. Available at: http://objectwebcon06.objectweb.org/xwiki/bin/download/Main/DetailedSession/ATrenaman-SOA.pdf. [Accessed on: 08 October 2009]. TSAI, W.-T., HUANG, Q., ELSTON, J. and CHEN, Y. (2008): Service-Oriented User Interface Modeling and Composition. In Proceedings of the 2008 IEEE International Conference on e-Business Engineering. IEEE Computer Society. pp. 21-28. TULLIS, T. and ALBERT, W. (2008): Measuring the User Experience: Collecting, Analyzing, and Presenting Usability Metrics. Interactive Technologies. Burlington, MA, USA. Morgan Kaufmann. TYLER, S.W., COOK, L.K., GARGAN JR., R.A. and SCHLOSSBERG, J.L. (1991): An Intelligent Interface Architecture for Adaptive Interaction. In Intelligent User Interfaces. TYLER, S.W. and SULLIVAN, J.W. (eds). New York, NY: ACM Press. pp. 85-108. VAN TONDER, B. (2008): Adaptive User Interfaces for Mobile Map-based Visualisation. Masters thesis, Computer Science and Information Systems, Nelson Mandela Metropolitan University. Port Elizabeth. South Africa. VAQUERO, L.M., RODERO-MERINO, L., CACERES, J. and LINDNER, M. (2009): A Break in the Clouds: Towards a Cloud Definition. SIGCOMM Comput. Commun. Rev. 39(1), pp. 50-55. VARIA, J. (2008): Cloud Architectures [online]. Available at: http://jineshvaria.s3.amazonaws.com/public/cloudarchitectures-varia.pdf. [Accessed on: 12 December 2009]. VENTER, D. (2009): Personal Communication. Senior lecturer and Statistical consultant at the Nelson Mandela Metropolitan University. Port Elizabeth. VERMAAK, R. (2008): Personal Communication. ICT Helpdesk Manager at the Nelson Mandela Metropolitan University. Port Elizabeth. South Africa. VINOSKI, S. (1997): CORBA: integrating diverse applications within distributed heterogeneous environments. Communications Magazine, IEEE. 35(2), pp. 46-55. VOUK, M.A. (2008): Cloud computing — Issues, research and implementations. Journal of Computing and Information Technology - CIT. 16(4), June, 2008, pp. 235-246. W3C (2006): Web Services Description Language (WSDL) Version 2.0 Part 1: Core Language (W3C Candidate Recommendation 27 March 2006). [online]. World Wide Web Consortium Available at: http://www.w3.org/TR/wsdl20/. [Accessed on: 15 March 2009]. W3C (2007): SOAP Version 1.2 [online]. Available at: http://www.w3.org/TR/soap/. [Accessed on: 10 March 2009]. W3C (2009a): Web Style Sheets [online]. Available at: http://www.w3.org/Style/. [Accessed on: 11 March 2009]. W3C (2009b): Document Object Model (DOM) [online]. Available at: http://www.w3.org/DOM/. [Accessed on: 05 May 2009]. W3C (2009c): XMLHttpRequest [online]. Available at: http://www.w3.org/TR/2009/WDXMLHttpRequest-20091119/. [Accessed on: 15 March 2009]. W3C (2009d): WSDL [online]. Available at: http://www.w3.org/TR/wsdl. [Accessed on: 15 August 2009]. W3C (2009e): XSLT [online]. Available at: http://www.w3.org/TR/xslt. [Accessed on: 15 April 2009]. W3SCHOOLS (2009): Web Browser Statistics [online]. Available at:
185
References
http://www.w3schools.com/browsers/browsers_stats.asp. [Accessed on: 11 June 2009]. WANG, L., TAO, J., KUNZE, M., CASTELLANOS, A.C., KRAMER, D. and KARL, W. (2008): Scientific Cloud Computing: Early Definition and Experience. In Proceedings of the 2008 10th IEEE International Conference on High Performance Computing and Communications. IEEE Computer Society. pp. 825-830. WEILL, P. (2007): Innovating with Information Systems: What do the most agile firms in the world do? [online]. Barcelona, Spain. Available at: http://www.iese.edu/en/files/6_29338.pdf. [Accessed on: 12 December 2009]. WEISS, A. (2007): Computing in the clouds. NetWorker. 11(4), pp. 16-25. WILKES, L. (2004): The Essential Guide to Service Orientation. CBDI Journal, May 2004, pp. 10-16. WINTER, R. and FISCHER, R. (2006): Essential Layers, Artefacts, and Dependencies of Enterprise Architecture. In Proceedings of the 10th IEEE on International Enterprise Distributed Object Computing Conference Workshops, Washington, DC, USA. pp. 3042. IEEE Computer Society. WU, J. (2000): Accommodating both Experts and Novices in One Interface [online]. Available at: http://www.otal.umd.edu/UUGuide/jingwu/. [Accessed on: 13 March 2009]. YAHOO (2009): Yahoo Pipes [online]. Available at: http://pipes.yahoo.com/. [Accessed on: 18 December 2009]. ZHANG, Z., LIU, R. and YANG, H. (2005): Service Identification and Packaging in Service Oriented Reengineering. In Proceedings of the 17th International Conference on Software Engineering and Knowledge Engineering. Taipei, Taiwan. IEEE Computer Society Press, Los Alamitos (CA). pp. 219–26. July 14-16 2005. ZIMMERMANN, O., KROGDAHL, P. and GEE, C. (2004): Elements of Service-Oriented Analysis and Design [online]. Available at: http://www.ibm.com/developerworks/webservices/library/ws-soad1. [Accessed on: 20 May 2009]. ZUKERMAN, I. and ALBRECHT, D.W. (2001): Predictive Statistical Models for User Modeling. User Modeling and User-Adapted Interaction. 11(1-2), pp. 5-18.
186
Pilot Study Appendices
Pilot Study Appendices Appendix A: Pilot Study 2 - Test Plan
Log into the system with following credentials Username: JP Password: jacksparrow
Task 1 Step 1:
A customer calls in, gives username as bgallant (Press enter after entering username)
Step 2:
The user is having what they think is a general problem with their Network Drive, but it might be a problem with the modem. This is a top priority as the user is a Lecturer that needs to communicate with an out of town team via email. Consequences may be severe if not repaired. 1 = Highest Priority / Severity 3 = Lowest Priority / Severity
Step 3:
RobinD (from South Campus) is the network expert at the call centre, so assign the call to him.
Step 4:
You ask if they user rebooted the modem, they say no, so you ask them to reboot it. They reboot the system and it works.
Task 2 Step 1:
A customer calls in, gives username as bhseale (Press enter after entering username)
Step 2:
user is having what they think is a hardware problem with their Monitor. This is not urgent, therefore is a low priority case. 1 = Highest Priority / Severity 3 = Lowest Priority / Severity
Step 3:
You decide to ask basic questions to establish if this is not an easy case therefore you ask if the monitor is plugged into the PC. They say NO. You ask them to plug it in, and it works.
Step 4:
Write the solution to this problem and log the call.
187
Pilot Study Appendices
Appendix B: Pilot Study 2 - Questionnaire Section A: Computer experience
Department of Computing Sciences Nelson Mandela Metropolitan University Tel: 041 504 2094, Cell: 078 222 2116 e-mail:
[email protected]
Pilot Study Questionnaire 1
Gender
2
Age
3
Occupation
MALE
FEMALE
15-20
21-25
26-30
31-25