Proceedings of the 12th International Conference on Environmental Science and Technology Rhodes, Greece, 8 – 10 September 2011
A SIMPLE MATHEMATICAL MODEL FOR REAL-TIME PREDICTION OF HARMFUL ALGAL BLOOMS IN GREECE M.A. PETOUSSI1, K. KOUKARAS2 and N. KALOGERAKIS*1 1
Department of Environmental Engineering, Technical University of Crete, Chania 73100 2 NEARCHUS GP,69 Anaximandrou str, Thessaloniki 54250 * e-mail:
[email protected]
EXTENDED ABSTRACT A rapid increase in the algae population of an aquatic system is referred to as “algal bloom” and is a natural phenomenon which can have significant adverse effects on seawater aquaculture and shellfish cultivation. In this work the effect of external forcings and nutrients loadings on algae population of an aquatic system is considered. A simple mechanistic model has been developed for this purpose, which pertains the seawater body a telemetric station, where on line data regarding water physicochemical parameters and algae abundance through in situ flow cytometry will be available. The objective is to have short-term, accurate predictions about the concentration of substances and species in the water column with the primary objective to alert nearby stakeholders of potential algal blooms.. Keywords: harmful algal bloom, real time prediction, phytoplankton growth modelling, Greek coastal waters.
1.
INTRODUCTION
Algae are microscopic, single-celled plants that live in the sea and serve as energy producers at the base of the food web. A relatively rapid increase in the algae population of an aquatic system is referred to as “algal bloom” and is a natural phenomenon. Yet there is a small number of algae species which are characterized as “harmful” and their respective bloom phenomena are characterized consequently as “Harmful Algal Blooms” (HABs). Once these species grow very fast or “bloom”, they usually accumulate into dense, visible patches near the surface of the water, causing water discoloring and creating anoxic conditions, or produce potent neurotoxins that can be transferred through the food web where they affect and even kill higher forms of life such as zooplankton, shellfish, fish, birds, marine mammals, and even humans that feed either directly or indirectly on them. HABs have, therefore, adverse effects on human health, fishery and the environment. In recent years, considerable scientific attention has been given to HABs, because of their global increase in frequency and intensity. Many significant mathematical models have been developed in order to simulate HABs dynamics and to forecast possible toxic events. The most advanced of these models, with successful applications in the Southern North Sea, Hong Kong and South China, have great ecological importance and are implemented in large water areas, requiring great computational resources and sampling frequency. Greece has a great economic profit from shellfish cultivation and therefore it is very important for the shellfish growing areas to be protected from HABs by an early warning
A-1493
system. The HAB’s management strategy implemented by Greece is routine monitoring for toxins in shellfish, as currently is conducted in more than 50 countries [2]. Navigable telemetric stations have already been used for the recording of parameters such as pH, temperature, oxygen, salinity, chlorophyll, nutrients etc., in order to monitor the water quality of coastal ecosystems. Nevertheless, none of the stations provide any information regarding harmful algae population. In spite of this management strategy, the frequent occurrence of harmful algal blooms in Greek seas, during the last decades, has led to a great total economic loss of the annual shellfish production. This case makes questionable the reliability of the existing HABs monitoring programs as far as their HABs frequency and intensity prediction ability is concerned. Indeed, until now, monitoring programs for the surveillance of harmful algae have important limitations, especially given that they are time consuming and of high cost, as they record the overall situation with time delay and at the same time they are not able to forecast toxic events in time. The reason for the unreliable monitoring is the lack of an appropriate predictive tool as well as the low sampling frequency. Harmful algae species isolated in Greek coastal waters belong mainly to the Dinophysis and Prorocentrum gender, which are responsible for Diarrhetic Shellfish Poisons (DSP) found in shellfish. The former (Dinophysis cf. acuminata) is being isolated every year since 2000 for a period of 2–6 months in Thermaikos gulf. Chattonella, as well, was reported as the main cause of mass fish death in the aquaculture of Larissa (August of 2007) and Maliakos Gulf (March – April 2009). Other important species isolated from the Greek seas belong to the gender Pseudo-niztchia and are responsible for the presence of Amnesic Shellfish Poisons (ASP). Also, species of Alexandrium and Karenia, which produce Paralytic Shellfish Poisons (PSP), have already been tracked in the Greek coastline. Early detecting of harmful algal blooms near the shellfish cultivation areas could be proved to be a good management practice for the Greece, and in this direction it is planned for an automated recording system for the detection and enumeration of harmful algae in real time to be installed at several points of interest in Thermaikos gulf. The system will be able to measure algae cells concentration (toxic and non toxic) through in situ flow cytometry besides other physicochemical parameters, and to give complete, valid and reliable on line data. In the present work, we have developed a simple mathematical model for algae growth dynamics, which is implemented for short-term HABs prediction in real time in the surrounding area of a telemetric station. This model, because of its limited spatial applicability and the availability of real time measurements, could provide proper, accurate and reliable HAB’s prediction despite its low computational resources demand. 2.
MODEL DESCRIPTION
The majority of HAB’s advanced models developed so far is used for long term predictions of the algae population distribution in three dimensions for large water areas and serve as a tool for advanced HABs control strategies. A coupled hydrodynamics model of the simulated area is needed for the implementation of those models and their computational resources trade-off is straightforward. For a comprehensive review of these models see the review by Radach and Moll [5]. The developed model is dedicated for implementation at the surrounding area of a telemetric station. Therefore, assuming that the implementation area is relatively small, it is implied that the model state variables have no high spatial gradients. Thus, we let the
A-1494
simulated seawater area to be a unicellular grid, i.e. a control volume. Therefore, the model is zero-dimensional. This assumption could be safely made, because of the telemetric station measurements availability. Additionally, in order for the model to serve as an early warning system, it can provide predictions on a real time basis. The model incorporates the basic biological and physicochemical processes, which take place in the water column. State variables of the model are separated algae species, dissolved nutrients (C, N, P and Si), oxygen and nutrients in particulate organic form. The phytoplankton processes which are taken into account are algae growth, mortality, photosynthesis and autolysis, whereas physicochemical processes include particulate organic matter mineralization, settling of particular organic matter (POM) and plankton, nitrification and denitrification. Besides, the model takes also into account grazing forcing, but does not include grazers concentration as a state variable. The grazer processes module has been taken from GEM model [2]. Four different common algae species are modeled as separated variables e.g. diatoms, flagellates, dinoflagellates and Phaeocyctis. Algae growth rate is modeled as a Monod type function of nutrients (N, P, Si) and oxygen. It is assumed that algae species included in the model are mostly autotrophic and therefore a sinusoidal coefficient is added to the growth rate function in order to limit the algae growth rate at time periods of the day with low light intensity. Mortality of algae depends on temperature and algae concentration. Dead algae cells are found either as particulate organic matter in the water column, or are mineralized to dissolved nutrients via autolysis. Algae are removed from the system by settling and grazing. Settling rate is proportional to algae concentration. Different approaches to phytoplankton processes take into account competition between species [4] and individual algal cells adaptation to the water conditions by conversion into another phenotype of the same species group [2]. These approaches serve for the algae population distribution determination for a long time horizon. In [2], computation of algae growth is realized via linear programming, which is time consuming. In contrast, our model does not include different algae species phenotypes as long as we asuume that nitrogen and phosphorus are abundant due to external loadings and therefore the nutritional environment does not change dramatically. Dead particulate matter, i.e., particulate organic carbon, nitrogen, phosphorus and silicate is modeled as four separate state variables, in order to model their different behavior as far as their settling and decomposition specific rates are concerned. POM is assumed to be produced by algae mortality with a rate proportional to the last, and to be excreted by grazers. Removal of POM is conducted via decomposition, settling and grazing. The decomposition rate of dead particulate organic matter is dependent on the nutrient stoichiometry of detritus, since bacteria need a supply of nutrients that is proportional to the supply of organic carbon. The decomposition rate of POM is highest for POM with a high nutrient content (expressed as N/C and P/C ratios). Therefore, if the nutrient content is above a threshold value, a high decomposition rate is applied in the model. If the nutrient content is below another threshold, a low decomposition rate is applied. If the nutrient content is in between the two thresholds, the decomposition rate is linearly interpolated. The nutrient content of the most limiting nutrient (N or P) determines the overall decomposition rate for POC, PON, and POP. This approach was first applied in the freshwater model DBS as described in [6]. Sediment processes are not included in this model. This simplification is safe for the coastal areas considered (not very shallow), where processes such as back release of nutrients in the water column, burial etc. must be included.
A-1495
Dissolved nutrients (NH4, NO3, P, Si) are released back into the water column by mineralization of POM, respiration of grazers, and from dead algae autolysis, whereas they are removed from the system by algae uptake. As far as nitrogen forms are concerned, nitrification and denitrification rates are included also in the respective mass balances. Nitrification and denitrification are modeled as simple first order processes, corrected for temperature and oxygen concentration. Nitrification rate decreases when the oxygen concentration in the water drops below a critical level. Oxygen is imported to the system by reaeration and as a product of photosynthetic activity, whereas it is consumed by POM decomposition and nitrification. Reaeration is a function of wind velocity and the difference between the actual oxygen concentration in the water and the saturation concentration. The saturation concentration of oxygen is a function of temperature and salinity of the water. Settling for all entities is modelled as a net settling process with a settling velocity that is constant in time, and independent from turbulence and bottom shear stress. For each phytoplankton species, a separate settling velocity is specified. For POM, a unique velocity is specified that is applied for all nutrient fractions (POC,PON, POP and POSi). Grazer processes module has been taken from [2]. Grazer biomass is imposed in the model as a forcing function. The imposed biomass of primary consumers is adjusted by the model if availability of food (algae and detritus) is insufficient to support the imposed filter-feeder biomass according to the specified filtering rates and metabolic coefficients. At high densities of phytoplankton and detritus, the uptake of food is determined by the uptake rate. At low densities of phytoplankton and detritus, the uptake of food is determined by the filtration rate. Part of the uptake is egested as detritus. The egestion rate is a constant fraction of the uptake rate per type of food. The egestion fraction may be different for each phytoplantkon of detritus type. The part of the uptake of the nonlimiting nutrients that cannot be assimilated is excreted as detritus. Part of the food uptake is lost due to growth respiration. The remaining part is available for biomass increase and is given by the forcing function, but is constrained by maximum growth, maximum mortality and food availability. The food that is not used for biomass increase and organic matter associated with biomass decrease is all released as detritus. Uptake, filtration, growth, maintenance respiration, growth respiration and mortality are all affected by temperature. A summary set-up of our model is given below where an exchange rate Fex with the surrounding water body is assumed. Extensive explanation of all included parameters could not be provided due to lack of writing space. Model mass balance equations
dNO3 Nitrate (gNm-3) nit den upt N *(1 f am ) + Fex *( NO3, sur NO3 ) dt dNH4 Ammonium (gNm-3) decPON nit rspN ,G faut * morN uptN * fam +Fex *( NH4,sur NH 4) dt dPO4 decPOP rspP ,G f aut * morP upt P Fex *( PO4, sur PO4 ) Ortho-phosphate (gPm-3) dt dSi Dissolved Silicate (gSim-3) decPOSi f aut * morSi uptSi Fex *( Sisur Si ) dt dALGi Algae (gCm-3) groi mrti sedi grzi Fex *( ALGi , sur ALGi ) dt
A-1496
dO2 Dissolved oxygen (gO2m-3) rea ( groC decPOC ) * sO nit * sNO Fex *(O2, sur O2 ) dt dPOX morX *(1 faut )sedPOX decPOX grzPOX excPOX Fex *(POXsur POX) Particulate Organic Matter (gXm-3) dt Processes rate and specific rate equations n
upt X ( groi * s X ,i ) ,
Uptake of nutrients by phytoplankton growth (gXm-3d-1)
i 1
n
morX (mrti * s X ,i ) ,
Formation of dead organic matter by phytoplankton mortality (gXm-3d-1)
i 1
groi pi *(O2 / O2 K Si O ) *( NO3 / NO3 K Si NO ) *( PO4 / PO4 K Si PO ) *( Si / Si K Si Si ) *sin(t ) 2
3
4
Net phytoplankton growth (gCm-3d-1)
MIN ( NH 4 , upt N * t ) upt N * t mrti mi * ALGi , pi pi ,0 *(T kt p ,i ) f am
Fraction of ammonium in nitrogen uptake (-) Phytoplankton mortality (gCm-3d-1) Maximal net growth rate for algae type i (d-1)
ri ri ,0 *(ktr ,i )T ,
Maintenance respiration rate for algae type i (d-1)
mi mi ,0 *(ktm ,i )T ,
Mortality rate for algae type i (d-1)
decPOX ( fT,dec *kdecL,POX (kdecH,POX kdecL,POX )* fnut )*POX
,Decomposition of Particulate Organic matter (gXm-3d-1)
decPOSi ( fT ,dec * kdecL , POSi (kdecH , POSi kdecL , POSi ) *
( POSi / POC ) slSi ) * POSi ) suSi slSi
fT , pr kt (prT 20) , pr=dec, den, nit ,
Temperature function for processes (-)
( PON / POC ) slN ( POP / POC ) slP , ), su N slN suP slP nit k nit *NH 4 * fT , nit , f nut MIN (
den kden * NO3 * fT ,den , rea (0.3 0.028*W 2 ) * sedY
Y *Y
Relative nutrient availability (-) Nitrification (gNm-3d-1) Denitrification (gNm-3d-1)
(O2,eq O2 ) Z
Reaeration (gO2m-3d-1)
* krea ,
Settling (gXm-3d-1)
, Y=ALGI , POX ,
Z grzi up * ALGi , Grazing algae by filterfeeders (gCm-3d-1) grz POX up * POX , Grazing organic matter by filterfeeders (gXm-3d-1) rsp X ,G (ass 2* rgG ,20 Gi * rmG ,20 ) * fT , grz * s X ,G , Respiration by filterfeeders(gXm-3d-1) excPOX excX *(1 f sed ) ,
Excretion of organic matter by filterfeeders (gXm-3d-1)
X= element carbon, nitrogen, phosphorus and silicate i=algae type 1-4 (diatoms, flagellates, dinoflagellates and Phaeocystis) POX= particulate organic matter (POC,PON,POP, POSi) N= number of algae species
A-1497
3.
COMPUTATIONS
Algae population growth has been simulated over periods of different nutrient availability, temperature and wind velocity. The water area containing the simulated algae population is assumed to exchange a proportion of its mass with the adjacent water area. The prevailing conditions are assumed to be sequentially changing to the following different nutritional environments: A) maximum nitrate and minimum ortho-phosphate and silicate concentration B) maximum ortho-phosphate and minimum nitrate and silicate concentration C) moderate concentration of all nutrients and D) maximum concentration of all nutrients. Typical nutrients concentration values range is in agreement with previous field data at Thermaikos gulf [3]. Model simulations have been made for four different cases of wind velocity- temperature values. Initial algae population has been assumed to be at the lowest level according to field studies [3]. The model computes the population dynamics for each algae type although the total algae population is presented in the figures. 4.
RESULTS
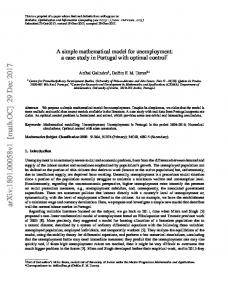
The simulation results are shown in Figures 1 to 4 which illustrate the total algae population growth at different nutrient availability, water temperature and wind velocity. A double arrow determines the time interval over which the modeled seawater area is subject to one of the above mentioned environmental conditions (A, B, C, D). It should be noted that at every temperature and wind velocity, an algal bloom is possible to occur, indicating that the nutrient availability is the key factor for algae growth. It appears that nitrate is the most limiting nutrient for algae growth, since under environmental conditions A (only nitrate abundant and very limited concentrations of other nutrients), algae bloom has approximately the same intensity with the respective bloom intensity under conditions of high nutrient concentrations (D). Under conditions where all nutrients are present (C) in moderate concentrations, only a slight increase in the algae growth rate is observed, whereas under conditions with only high orthophosphate concentration no remarkable algae growth has been noted.\ Total Algae Cells Concentration at W= 1m/s and T= 10 C
8
A lg a e C e lls C o n c e n tra t io n (c e lls / m 3 )
A lg a e C e lls C o n c e n t ra tio n (c e lls /m 3 )
Total Algae Cells Concentration at W= 15m/s and T= 25 C
8
10
10
7
10
6
10
7
10
6
10
C
A B A
B
5
10
0
200
400
600
C
800 1000 Time (days)
D 1200
D
5
1400
1600
Figure1. Algae dynamics at 10oC and wind velocity 1 m/s
10
0
200
400
600
800 1000 Time (days)
1200
1400
1600
Figure 2. Algae dynamics at 25oC and wind velocity 15 m/s
A-1498
Total Algae Cells Concentration at W= 15m/s and T= 10 C
8
10
A lg a e C e lls C o n c e n tra t io n (c e lls / m 3 )
A lg a e C e lls C o n c e n tra t io n (c e lls / m 3 )
Total Algae Cells Concentration at W= 1m/s and T= 25 C
8
10
7
10
6
10
7
10
6
10
B A
B
5
10
D
A
D
C
C
5
0
200
400
600
800 1000 Time (days)
1200
1400
1600
Figure 3. Algae dynamics at 10oC and wind velocity 15 m/s
10
0
200
400
600
800 1000 Time (days)
1200
1400
1600
Figure 4. Algae dynamics at 25oC and wind velocity 1 m/s
Steady state concentration of algae population appears to be greater for the case of T=10 C (see Figs 1 & 3) compared to the case of T=25 C, due to increased dissolved oxygen concentration in the water, which reinforces the particulate organic matter decomposition rate of and makes available for algae uptake all nutrients, by releasing them back into the water column. Simulations for the same wind velocity show that at higher temperature lower intensity of the respective blooms is reached. This is also due to lower dissolved oxygen concentration at higher temperatures, which reversely reduces POM decomposition rate and subsequently makes the nutrients more slowly available into the water column. In all cases, steady state algae bloom occurs only during the nitrate abundant environment (A) and it appears later accompanied by oscillations, compared to the high nutrients abundance environment bloom steady state, which is reached much more quickly. This is due to other nutrients restricted availability which influence different algae growth rate at a different grade. This results to simultaneous growth and disappearance of different species and consequently implies oscillatory behavior, delaying the bloom development. This fact implies that an algae would have the opportunity to bloom in an environment of only nitrate abundance after the maintenance of the nutritional status of the region for a long period. On the other hand, algal bloom in an area with high nutrients would occur in much less time. For the same temperature, oscillations in the algae growth are smoothed out at greater wind velocities due to higher dissolved oxygen and subsequent greater decomposition rate of POM. 5.
CONCLUSIONS
Our model simulates the algae population growth of a sea water volume which exchanges nutrients as it moves, predicting the occurrence of a possible algal bloom under different nutrients availability environments. The temperature and wind velocity parameters are shown to be important as far as the intensity and algae growth rate are concerned, as they affect indirectly nutrient availability in the water. Nevertheless, the occurrence although of an algal bloom is much more dependent to the nutrients abundance in the water. The model parameters will be fine-tuned with field data as they become available.
A-1499
ACKNOWLEDGEMENTS This project has been supported by GSRT – SYNERGASIA program – project 607. REFERENCES 1. Anderson D.M. (2009), Approaches to monitoring, control and management of harmful algal blooms (HABs) , Ocean & coastal management, 52, Issue: 7, Special Issue: Sp. Iss. SI , 342347 2. Blauw A.N., Los H.F.J, Bokhorst M. et al., (2009), GEM: a generic ecological model for estuaries and coastal waters, Hydrobiologia , 618 , 175-198 3. Koukaras, K. (2004) „Temporal and spatial distribution of Dinophysis Ehrenberg harmful blooms in Thermaikos gulf“, PhD Thesis, Faculty of Sciences, Aristotle University of Thessaloniki, Thessaloniki 4. Pal S., Samrat Chatterjee, Krishna pada Das, Chattopadhyay J. (2009), Role of competition in phytoplankton population fort he occurence and control of plankton bloom in the presence of environmental fluctuations, Ecological modelling, 220, 96-110. 5. Radach G., Moll A. (2006), Review of three-dimensional ecological modelling related to the North Sea shelf system. Part II: Model validation and data needs , Oceanography and marine biology- an annual review, 44 ,1-60. 6. Van der Molen, D.T., Los F.J. & Van der Tol M. (1994), Mathematical modelling as a tool for management in eutrophication control of shallow lakes, Hydrobiologia, 275/276, 479-492.
A-1500