A Simple Model System Enabling Human CD34+ Cells to Undertake Differentiation Towards T Cells Antonio Lapenna1,2*, Christopher B-Lynch1, Chrysa Kapeni1, Richard Aspinall1 1 Regenerative Medicine Group, Cranfield Health, Cranfield University, Cranfield, United Kingdom, 2 Department of Immunology and Cancer Research, Faculty of Medicine, the Hebrew University of Jerusalem, Jerusalem, Israel
Abstract Background: Channelling the development of haematopoietic progenitor cells into T lymphocytes is dependent upon a series of extrinsic prompts whose temporal and spatial sequence is critical for a productive outcome. Simple models of human progenitor cells development depend in the main on the use of xenogeneic systems which may provide some limitations to development. Methods and Findings: Here we provide evidence that a simple model system which utilises both human keratinocyte and fibroblast cell lines arrayed on a synthetic tantalum coated matrix provides a permissive environment for the development of human CD34⁺ haematopoietic cells into mature CD4⁺ or CD8⁺ T lymphocytes in the presence of Interleukin 7 (IL-7), Interleukin 15 (IL-15) and the Fms-like tyrosine kinase 3 ligand (Flt-3L). This system was used to compare the ability of CD34+ cells to produce mature thymocytes and showed that whilst these cells derived from cord blood were able to productively differentiate into thymocytes the system was not permissive for the development of CD34+ cells from adult peripheral blood. Conclusions/Significance: Our study provides direct evidence for the capacity of human cord blood CD34+ cells to differentiate along the T lineage in a simple human model system. Productive commitment of the CD34⁺ cells to generate T cells was found to be dependent on a three-dimensional matrix which induced the up-regulation of the Notch delta-like ligand 4 (Dll-4) by epithelial cells. Citation: Lapenna A, B-Lynch C, Kapeni C, Aspinall R (2013) A Simple Model System Enabling Human CD34+ Cells to Undertake Differentiation Towards T Cells. PLoS ONE 8(7): e69572. doi:10.1371/journal.pone.0069572 Editor: Zoran Ivanovic, French Blood Institute, France Received April 05, 2013; Accepted June 14, 2013; Published July 23, 2013 Copyright: © 2013 Lapenna et al. This is an open-access article distributed under the terms of the Creative Commons Attribution License, which permits unrestricted use, distribution, and reproduction in any medium, provided the original author and source are credited. Funding: This research was funded in part by Myrtle Peach Trust UK (Registered Charity No. 1048297): http://www.mkheritage.co.uk/shhs/mpeach.htm and from Cranfield University. The funders had no role in study design, data collection and analysis, decision to publish, or preparation of the manuscript. Competing interests: The authors have declared that no competing interests exist. * E-mail:
[email protected]
Introduction
(FTOC) systems or allogeneic cell lines such as mouse bone marrow-derived OP9 cells expressing the Notch delta-like ligand 1 (OP9-Dll1) [3–5]. But the experiments in human systems have proved more intractable. Analysis of the capacity of haematopoietic progenitor cell populations to produce T cells have proceeded but has been hampered, mainly through the use of xenogeneic model systems which by their very nature are limited and associated with incomplete or inefficient differentiation of the progenitors [5]. Some studies of thymic stromal cells have indicated changes with age in the thymic environment cell type composition and expression profile but these data were limited by the lack of culture methods which could effectively model the thymic architecture in vitro [6]. With this in mind we developed a synthetic biology approach to the problem combining the use of freely available cell lines, engineered materials and suitable biochemical factors to induce human thymopoesis in vitro. Our aim was to induce differentiation along the T cell lineage using a simple model
The generation of T cells from haematopoietic progenitor cells requires the positioning of progenitors within the thymus where a unique environment induces supports and directs their differentiation [1]. Production of new thymocytes continues throughout life and because the progenitors cannot be stored and maintained indefinitely within the thymus, continuation of production requires seeding of the thymus with these cells. Analysis of thymic output reveal that the rate of production of new T cells declines with age [2] and that as thymocyte production decreases so there is atrophy of the thymus. In broad terms thymic atrophy has been linked to deficits in the progenitors seeding the thymus or to lesions in the environment provided by the thymic stromal cells. Studies utilising mouse systems have revealed that neither of these are mutually exclusive with experiments on both aspects aided by the use of surgical techniques, fetal thymic organ culture
PLOS ONE | www.plosone.org
1
July 2013 | Volume 8 | Issue 7 | e69572
Human T Lineage Development In Vitro
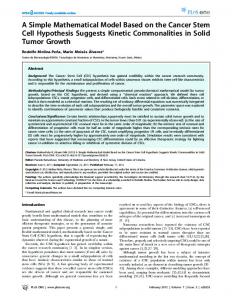
Figure 1. Expansion and differentiation of CD34+ cells. . (A) Correlation between the initial number of CD34+ cells seeded and the amount of mature cells generated at day 14th. The results are the average ± standard derivation of three different experiments. (B) Progressive decline with time of CD34 expression among cord blood cellscultured in the matrix. The results are the average of three different experiments ± standard derivation. The differences between the 3rd, 5th and 14th day and the seeded population are all significant (*p< 0.001; **p< 0.001; ***p< 0.001). doi: 10.1371/journal.pone.0069572.g001
blood derived CD34+ cells. Moreover we analysed the biological characteristics of the artificial construct and this enabled us to hypothesize why providing a three-dimensional cellular architecture is essential to recreate the unique functions and characteristics of the thymic environment in vitro.
system containing only cells of human origin. To reach this aim we took inspiration from a recent study which showed how a human thymic microenvironment could be engineered using skin derived fibroblast and epithelial cells. Within this environment bone marrow derived CD133⁺ haematopoietic progenitor cells could be triggered to differentiate into T lymphocytes [7]. Unfortunately this work had problems. Derivation of cells from the skin lead to the possible contamination of the T cells derived from the bone marrow stem cells with those transported into the system through their sequestration within the stromal cells from human biopsies so that skin resident T lymphocytes amplification may have occurred [8]. A second problem arose when others found these results difficult to replicate [9]. To overcome these problems we constructed a threedimensional thymus by attaching human keratinocytes and fibroblasts from cell lines to a tantalum coated matrix and then we seeded these cultures with CD34+ cells derived either form cord blood or from adult blood. Interestingly, differentiation of these cells along the T cell lineage occurred only with cord
PLOS ONE | www.plosone.org
Materials and Methods Ethics statement Cord blood samples were collected from consenting mothers following birth and adult blood by venepuncture from a 55 years old adult donor following ethical permission by The Royal Marsden Local research Ethics Committee. The participants provided written informed consent.
CD34+ cell separation Mononuclear cells were separated from whole blood by gradient centrifugation using Ficoll-Paque (GE Heatlhcare) and subsequently depleted of CD2 and CD20 cells and enriched for CD34 using Microbeads (Miltenyi) according to MACS method
2
July 2013 | Volume 8 | Issue 7 | e69572
Human T Lineage Development In Vitro
Figure 2. Kinetics of thymocytes generation. . (A) By day 5 CD4 dimintermediate single positive and some double positive CD4+CD8+ cells were present. These progenitors all expressed CD45, either high or dim and analysis of cultures also showed the presence of CD1a+CD7+ and CD1a+CD7 cells The images are representative of three different experiments. doi: 10.1371/journal.pone.0069572.g002
fibroblasts were used at less than 15 passages. Threedimensional skin constructs were performed on 9-mm × 9-mm × 1.5-mm tantalum coated carbon Cellfoam matrices (Cytomatrix) incubated with 100 µg/ml rat tail collagen I (Sigma Aldricht) and seeded with 1x10⁵ HaCaT Keratinocytes and 5×10⁴ primary fibroblasts, in culture medium consisting of a 1:1 mixture of the fibroblast and keratinocyte media described above. After 5 hours at 37°C, 5% CO2, matrices were moved to a new 24-well plate and 2 ml of a 1:1 mixture of the two media described above was added. The skin cell constructs were cultured for 6 days and medium was changed every other day. On day 6, CD34⁺ cells, isolated from either umbilical cord or adult peripheral blood, were added to each matrix, and the unit cultured in DMEM supplemented with 10% heat-inactivated FCS (Sigma-Aldrich), 20 ng/ml IL-7 (Miltenyi), 20 ng/ml IL-15 (Miltenyi), 100 ng/ml Flt-3L ligand (Miltenyi) and penicillin/ streptomycin (Sigma-Aldrich). One-half of the medium was aspirated and replaced every 3 days, and the coculture maintained for up to 3-4 weeks.
on a VarioMACS magnet [10]. The separated cells were analyzed by flow cytometry and consisted of a unique highly pure CD34+CD45lo population. Purity (considered as CD34 expression out of total CD45) was always > 90% in all separations, and viability, evaluated by staining the cells with 250 ng/ml Propidium Iodide solution (Sigma Aldricht), always >99%, No CD3 nor CD20 contaminating lymphocytes were detected. These freshly separated and collected CD34+cells were then used for the T cell differentiation studies.
Culture of keratinocytes and fibroblasts The HaCaT cell line (CLS, DKFZ) [11] were cultured in DMEM medium (Sigma-Aldrich) supplemented with 10% heatinactivated fetal bovine serum (FBS), 2mM L-glutamine and 10% antibiotics (penicillin 100U/ml and streptomycin 100mg/ml) at 37°C with 5% CO2. The cells were passaged when less than 80% confluence. Primary Fibroblasts were purchased from Invitrogen, and cultured in Medium 106 (Invitrogen) supplemented with 2% heat-inactivated fetal bovine serum (FBS), hydrocortisone 1mg/ml, human-Epithelial Growth Factor 10ng/ml, human-basic Fibroblasts Growth Factor 3ng/ml, heparin 10µg/ml and 1X gentamycin/amphotericin. The
PLOS ONE | www.plosone.org
3
July 2013 | Volume 8 | Issue 7 | e69572
Human T Lineage Development In Vitro
Figure 3. Generation of CD3+ thymocytes. (A) CD7hiCD3hi and CD7 dim CD3⁻ cells were detected at day 7. (B) By day 12 approximately 90% of all the cells generated were CD3+ thymocytes. (C) A matrix seeded with approximately 300 CD34+ cord blood derived progenitors generated about 2900 CD3+ cells after 14 days. At that time about 150 CD34+ progenitors were still present whereas no other cell types were detected. The image A is representative of three different experiments while images B and C show a single experiment. doi: 10.1371/journal.pone.0069572.g003
Flow Cytometry Analysis
Reverse transcriptase-polymerase chain reaction
Cell suspensions were analyzed using different combinations of conjugated monoclonal antibodies (mAbs) and their corresponding isotype controls after pre-incubation for 10 minutes at 4oC with 10 µl of FcR blocking reagent (Miltenyi). All antibodies were obtained from BD Biosciences unless stated otherwise, and were used according to the manufacturer’s instructions. The following mAbs (clones) were used: CD1a (HI149), CD3 (UCHT1), CD4 (RPA-T4), CD45 (HI-30), CD8 (SK-1), CD7 (6B7), CD38 (HIT-2), CD10 (HI-10), HLA-DR (G46-6), CD11c (Biolegend 3.9), CD56 (Biolegend MEM-188), CD135-APC (Biolegend BV 10A4H2), CD45/ CD34 cocktail (Miltenyi MB4-6D6/AC136), CD20 (Miltenyi LT20), Analysis of flow cytometry samples was performed on a C6 Accuri instrument.
The RNA was isolated using Trizol (Invitrogen) and total RNA (1 µg) in 20 µl was transcribed into cDNA using the high capacity cDNA Reverse Transcription kit (Applied Biosystems). The cDNA product was mixed with QIAGEN SYBR Green Reagent and primers, and Real-time PCR performed using a CFX96 Bio-Rad real time PCR system (Bio-Rad). For the generation of standard curves, gene inserts were amplified using Green GoTaq Flexi DNA Polymerase (Promega), and the PCR product size controlled by 1.5% agarose gel electrophoresis. DNA concentration was measured with a spectrophotometer (Picodrop) and serial dilutions prepared starting from 1011 copies/µl as calculated by using Avogadro’s formula. All cDNA samples were normalized to ribosomal protein subunit 29 (RPS-29) housekeeping gene signals [12]. Primers used were as follows (anneal temperature): Dll-1
PLOS ONE | www.plosone.org
4
July 2013 | Volume 8 | Issue 7 | e69572
Human T Lineage Development In Vitro
Figure 4. Most of generated cells are mature thymocytes by day12. . The presence of double positive CD4+CD8+ and either CD4+ or CD8+ single positive CD3+ thymocytes was evident by day 12 when only about 2% of total CD45+ cells still expressed CD34. The images are representative of three different experiments. doi: 10.1371/journal.pone.0069572.g004
10000 goat anti-rat IgG IRDye 800 (LI-COR) and normalized to β-actin using 1:10000 mouse IgG2a isotype anti-human-β-actin (Sigma-Aldrich) plus 1:10000 goat anti-mouse IgG IRDye 680 (LI-COR).
forward 5’ CTGATGACCTCGCAACAGAA3’ reverse 5’ ATGCTGCTCATCACATCCAG3’ (60°C), Dll-4 forward 5’ACTGCCCTTCAATATTCACCT-3’ reverse 5’ GCTGGTTTGCTCATCCAATAA3’ (60°C), IL-7 forward 5’ TGAAACTGCAGTCGCGGCGT3’ reverse 5’ AACATGGTCTGCGGGAGGCG3’ (57°C), RPS-29 forward 5’ GCTGTACTGGAGCCACCCGC3’ reverse 5’ TCCTTCGCGTACTGACGGAAACAC3’ (55-60°C).
TREC analysis DNA was isolated from blood and newly generated CD3+ cells using Trizol reagent (Invitrogen) according to the manufacturer’s instructions and DJ signal join–type T-cell receptor excision circles (sj-TREC) were assayed. DNA (50 ng) was used in each RPS-29, sj-TREC PCR reactions in order to calculate TREC: T cell ratios as previously described [2]. Separated CD34+ cells were also analyzed in order to exclude T cell contamination.
Western immunoblotting Cells were lysed on ice in a buffer containing 150 mM NaCl; 50 mM Tris, pH 7.5; 1% NP-40 (Fisher Bioreagents), and total proteins re-solubilised in 1% TBS-Tween (Acros Organics) supplemented with complete protease inhibitor mixture (Roche Applied Science). Protein concentration was determined in all cell extracts using a Micro BCA Protein Assay Kit (Thermo Scientific). The samples (30 µg proteins) were electrophoresed on a SDS-PAGE gel (Invitrogen) and electrotransferred to a polyvinylidene difluoride membrane (Millipore) using an electroblotter (Bio-Rad). The membrane was then incubated with primary antibodies overnight and protein bands detected with infra-red labelled secondary antibodies on the Odyssey Infrared Imaging System (LI-COR). Dll-4 protein was detected with 1:500 rat polyclonal anti-human Dll-4 (Enzo Life) plus 1:
PLOS ONE | www.plosone.org
Statistics All comparisons were assessed using Student t test. Results were considered significant if the P value was less than 0.05.
5
July 2013 | Volume 8 | Issue 7 | e69572
Human T Lineage Development In Vitro
Figure 5. Hacat keratinocytes and fibroblasts growth in the matrices. (A) Growth curves of Hacat keratinocytes and/or fibroblasts cultured in the matrices: The differences between the co-culture and the separated components are all statistically significant (*p < 0.001; **p < 0.001) and the results shown are the average of three different experiments ± standard deviation. (B) At the 14th day of culture the matrices seeded with Hacat keratinocytes and fibroblasts at a 2:1 ratio were predominantly constituted by the former cell type. The cells were distinguished by CD10 expression and the results shown are the average of three different experiments. (C) Images of cells attached either to the matrix borders (*) or inner niches (**). The tantalum skeleton of the matrix appears in black. Light microscope image (100X). doi: 10.1371/journal.pone.0069572.g005
Results
small number of DP CD4+CD8+ cells, all cells expressed CD45 and analysis of cultures also showed the presence of cells which were CD1a+CD7+ or CD1a+CD7- cells (Figure 2). The first few CD3+ cells appeared at 7 days as CD7hi cells (Figure 3A), and later CD3 expression further increased. In one experiment matrices were seeded with approximately 300 CD34⁺ cells and analysis at day 12 revealed that more than 90% of the cells generated were CD3+ (Figure 3B). On day 14 we were able to collect about 2900 CD3+ cells (Figure 3C). At 12 days CD3+CD4⁺CD8⁺, CD4⁺CD3+ and CD8⁺CD3+ cells were present, only few CD45+ cells still expressed CD34 and most of the CD3+ cells were CD4+CD8- (Figure 4). This phenotypic data revealed that within this model system differentiation was ordered and progressed along the normal developmental pathway as judged by the sequential
De novo generation of cells in three-dimensional matrices Initial experiments with serial dilutions of cord blood CD34+ cells showed an exponential correlation between the initial number of CD34⁺ cells seeded and the total amount of CD45⁺CD34⁻ mature blood cells collected from the supernatant of cell-coated matrices at day 14 (Figure 1A). Cells were regularly shed into the supernatant and these were collected whilst feeding the cultures at 2-3 day intervals and analysed. The cells in the supernatant all expressed CD34 initially but this abruptly and progressively declined with culture time (Figure 1B) whilst an increasing percentage of the population started to express CD7, CD38 and CD1a. By 5 days we were able to detect CD4 dimISP and also able to identify a
PLOS ONE | www.plosone.org
6
July 2013 | Volume 8 | Issue 7 | e69572
Human T Lineage Development In Vitro
Figure 6. Dll-4 and IL-7 are up-regulated by three-dimensional cultured keratinocytes. (A) Dll-4 gene expression is strongly up-regulated in 3D cultured Hacat keratinocytes either alone or in the presence of fibroblasts. The differences between 3D and 2D either Hacat (*p