companies can make goods available "when" and "where" customers ... is/are included in a picking list and then retrieved by single or multiple pickers. Lastly ... Department-German Jordanian University, 35247 Amman, 11180, Jordan. (phone: ...
Proceedings of the World Congress on Engineering 2010 Vol III WCE 2010, June 30 - July 2, 2010, London, U.K.
A Simulation-Based Decision Making Tool for Key Warehouse Resources Selections Safwan A. Altarazi and Maysa M. Ammouri Abstract—Managers of manual storing and picking warehouses have to decide how much labor resources to use and how much space to have. These decisions are crucial since they directly affect the warehouse performance in terms of throughput and operational costs. This paper presents a simulation-based tool for selecting key WH resources considering both generic and case-based WH characteristics. The simulation experiments are designed in order to simultaneously considering multi input effects. The results show that the two factor effect of simultaneously adopting the volume-based storage policy and changing the manner of using the gating system generates the optimum resources selection. Index Terms—Simulation, Warehousing resources.
Warehousing
operations,
I. INTRODUCTION The warehouse (WH) is a point in the logistics system where a firm stores or holds raw materials, semifinished products, or finished products. By using warehouses, companies can make goods available "when" and "where" customers demand them. With the evolution of supply chain philosophies, strategic alliances, and just-in-time; the last few decades have seen a new role for warehousing. Today's WH is not a classical long-term storage facility. Attention is given to the warehousing role in attaining the logistics goals of shorter cycle time, lower costs, lower inventories, and better customer service. Warehouses operations and layouts are being redesigned to achieve cost and order-processing goals. Warehouse operations can be roughly classified into storing, picking, and routing. Storing operations determine where each stock keeping unit (SKU) should be stored. Picking operations answers the question of which SKU/SKUs is/are included in a picking list and then retrieved by single or multiple pickers. Lastly, routing operations aim to minimize a picker traveled distance by deciding on the picking route of the SKU/SKUs in a picking list. Many existing research addresses warehouse operational issues, mainly, the focus of this research has been on identifying more effective storing, picking, and routing policies. S. A. Altarazi is an assistant professor in the Industrial Engineering Department-German Jordanian University, 35247 Amman, 11180, Jordan (phone: +962-79-5626784; fax: +962-6-5300666; e-mail: safwan.altarazi@ gju.edu.jo). M. M. Ammouri is a teaching assistant in the Industrial Engineering Department-German Jordanian University, 35247 Amman, 11180, Jordan (phone:+962-79-6921425; fax: +962-6-5300666; e-mail: maysa.ammouri@ gju.edu.jo).
ISBN: 978-988-18210-8-9 ISSN: 2078-0958 (Print); ISSN: 2078-0966 (Online)
Three main storing policies can be found in practice. The simplest one is the random storage in which SKUs are randomly stored based on available space. This policy often requires less space; however, it generally requires high transported distances when SKUs are retrieved. Volume-based storage policy prioritizes SKUs based on their demand, the higher the SKU demand the closer to the pick-up/drop-off point of a WH the SKU will be located. Studies showed that implementing the volume-based policy when one product is picked on each route [1], or when it is implemented within-aisle; significantly reduces travelling distance [2], [3]. The third storage policy, the class-based, classifies SKUs into classes and assigns storage locations for these classes. It was argued that this policy requires less data processing than the other policies [4]. Various policies can be used to determine the contents of a picking list. In the strict-order-picking, also called discrete picking policy, only a single order is included in a picking list. This policy is known for its simplicity and maintainability of order integrity. In batch picking the picking list can include many SKUs from various orders. This combination of several orders in one list/travel has proven to reduce the total picking time [5]. Orders in zone picking are divided into several lists and the WH is also divided into several zones with single picker-zone assignment. The fourth major picking policy is the wave policy in which orders are picked to satisfy the required shipping schedule. The routing problem is a variant of the classical Traveling Salesman Problem (TSP). This idea was earlier used in generating an optimal policy for WH routing [6]. Generally, all TSP algorithms, whether optimal or approximate, can be adopted as routing policies. Heuristic-based policies are practically more applicable because of their easiness of use and near-optimal solutions [7]. Traversal routing is one example of heuristic routing policy. In this policy, pickers must fully traverse the entire aisle once they enter it. Simulation has traditionally been used to investigate WH operations and validate new proposed policies. The work of Gue, Meller, and Skufca [8] is an example of using optimization-simulation approach for investigating the effects of pick density on order picking areas with narrow aisles. Peterson and Aase [9] used a simulation-design of experiment approach to analyze the simultaneous effect of various WH policies on its performance. Macro and Salmi [10] developed simulation model for quantifying rack utilization and capacity of different configurations of pallet racks in a WH. Most of the above existed research on WH operations validates their methods on general WH examples. Although this approach makes the method capable of being
WCE 2010
Proceedings of the World Congress on Engineering 2010 Vol III WCE 2010, June 30 - July 2, 2010, London, U.K. benchmarked, it falls short in modeling some specific characteristics of WHs. This is actually significant since unlike the popular belief, every WH is not the same [10]. Also, a large amount of WH operations research does not consider the simultaneous effects of multi inputs on some WH performance criterion; hence, questioning their concluded results and making it either invalid or at least incomplete. This paper proposes a simulation-based tool for selecting key WH resources considering both general WH operations characteristics and specific attributes of the investigated WH. In addition, the selection resources values is a result of simultaneously considering multi input effects. The next section explains the proposed simulation model and the WH features where the model is experimented. The experiments design is presented in the third section. The results and discussion is given in section four and the paper ends with concluding remarks in section five.
storage capacity. On the other hand, Table I includes the WH operations based data. The data was categorized according to seven WH operational activities entitled: receiving, unloading, putting a way, storing, order preparation and picking, loading, and shipping. For example, the receiving activity for twenty cages of the T SKU category is modeled with an exponential distribution that has a mean of fifty five minutes [Exp(55), per 20 cages]. Furthermore, the unloading activity for one cages of the D SKU category is modeled with a normal distribution that has a mean of four minutes and standard deviation of half a minute [N(4, 0.5), per cage]. All tabulated data was measured and then fed to the model.
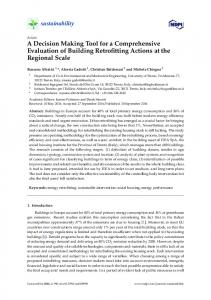
II. WAREHOUSE SIMULATION MODEL This section describes the ARENA WH simulation model developed in this research. A design criteria document was developed to guide the model development. This document includes models’ objective, required data and design. Yet, before presenting the elements of this document the WH the model was developed based on is described. A. WH Description The simulation model is designed based on the operations of a manufacturing facility WH that is shown in Fig. 1. The characteristics of this WH are: Two main SKU categories are stored in the WH, called T and D. The WH operates in two shifts from 7:00 a.m. until 11:00 p.m. The WH uses racking system with a full capacity 210 racks. The rack capacity is 20 cages and the cage is 2.16 m3 in size. Picking and storing activities are conducted manually using a cart that can move one cage in each travel. For both T and D, the receiving and shipping activities occur in full trucks that have a capacity of 20 cages for SKU category T and 30 cages for SKU category D.
Fig. 1: WH layout Table I: WH operational activities data* Operation Statistical Distribution Receiving (time between arrivals) Unloading
B. The Simulation Model Design Criteria 1. Objective The simulation model is utilized as a tool to analyze an existing WH system, as well as a method to analyze different alternatives for more efficient warehousing. Principally, the model is used to select the labor requirements and to evaluate the warehouse space utilization. Moreover, the model can analyze potential feasible changes in layout design. Generally, the model can evaluate the overall WH efficiency. 2. Required Data Numerous amounts of data are required for the execution of the simulation model. Mainly this data can be classified into WH operations based and WH layout based. The WH layout data includes the internal and external dimensions of the WH, the locations of the racks and gates, and the WH
ISBN: 978-988-18210-8-9 ISSN: 2078-0958 (Print); ISSN: 2078-0966 (Online)
Putting a way Storing Order preparation and picking Loading Shipping (time between departures)
T D Exp(55), per Exp(85), per 20 cages 30 cages N(1, 0.5), per N(4, 0.5), cage per cage N(0.05, 0.01), per cage per meter Delay N(30, 10), per cage
N(5, 1), per cage Exp (18), per 20 cages for the 1st week of the month Exp (26), per 20 cages for the 2nd & 3rd weeks of the month Exp (32), per 20 cages for the 4th week of the month * The random variables in all the stated distributions have “minutes” time units
WCE 2010
Proceedings of the World Congress on Engineering 2010 Vol III WCE 2010, June 30 - July 2, 2010, London, U.K. 3. Model Design Several modules are integrated together to form the overall ARENA simulation model. The modules are entities, resources, and storage queues. The entities module consists of three types: SKU entities, order list (picking list) entities, and logic entities. The SKU entities describe the items to be stored for both the T and D groups. The order list entities specify the required SKU type to be picked to fulfill an order. The logic entities are used to compute the number of SKU items stored at the WH every ten minutes of the simulation run. The resources module consists of unloading labor at each receiving duck, loading labor who loads the picked item to the transporting carts, storing labor that drives the cart and searches for the best storage location for it based on the routing policy used, and picking labor that receives orders and delivers it from its storing locations to the shipping dock. Finally, storage queues represents rack system locations where SKU items are stored.
III. EXPERIMENTS DESIGN The purpose of this research is to optimize the selection of key WH resources, namely labor and space, through simultaneously investigating their relationship with major influential input factors. The input factors are associated with WH operational policies (picking, storing, and routing), WH layout design, and inbound/outbound transactions of the WH. Regarding the WH under consideration, its current status with respect to these three factors is as follows: Operational policies: randomly assigned SKUs, strict-order-picking, and traversal routing. Layout design: in the layout shown in Fig. 1 the gates are utilized in a way that SKU category T/D is received through “Gate 1”/“Gate 2” while both are shipped from “Gate 2”. Inbound/outbound transactions: For both T and D the receiving activity occurs over the two shifts period while the shipping activity occurs approximately between 7 a.m. and 11:59 a.m. Experimental examinations were designed in order to explore improvements over the above current status. Regarding the “operational policies” the storage policy was changed into volume-based policy based on an ABC analysis that was conducted for all the SKUs. Because of the high demand and homogeneity of individual orders it was not reasonable to change neither the picking nor the routing policies. For the “layout design” the aim was to investigate potential improvements without any major layout changes, hence, the alteration of this factor was to let all SKU categories be received through “Gate 1” and shipped through “Gate 2”. Finally, for the Inbound/outbound transactions factor the alteration was designed by changing the receiving
Treatment/ Needed resource labor employees WH space (%)
time of the inbound activities, hence, all SKU categories were set to be received between 12:01 p.m. and 11 p.m. Table II summarizes the design of the experiments which have three factors each with two levels. The first level of each factor is given a (0) notation while the second level of each factor is designated by (1). Eight treatments (2×2×2) resulted from this experimental design with notations of: (000), (100), (010), (001), (110), (101), (011), and (111). For example, the notation (000) represents the current WH status, or the baseline scenario, while the (110) means the adaption of the volume-based storage policy (second level of factor 1) and the new way of using the gates (second level of factor 2) while keeping the original inbound receiving times (first level of factor 3).
IV. RESULTS AND DISCUSSION Eighteen working months were simulated. In order to exclude the starting period a worming-up of twenty days was used and data was collected afterword. Each simulation run for each experiment consists of ten replicates to test various random number generating groups. Resulted outputs of the eight experiments are given in Table III. In order to differentiate between the different treatments, two key resources are used: required number of labor employees and required space as a percentage of the available WH space. Furthermore, Table IV shows the average resources savings relative to the baseline scenario (000). The second and third columns represent the savings in labor and space resources, respectively. The third column represents total equivalent savings in terms of number of employees. This total saving was calculated by considering, according to the WH under investigation, that 2% saving in space requirements is equivalent to saving of one labor employee. Table II: Experiments Design Factor Levels/(Notation) WH Operational 1.Current scenario/ (0) policies 2.Use Volume-base storage policy/(1) WH Layout 1. Current scenario /(0) design 2. All SKU categories are received through “Gate 1” and shipped through “Gate 2”/(1) WH 1. Current scenario /(0) Inbound/outboun 2. All SKU categories are received d transactions between 12:01 p.m. and 11 p.m. and shipped between 7 a.m. and 11:59 a.m./(1)
(000)
Table III: Simulation model results (100) (010) (001) (110)
(101)
(011)
(111)
7.701 93.08
6.917 89.23
7.187 89.27
8.463 91.89
7.598 88.47
ISBN: 978-988-18210-8-9 ISSN: 2078-0958 (Print); ISSN: 2078-0966 (Online)
8.214 90.54
8.014 94.12
7.329 87.92
WCE 2010
Proceedings of the World Congress on Engineering 2010 Vol III WCE 2010, June 30 - July 2, 2010, London, U.K.
Table IV: Resources savings relative to baseline scenario (000) Treatment Employees Space Total Saving Saving equivalent (%) (%) savings in terms of employees number (100) 10.18 4.14 2.95 (010) -6.67 2.73 0.79 (001) -4.04 -1.12 -0.91 (110) 4.83 5.54 3.19 (101) 6.67 4.09 2.63 (011) -9.90 1.29 -0.22 (111) 1.33 4.95 2.59 A. Single Factor Effect The influence of single factor treatments ((100), (010), and (001)) is so dissimilar. That is, by only changing the storage policy from the current random policy to a volume-based policy, a significant savings in the two investigated resources was accomplished. The justification behind this is that volume-based storage policy reduces the average transportation distance required for storing single cage; hence, lower transportation labor is required. Also, the volume-based storage policy reduces the average number of racks that is used by a single SKU, hence, reduces the average percentage of unfilled racks. As a result, space requirement for each SKU, and consequently, for all SKUs will be reduced. Changing the SKUs receiving time (001) had an opposite effect to (100). Additionally, this treatment resulted in worse performance than the (000) scenario as it required more labor and space resources. This could be due to the new work distribution resulted from the (001) scenario. Originally, storing of the T SKU was performed over the whole two shifts, but in the new case it takes place in eleven hours. This high dense work resulted in lowering the labor efficiency and required more labor resources. The last single factor treatment, changing the way of using the WH gates (010), showed a mixed effect on the resources usage. That is, it required higher number of labor employees (6.67% extra), and lower space (2.27% less). The reason behind extra requirements of labor is that when setting the SKU of category D to be received from “Gate 2” instead of “Gate 1”; more transportation will be required for the storage and picking activity, therefore, more labor requirements. B. Two Factors Effect The treatments of this effect include (110), (101), and (011). Both the (110) and (101) resulted in fewer resources requirements than the base scenario. This is mainly because these treatments include changing the storage policy into the volume-based which significantly reduces the resources needed as mentioned before. Even when combined with a negative effect factor as in treatment (101), the positive effect of utilizing the volume-based storage overcomes the negative effect of changing the SKUs receiving time. Lastly under this effect, the combination of changing the way of using the WH
ISBN: 978-988-18210-8-9 ISSN: 2078-0958 (Print); ISSN: 2078-0966 (Online)
gates and changing the SKUs receiving time (011); worsened the outcome of labor requirements by asking for 9.9% increase than the (000) scenario, and just improved the space requirements by 1.29%. C. Three Factors Effect The (111) three factor treatment had positive effect in requiring lower labor and space resources than the base scenario. D. Optimum Selection In order to select the optimum choice among the eight investigated treatments a criterion that combines the two evaluation parts is adopted. This criterion is the total equivalent savings in terms of number of employees as shown by the third column of Table IV. By examining this column it can be shown that the (110) has the optimum effect. It can be seen from Table IV that all treatment which contains the volume-based storage policy resulted in performance improvement. Hence, having the volume-based storage in the optimum policy is well justified. On the other hand, changing the SKUs receiving time had resulted in degrading the performance criteria in all the treatment it is a part of. Therefore, keeping the SKUs receiving time as-is is also very reasonable. Finally, changing the way of using the WH gates generated better overall effect than keeping the current gating usage state; hence, it is included in the optimum selection. To summarize, the results of the simulation model showed that the resources can be optimized by changing the current storage policy into volume-based and by setting all the SKU categories be received through “Gate 1” and shipped through “Gate 2”. In comparison with the current scenario, the suggested changes will reduce the labor operational cost by 4.83% and the space related operational cost by 5.54%.
V. CONCLUDING REMARKS This paper presents a discrete event simulation model of the internal operations at a real WH. The model aims to select labor requirements and to evaluate the warehouse space utilization. Three major factors are analyzed and their impact on resources selection is presented. The factors are operational policies, layout design, and inbound/outbound transactions. The results show that the two factor effect of simultaneously adopting the volume-based storage policy and changing the manner of using the gating system generates the optimum resources selection. Future work on this research will include further validation in other WH systems particularly with high and low throughputs. Also, developing an optimal algorithm for WH resources selection and supporting it with simulation results would be another significant extension of this work. REFERENCES [1]
[2]
J. Heskett, “Cube-per-order index-a key to work-house store location,” Transportation and Distribution Management, vol. 3, 1963, pp. 27–31. J. Jarvis, and E. McDowell, “Optimal product layout in an order picking warehouse,” IIE Transactions, vol. 23(1), 1991, pp. 93–102.
WCE 2010
Proceedings of the World Congress on Engineering 2010 Vol III WCE 2010, June 30 - July 2, 2010, London, U.K. C. Peterson, and R. Schmenner, “An evaluation of routing and volume-based storage policies in an order picking operation,” Decision Sciences, vol. 30(2), 1999, pp. 481–501. [4] A. Eynan, and M. Rosenblatt, “Establishing zones in single-command class-based rectangular AS/RS,” IIE Transactions, vol. 26(1), 1994, pp. 38–46. [5] C. Petersen, “An evaluation of order picking policies for mail order companies,” Production and Operations Management, vol. 9(4), 2000, pp. 319–335. [6] H. Ratliff, and A. Rosenthal, “Order-picking in a rectangular warehouse: A solvable case for the traveling salesman problem,” Operations Research, vol. 31(3), 1983, pp. 507–521. [7] R. Hall, “Distance approximations for routing manual pickers in a warehouse,” IIE Transactions, vol. 25(4), 1993, pp. 76–87. [8] K. Gue, R. Meller, and J. Skufca, “The effects of pick density on order picking areas with narrow aisles,” IIE Transactions, vol. 38, 2006, pp. 859–868. [9] C. Petersen, and G. Aase, “A comparison of picking, storage, and routing policies in manual order picking,” International Journal of Production Economics, vol. 92, 2004, pp. 11–19. [10] J. Macro, and R. Salmi, “A simulation tool to determine warehouse efficiencies and storage allocations,” Proceedings of the Winter Simulation Conference, 2002, pp. 1274–1281. [3]
ISBN: 978-988-18210-8-9 ISSN: 2078-0958 (Print); ISSN: 2078-0966 (Online)
WCE 2010