1
BlueWater: A Slick Monitoring System Based on Image Processing, Statistical Classification and Predictive Modelling in the Marine Environment Zoheir A. Sabeur1, Mitchell C. Hockley1 Alessandra Bagnato2 and Marco Iardella2
Abstract An automated surveillance system for monitoring surface-borne pollutants at sea is being developed in the BLUEWATER (BW) project. A digital video camera has been installed at a strategic position within a Region of Interest (RoI) and scenes of suspected surfaceborne pollutants (Slicks) are recorded in time for interpretation and diagnosis. The collection of image data is currently used for the development of an advanced Image Processing Module (IPM) and also the Training & Testing of a Comparator Module (CM) in the BW system. This paper highlights the foundation concepts of the BW system and the underlying software architecture involved for its development. Also, the authors provide the development aspects of two modules, the Comparator and Control, which are among the important building blocks of the BW system.
1.
Goal and Scope
The aim of the BLUEWATER project is to develop a reliable early warning system for monitoring pollution at sea. The system, currently under development, is purposely built on a set of software modules with specific tasks and data interactions. These modules are developed separately by various partners within the project consortium. As a result, the integration of all modules in the BW system 1
Dr Z.A.Sabeur, Research and Development Manager, Dr M.C.Hockley, Senior Software Engineer , BMT Marine Information Systems Limited, UK,
[email protected] and
[email protected] 2 Ms A.Bagnato, Senior Software Engineer, Mr M. Iardella , Project Leader , TXT esolutions spa, Italy,
[email protected] and
[email protected]
04/10/2001, ui-vorlage-en.rtf
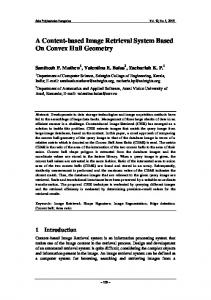
2 required a consensus on conceptual ideas, research and development methodologies and software approaches during the project. Figure 1, shows the general perception of the BW system functionality and the various levels of connectivity between modules (Monteleone, 2000). Images of a particular scene of interest are recorded regularly in time (~ every 10-20mins) by a digital video camera. The camera operates within the visible spectrum (380-780nm) and makes the BW system intended for daylight operations only. Live images are transferred to the system database via the Control module. The Control module is the most central block element for data distribution across the BW system modular network. Weather information around the scene of interest is equally recorded at regular time intervals and stored in the system’s database. Pollution diagnosis is automatically performed in time for each recorded and stored image. Raw images are initially processed by the IPM and diagnosed by the Comparator module. The Comparator produces a NO/Yes output for each detected object(s) in the scene. The positive answer (or “Yes” output) refers to a suspected surface-borne pollutant object within the scene, covered by the camera. Each suspected individual object is consequently followed within the image scene and its persistence in time uniquely characterised by the BW system. The automated prediction on persistence of pollutants in time gives important information to the user and a technological advantage over traditional methods of pollution surveillance and management. TC
Sensors
External Information DB
Clients/Server External DB manager
Pollution Monitoring User Interface
Publisher User Interface
Supportt library
Java Servlet Support
Support library
Pollution Monitoring Server Agent
XML CORBA Comm. Library
Publisher Server Agent
XML CORBA Comm. Library
Control Module
Prediction & Analysis Module
Web pages
Support library
Page templates
WWW server
Java class library
Applet
Legend
Servlet
User DB
XML/ CORBA enabled services
Applet /Servlet Communication channel (via HTTP or HTTPS )
Comparator Alghoritms
Database Wrapper
Administrator Tool Server Agent Administrator Tool User interface
Image Processing Module
Database
Server XML/CORBA -based communication channel
Figure 1 Concepts of the BlueWater System and its Modular Architecture
Futhermore, the BW system is equipped with a Predictor&Analysis module, which is used for additional standard diagnosis of pollution. The fate of the detected
04/10/2001, ui-vorlage-en.rtf
3 pollutant object (slicks, algae blooms, etc.) is modelled, and the most probable position of the origin of the pollutant object computed accordingly. The modelling exercise is recommended for the BW system technical user when a high degree of pollution persistence in time is noted by the Comparator. As a result, the BW system not only specialises in the diagnosis of suspect pollutants within the covered camera area but also estimates the most probable source and impact of pollutants, outside the surveillance zone.
2.
Methods
Amongst the important modules in the BW system are the IPM, the Control and Comparator modules. The IPM is currently under development by one of the partners at Aston University, Computing Department, UK (Lowe, 2000). A substantial number of images of a coastal zone have been recently acquired, using the BW system digital video camera. An extensive programme of image processing involving smoothing, noise removal and global normalisation for intensity fluctuations is underway at Aston University. Also, high level descriptors are being explored for best image features extraction. As a result, the density or distribution of the scatter data (pollutant versus non-pollutant) is being modelled. Density fitting is achieved and a treshoding procedure (in feature space) is applied to reveal the suspected pollutant region from the benign ones. Each pixel is finally assigned with a number representing the likelihood of being part of a pollutant. Suspect foreground objects within an image are consequently identified and important geometric features for each respective object computed for the Comparator.
2.1
The Comparator Module
The Comparator module, currently being developed by BMT Ltd (UK), is an expert information system for surface-borne pollutant recognition using artificial intelligence concepts and theories on surface slick evolution in marine environments. The choice of representative features for the suspect polluting objects is based on the unique shapes, brightness, reflectance and weather conditions under which typical biogenic or anthropogenic slicks evolve in the marine environment. Knowledge on surface slick weathering mechanisms is essential for the initial selection of the important features that characterise surface-borne pollutant objects in an image. The first step of the Comparator development involved the adoption of feature vectors for representing object in the diagnosis exercise. The elements of the feature vector include appropriate functions of the time at which an image is recorded, the wind speed (sea state), air and sea temperature and the level of heat
04/10/2001, ui-vorlage-en.rtf
4 exchange at the air-sea interface. Levels of net irradiance is used to interpret the object reflectance, which is the ratio of the upwelling irradiance to that of the downwelling irradiance. Other features includes geometric invariants such as area, circularity and compactness. A weighted distance measure is used to find out if a suspect object falls within the pollutant class which is nearer or considered part of a master hypersurface to some accepted accuracy. As a pattern recognition module, the Comparator operates in two modes: Training and Testing (Sabeur, 2000). The Training mode involves the computation of the weight parametres and leads to determining the appropriate distance measure that minimises the cost function. The cost (or error) function is minimised by using the gradient descent technique where the desired output is achieved by the comparator (Wallace, 1987 and Duda, 1999). A set of master objects, identified as pollutant by an expert, are used for the Training exercise. A second set of master pollutant objects is used for the Testing exercise and the tuning of the Comparator performance on False-Alarms.
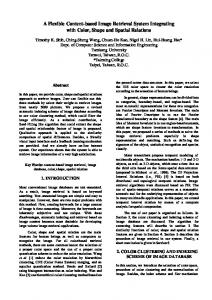
Figure 2 Comparator Module Development: Pollutant Object Localisation within a Scene and Extraction of Geometric features
Figure 2 shows an integrated harness of the IPM and Comparator modules. A black and white image (Bottom right picture) is first selected from a database. The image
04/10/2001, ui-vorlage-en.rtf
5 is then processed by the IPM and a slick likelihood distribution per pixel is obtained and used with a pre-defined threshold to identify suspect objects from the image background (Bottom left picture). A contour tracing algorithm is used for the computation of the geometrical features of each object (Pavlidis, 1982) and a transformation is performed to recover the actual real dimensions of the object that is observed in the image. This is achieved by using the BW system camera position with respect to the area of coverage, the height at which it operates and the depression angle with which it is set for the wanted view of the scene. The comparator identification of each object (Pollutant or Not a Pollutant) is then performed and only the positive diagnosis of pollutant followed up in time. The negatively diagnosed objects are automatically ignored. The pollutant object presence in in time and the degree of its persistence is therefore predicted.
%Slick Area
Pollutant Monitoring Status 100 90 80 70 60 50 40 30 20 10 0
%Area 0
6
12 18 24 30 36 42 48 54 60 66 72 Monitoring Tim e (hrs)
Figure 3 Pollutant Object Persistence in Time Figure 3 shows an illustration of two main pollutant objects and their persistence with time during two consecutive days of surveillance. The monitoring status graph is a useful contextual tool for the characterisation of daily pollution within a scene. Acceptable levels of pollution can be characterised with typical status signatures and their rapid evolution with time. Thus, observed non-characteristic monitoring status signatures can be seen as unusual pollution activities within a scene. This helps the user to further an investigation on the origin and impact of the observed pollutants with the predictor module.
04/10/2001, ui-vorlage-en.rtf
6 2.2
The System Control Module
As mentioned previously, the Control module occupies a central position within the BW system software. It is currently under development by TXT e-solutions, Italy. One of the system’s Control tasks include the periodic retrieval of image data from the camera and their provision to other modules within the system. For example, the the database, the IPM and the Comparator modules. The Control module is also responsible for handling communication and data flow between modules. As a result, it is composed of the following software. •= •=
Acquisition: A direct interface with the camera, which enables the remote control operations of BW system camera. Control: A Data Interchange Control for communication and data exchange with the Human Computer Interface (HCI) and all the system modules as well as of their activation.
Acquisition In the BW system image data is taken from a remote colour video camera and made available to other modules within the system. In this section, the software which interfaces the PCX200 precision colour frame grabber (Imagenation Corporation), its performance and the basic steps that it takes for capturing and accessing images is described. The Acquisition sub-module uses a frame grabber library which enables image capturing, resolution and contrast setting, video inputs switching, image brightness, hue and saturation. It is also designed for accessing captured image data and read/write image files. Further, the Acquisition module manages all operations of the frame grabber device and those of the camera. In this sense, it is implemented as a server module which publicises a simple interface granting. That is; •= Wrapping of the device and camera specific parameters •= Supporting various kinds of cameras and grabbers Among the Acquisition software other tasks include automatic self-initialisation, frame grabber set up through library activation, frame grabber access through request and path or destination set up for captured image data. The newly developed Acquisition software additional role is publicising the methods for capturing an image, re-configuration of the camera and grabber setting parameters, release and exit. This is highly important information for various modules within the BW system, as the system can be adapted to other pollution monitoring regions of interest. A change in location of study requires new camera and grabber settings. These are used by the IPM and the Control modules.
04/10/2001, ui-vorlage-en.rtf
7 Control The BW Control is being developed as a Program Management component which is able to remotely oversee the smooth execution of the underlying BW system components and control their integration. In this section, the Control software main tasks are listed below; •= •=
Periodic Tracking of all the BW systerm data and Feedback to the Monitoring Page of the HCI. Management of data and flow of information at any phase of the BW Pollution Diagnosis Cycle.
The above two tasks specifically described in the following sub-list; •= •= •=
•= •=
3.
Image Acquisition Management: The Control configures and invokes the image Acquisition Module and gives it the BW system configuration information. Environmental Sensors’ Data Acquisition Management: The Control interfaces itself to any available Sensors Modules. Diagnostics Module Activation and Invocation: The Control can activate and invoke the IPM, Comparator and Predictor modules in order to manage and distribute their respective diagnosis output data to the Client server. Data Management: The Control keeps track of all data to elaborate them at the level of the monitoring page of the HCI. Data Storage: The Control modules manages the storage of both acquisition and output data. These are stored in various compartments of the System’s database and accordingly managed for the BW system continuous pollution diagnostics and user query and adminsitration.
Project Status
The BW project is funded by the European Union under reference number IST1999-10388 and it is made of a consortium of partners within the EU. The project is funded for a period of thirty months and has been officially in operation since March 2000. The acquisition of image data through the installation of the BW system camera at an agreed site of interest is currently bringing rich data for Image Processing and Training-Testing of the comparator module. The integration of the pollution diagnostic modules (IPM, Comparator and Predictor) with Control, Client Server and HCI is also underway. The acquisition of historical weather data is also planned to enforce the predictive aspect of the system and also the seasonal weather characterisation of the site of interest.
04/10/2001, ui-vorlage-en.rtf
8
4.
Conclusion and Future Progress
The BW sytem is an automated tool for monitoring coastal and riverine pollution caused by human industrial discharge activities or indeed naturally occuring slicks in marine environments. Further development of the comparator module will involve the advancement of the diagnostic strategy. In addition to the distance measure computation approach of the comparator, surface-borne pollutants will be diagnosed according to their predicted persistence signature in time. An attempt on the identification of the type of pollution and its degree with respect to acceptable background levels in the scene will be performed. The full integration of the various software modules will also lead to the first prototype of the BW system. The initial aspects of the BW system prototype capability and performance in the identification of pollutants will support the refinement phase of the project. Also, valuable feedbacks from the users within the project consortium are expected.
5.
Bibliography
Duda, R.O, Hart, P.E and Stork, D.G (1999): Pattern Classification and Scene Analysis. Eds. John Wiley and Sons, 2nd Edition, New York, USA. Lowe, D (2000): Computerised Video Camera Image Analysis for Monitoring Pollution in Water, BlueWater Software Specification. The Image Processing Module. Monteleone, G, e-TXT (2000): Computerised Video Camera Image Analysis for Monitoring Pollution in Water, BlueWater Software Specification. The Control Module. Pavlidis, T (1982): Algorithms for Graphics and Image Processing. Bell Laboratories. Co puter Science Press., Rockville, MD 20850, USA. Sabeur, Z.A, BMT Ltd (2000): Computerised Video Camera Image Analysis for Monitoring Pollution in Water, BlueWater Software Specification. The Comparator Module. Wallace, D. J (1987): Computational Physics. Proceedings of the 32nd Scottish Universities Summer School in Physics. A NATO Advanced Study Institute. Eds. R.D Kenway and G.S Pawley, pp. 168-210
04/10/2001, ui-vorlage-en.rtf