Analytical Biochemistry 415 (2011) 206–208
Contents lists available at ScienceDirect
Analytical Biochemistry journal homepage: www.elsevier.com/locate/yabio
Notes & Tips
A software complement to AMDIS for processing GC-MS metabolomic data Volker Behrends 1, Gregory D. Tredwell 1, Jacob G. Bundy ⇑ Department of Surgery and Cancer, Faculty of Medicine, Imperial College London, London SW7 2AZ, UK
a r t i c l e
i n f o
Article history: Received 31 January 2011 Received in revised form 5 April 2011 Accepted 8 April 2011 Available online 23 April 2011
a b s t r a c t The software package AMDIS performs gas chromatography–mass spectrometry (GC–MS) peak deconvolution but tends to produce false positives and leaves missing values where peaks are found in only a proportion of a set of chromatograms. We have developed a software complement to AMDIS that (i) allows rapid manual inspection of chromatographic peaks across all samples to confirm data quality and (ii) for a given sample set, integrates peak areas across all samples even where AMDIS deconvolution would leave missing values. The freely available package runs within the commercial Matlab environment and is useful where GC–MS is used to profile complex mixtures. Ó 2011 Elsevier Inc. All rights reserved.
Gas chromatography–mass spectrometry (GC–MS)2 is widely used for metabolomics owing to its excellent chromatographic behavior for volatile compounds (i.e., most metabolites require derivatization) and the production of reproducible mass spectral fingerprints with electron impact ionization [1]. It is a mature and robust technology and is relatively low cost, especially for quadrupole instruments. It is particularly suited to a ‘‘targeted metabolomic’’ approach of profiling a mixture and comparing the results with a compound library [2,3]. Peak deconvolution is necessary to discriminate coeluting compounds by using a priori information from multiple ions. The free software package AMDIS is widely used for deconvolution of GC–MS data [4]. Lu and coworkers [5] concluded that its performance compares favorably to commercial software packages for GC–time-of-flight (TOF)–MS data, although it did tend to give a high false positive rate. However, it does have an additional disadvantage when used in a typical metabolomic study when a small set of chromatograms (e.g., 10–100) are compared: if a compound is detected in some but not all of the chromatograms, this leads to missing values when the peak table (matrix of samples against analytes) is generated. This is problematic because it affects the performance of the multivariate or biostatistical methods that are required to extract information from the complex metabolomic datasets. Of course, it is possible to replace the missing values with zeros, but this introduces additional problems because the actual distribution of the variables (i.e., signal from analyte + signal from instrument noise) is no longer described accurately. Data transformations have been developed to deal specifically with the issue where analyte concentrations are on a similar level as instrument ⇑ Corresponding author. E-mail address:
[email protected] (J.G. Bundy). These authors contributed equally to this work. Abbreviations used: GC–MS, gas chromatography–mass spectrometry; TOF, timeof-flight; GAVIN, GC–MS Assignment Validator and Integrator; QI, quantification ion; VI, validation ion; RT, retention time. 1 2
0003-2697/$ - see front matter Ó 2011 Elsevier Inc. All rights reserved. doi:10.1016/j.ab.2011.04.009
noise [6,7] but are not applicable where zeros replace missing values. We have developed a software package that takes the AMDIS output plus the raw data and gives a ‘‘cleaned’’ peak table (Fig. 1). Specifically, it (i) includes a step for visual inspection of all peaks across all samples by the analyst because this is still more powerful and flexible than fully automated algorithms and (ii) reintegrates peaks from extracted ion chromatograms across an entire sample set, thereby giving a backfilled sample table with no missing values that is ready for further data analysis. Unlike stand-alone software packages such as MET-IDEA [8], which also backfills across all samples in a set, it is designed to be used only in combination with AMDIS. We use AMDIS to process Agilent raw GC–MS data files (acquired using ChemStation), with the Fiehn spectral library [2] or National Institute of Standards and Technology (NIST) libraries, and typically find that AMDIS does not consistently identify targets (metabolites) across all related samples in a set. The output from AMDIS batch processing of multiple spectra consists of two text files for each sample (spectrumname.ELU and spectrumname.FIN). The FIN file contains information about identified targets such as the integrated peak area, retention time, name, and net score. When processing a single spectral file, a simple text report file that summarizes the results in a metabolite list can be produced, but it is harder to combine the results from multiple spectra into a single data matrix. To address this problem, we developed a GC–MS Assignment Validator and Integrator (GAVIN) script for Matlab that is available for downloading (online supplementary information). We use a Perl script (called from within GAVIN) to combine the results from multiple AMDIS files to produce a peak table (sample against metabolite matrix) of metabolites identified in at least one spectrum as a delimited text file. This initial peak table is then imported into the Matlab workspace, together with a spreadsheet containing sample identification and user-defined metadata
207
Notes & Tips / Anal. Biochem. 415 (2011) 206–208
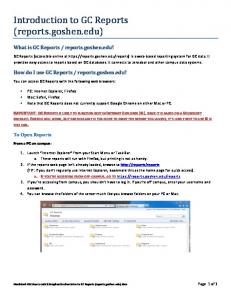
strainID extraction solvent replicate sampling time etc.
metadata
ChemStation
converted raw data, by ChemStation software
AMDIS
raw data (netCDF)
The .FIN files are parsed to extract three pieces of information for all compounds: a)Reference mass spectra b)Retention time, QIon and VIons c)No. of samples in which the compound was detected by AMDIS This is combined with the raw data for visualization of each compound across all samples
in Agilent format
raw data
.FIN files
extracted library spectra
GAVIN
backfilled data
files generated by AMDIS for each sample containing deconvoluted compound information.
m/z values and intensities for each compound in the used library
data matrix in usual format: samples-bycompounds
Fig.1. Schematic of operations performed by the software package.
(e.g., experimental treatment, replicate number), to aid graphic representation of the results. This forms the basic data structure that is used as the starting point for visual inspection and backfilling of the data matrix. To perform the backfilling, the GAVIN package imports the raw GC–MS data in netCDF format (netCDF support is native in Matlab release 2008b and newer versions), and a manual validation procedure is carried out on a per compound basis. As a first step, the user is asked to define a threshold that selects metabolites found in only a certain percentage of samples. Based on this subset of compounds, GAVIN starts with the compound that has the lowest mean retention time and extracts a quantification ion (QI) and two validation ions (VI1 and VI2) from the raw data for each sample. The QI is taken from the user’s AMDIS library; however, if one is not defined, then the model ion that AMDIS uses for its peak matching is used. Therefore, it is preferable to have a QI (model ion) defined in AMDIS. The VIs are defined as the next two most abundant ions in the compound mass spectra; however, some commonly occurring ions, such as 73 and 74 as well as ions 1 or 2 mass units away from the QI, are excluded from being VIs. These extracted ions are displayed as tiled subplots for each sample, with the three ion chromatograms colored differently. There is no alignment of chromatograms. A screenshot of the user interface is given in Fig. 2. If the package is called with the ‘‘Overlay’’ option set to ‘‘Yes’’, then the data of the QIs and respective VIs are overlaid for all samples and displayed in three windows, one for each ion. This option should be selected if a large number of samples are to be analyzed simultaneously. In each plot, the dashed lines represent the integration region for the QI and the solid black line represents the center of that region. Yellow backgrounds (default mode) or ion chromatograms colored yellow (overlay mode) signal that the compound was not identified by AMDIS in that sample. As seen in Fig. 2, the user has various options for each compound. If ‘‘Integrate’’ is selected, then the QI is integrated over the integration region and passed to the result matrix. The ‘‘Delete’’ option deletes the peak for all samples, effectively erasing the compound from the results matrix. ‘‘Manipulate’’ allows the user to change the parameters of the integration region. ‘‘Narrow Interval’’ narrows
the integration region in the case of peak overlap, and ‘‘Widen Interval’’ widens the integration region in the case of broad peaks. ‘‘Force RT’’ (retention time) enables the user to manually set the center of the integration region. This is useful for QIs that are common to several compounds for which multiple peaks might be found within the RT window and so for which the automatic peak picking (the center of the integration region is set to the maximum value in the displayed RT window) might pick the wrong peak. Additional options for improving consistent peak picking in normal mode (i.e., non-overlay) are the RT shift penalty options explained in the supplementary material. Once the manual validation procedure is completed for each compound in the data matrix, the package generates a samplesby-compounds array without missing values and also three data structures containing (i) the metadata and the backfilled integrals (‘‘curatedData’’), (ii) the information retrieved from the AMDIS output files (‘‘keptCompounds’’), and (iii) the raw data including the GC dimension (‘‘rawData’’). GAVIN can be called with several command line options that are described in the supplementary material. Briefly, ‘‘Overlay’’ toggles between two options to display and integrate the data. In nonoverlay mode, the extracted ions are displayed in a different plot for each sample and the RT is determined by finding the maximum value of the QI in the integration window. In contrast, the RT is defined by the maximum value of the QI across all samples in overlay mode. ‘‘SameScale’’ toggles if the intensity scale (y axis) of the extracted ion chromatograms is defined on a per-sample or per-batch basis. ‘‘rtPenalty’’ can be used to facilitate peak picking by imposing penalties based on RT differences from the expected RT. Finally, after each compound, GAVIN deposits the data structure PrevCompVal into the Matlab workspace. This acts as a failsafe in case the integration/validation procedure is terminated prematurely. To continue at the last validated compound, GAVIN can be called with PrevCompVal as an input argument. In summary, we have developed a freely available software tool for backfilling missing values obtained from AMDIS-processed GC– MS spectra, producing a data matrix more suitable for subsequent chemometric analysis. Users perform visual inspection of mass
208
Notes & Tips / Anal. Biochem. 415 (2011) 206–208
Fig.2. Screenshot showing example of software in use in tiled mode. Yellow panels are samples where AMDIS has not annotated a compound as present. (For interpretation of the reference to color in this figure legend, the reader is referred to the Web version of this article.).
spectral information for all metabolites to give greater confidence in assignments and can adjust the position and size of the integration window. Acknowledgments V.B. was funded by the Biotechnology and Biological Sciences Research Council (BBSRC). G.D.T. was funded by the Bioprocessing Research Industry Club (BRIC), a partnership among the BBSRC, the Engineering and Physical Sciences Research Council (EPSRC), and a consortium of leading companies. We thank Manuel Liebeke for testing the software and offering helpful suggestions. Appendix A. Supplementary data Supplementary data associated with this article can be found, in the online version, at doi:10.1016/j.ab.2011.04.009. The GAVIN package is available as a zipped Matlab directory. The document ‘‘GaVInREADME.pdf’’ contains further instructions for use of the package.
References [1] O. Fiehn, Extending the breadth of metabolite profiling by gas chromatography coupled to mass spectrometry, Trends Anal. Chem. 27 (2008) 261–269. [2] T. Kind, G. Wohlgemuth, D.Y. Lee, Y. Lu, M. Palazoglu, S. Shahbaz, O. Fiehn, FiehnLib: Mass spectral and retention index libraries for metabolomics based on quadrupole and time-of-flight gas chromatography/mass spectrometry, Anal. Chem. 81 (2009) 10038–10048. [3] K.F. Smart, R.B. Aggio, J.R. Van Houtte, S.G. Villas-Boas, Analytical platform for metabolome analysis of microbial cells using methyl chloroformate derivatization followed by gas chromatography–mass spectrometry, Nat. Protoc. 5 (2010) 1709–1729. [4] S.E. Stein, An integrated method for spectrum extraction and compound identification from gas chromatography/mass spectrometry data, J. Am. Soc. Mass Spectrom. 10 (1999) 770–781. [5] H.M. Lu, W.B. Dunn, H.L. Shen, D.B. Kell, Y.Z. Liang, Comparative evaluation of software for deconvolution of metabolomics data based on GC–TOF–MS, Trends Anal. Chem. 27 (2008) 215–227. [6] P.V. Purohit, D.M. Rocke, M.R. Viant, D.L. Woodruff, Discrimination models using variance-stabilizing transformation of metabolomic NMR data, OMICS 8 (2004) 118–130. [7] D.M. Rocke, B. Durbin, Approximate variance-stabilizing transformations for gene-expression microarray data, Bioinformatics 19 (2003) 966–972. [8] C.D. Broeckling, I.R. Reddy, A.L. Duran, X. Zhao, L.W. Sumner, MET–IDEA: data extraction tool for mass spectrometry-based metabolomics, Anal. Chem. 78 (2006) 4334–4341.


![HOMAG Group software for processing centers [PDF]](https://m.moam.info/img/260x300/homag-group-software-for-processing-centers-pdf_64b8d653098a9e4a128b456e.jpg)


