A Statistical Comparison of Tag and Query Logs Mark J. Carman, Robert Gwadera and Fabio Crestani University of Lugano Faculty of Informatics Lugano, Switzerland
Mark Baillie University of Strathclyde Department Computer and Information Sciences Glasgow, UK
[email protected]
{mark.carman,robert.gwadera, fabio.crestani}@lu.unisi.ch ABSTRACT We investigate tag and query logs to see if the terms people use to annotate websites are similar to the ones they use to query for them. Over a set of URLs, we compare the distribution of tags used to annotate each URL with the distribution of query terms for clicks on the same URL. Understanding the relationship between the distributions is important to determine how useful tag data may be for improving search results and conversely, query data for improving tag prediction. In our study, we compare both term frequency distributions using vocabulary overlap and relative entropy. We also test statistically whether the term counts come from the same underlying distribution. Our results indicate that the vocabulary used for tagging and searching for content are similar but not identical. We further investigate the content of the websites to see which of the two distributions (tag or query) is most similar to the content of the annotated/searched URL. Finally, we analyze the similarity for different categories of URLs in our sample to see if the similarity between distributions is dependent on the topic of the website or the popularity of the URL.
content, purpose or functionality of the website. Popular tags for a resource over a population of users can then be assumed representative of the consensus opinion. Social bookmarking systems have recently attracted academic interest, both because they provide an alternative model for finding information (browsing rather than searching) and also because they can be used as an additional source of relevance information when ranking pages in Web search [6, 1, 13]. In this paper we investigate the similarity between query logs and tag data from the perspective of the terms used to search for and annotate individual resources. To the best of our knowledge, no thorough investigation has been performed to date regarding the problem of whether the tags that people use to annotate resources are the same or similar to those used to search for resources. This question is critical for determining if and how social bookmarking data can be used to improve Web search. In particular in this study we attempt to answer the following questions: • Are queries and tags similar across URLs? If so, can tag data be used to approximate user queries to a search engine? Conversely, can query logs be used to suggest new tags for a particular webpage?
Categories and Subject Descriptors: H.3.3 [Information Storage & Retrieval]: Information Search & Retrieval General Terms: Design, Measurement, Experimentation. Keywords: Query Log, Tag, Folksonomy, Web Search.
1.
2
• Which of the distributions, tags or queries, is most closely related to the content of the clicked websites?
INTRODUCTION
Social bookmarking systems like Delicious1 and Bibsonomy2 offer a rich source of information about popular webpages and research articles. In these systems, users annotate resources with a small set of unstructured terms, called tags, that they choose from an unlimited vocabulary. Despite this freedom users generally choose to annotate webpages with common terms from natural language that best describe the 1
• For what types of websites is the correlation between the term distributions for queries and tags the highest?
http://delicious.com http://www.bibsonomy.org
Permission to make digital or hard copies of all or part of this work for personal or classroom use is granted without fee provided that copies are not made or distributed for profit or commercial advantage and that copies bear this notice and the full citation on the first page. To copy otherwise, to republish, to post on servers or to redistribute to lists, requires prior specific permission and/or a fee. SIGIR’09, July 19–23, 2009, Boston, Massachusetts, USA. Copyright 2009 ACM 978-1-60558-483-6/09/07 ...$5.00.
The paper is structured as follows. We first discuss related work before describing our tag and query dataset. We investigate whether the tag and query distributions are similar according to different metrics and perform statistical tests to determine wether the two distributions can be considered the same. Finally, we investigate the content term distributions for the websites in our dataset and compare similarity across the three different term distributions.
2.
RELATED WORK
This paper builds on a large body of work on analyzing large query logs from Web search engines. Researchers have shown that the data in query logs can be mined for various purposes including: tuning retrieval function parameters and thereby improving search engine performance (for example in the “learning to rank” frameworks [7]); query spelling correction; query suggestion/auto-completion and query disambiguation [9]; personalization of search results [3]; and trend analysis [2].
BUILDING A DATASET
In this study we make use of the AOL query log [11], which is to our knowledge the only sizable and recent Web search engine query log (containing primarily English queries) that is generally available to academic researchers. Highly controversial when it was first released, the log contains the search requests of some 657,426 users over a period of 3 months from March to May, 2006. In this study we protect the anonymity of search engine users by only analyzing data, which is aggregated across all users. Moreover our study works toward protecting the anonymity of future search engine users: By comparing query logs with publicly available tag data we hope to answer the question as to whether such public data can be used as a substitute for private search data in future research.
3.1
Gathering the Data
We first scanned the query log selecting the 50,000 most frequently clicked URLs according to the number of distinct (non-identical) queries associated with each. We were forced to select only common webpages to ensure that there was
Dataset All Dmoz
1000 900
URL count
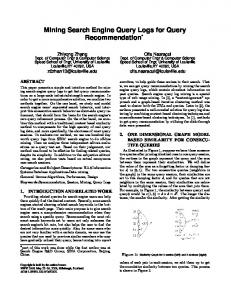
800 700 600 500 400 300 200 100 0 s ew N e om H ns t ul ee Ad n-T ds Ki es am ce G en er ef R th l ea g H pin op Sh ts or Sp e nc ie ion Sc eat r s ec er R put om s C es n si Bu ty e ci So ts l Ar ona i eg R d l or
3.
Prevalence of Dmoz top-level categories in URL dataset 1100
W
Various researchers have investigated the applicability of social bookmarking data to the problem of improving Web search results. For example, Yanbe et al. [13] implemented a search engine using data extracted from Delicious such as the tag date and the popularity of a URL. These social bookmarking features were used to supplement a standard retrieval model. Bao et al [1] also implemented two ranking algorithms that integrated social bookmarking data into the retrieval model; one exploiting the overlap between query terms and tags, and the second using the popularity of web pages as indicated by the tag data. An evaluation on a small set of queries indicated improvements over a BM25 baseline. An analysis of the social bookmarking site Delicious, was conducted by Heymann et al. [6], who found that the bookmark data had a good coverage of interesting pages on the Web, in the sense that bookmarked URLs were disproportionately common in search results. Using popular queries, they found that 19% of the top 10 search engine results and 9% of the top 100 results were present in Delicious. Other important findings included the observation that approximately 12.5% of URL’s posted by users are new pages (unindexed by a search engine). Therefore, social bookmarking data may be a useful supplementary resource for indexing and crawling. It was also discovered that a large overlap existed between popular query terms and tags (over the query/tag logs as a whole), indicating that tagging may be a useful resource to promote popularly tagged urls within a ranking. Another interesting observation was that tags were present in the content of only 50% of pages and 16% in titles of pages annotated by users. Bookmarking data may therefore be a useful resource to address problems such as vocabulary mismatch [4], namely the differences in language used by those searching for content from those writing it. None of these works have investigated the distribution of terms used by searchers and taggers in a principled way to see if there is overlap or correlation between the terms used to query for a particular webpage and those used to annotate the same page. We believe that such an analysis is a critical first step for better understanding the nature of tag data and thereby assessing its usefulness for various tasks such as improving Web search.
URLs ordered by Divergence
Figure 1: Number of occurrences of top-level Dmoz categories in the URL dataset.
sufficient data in the query term distribution to draw meaningful inferences between the query log and Delicious tag data. The clicked URLs in the AOL log had been truncated to display only the domain of the URL and not the corresponding directory structure. For example the URL “http://www.domain.com/something/index.htm” would be recorded in the logs simply as “http://www.domain.com”. This posed a challenge for our analysis because the terms used to generate queries for different pages from the same domain may be completely different. Consider on the BBC news website (http://news.bbc.co.uk). An article regarding “constructions for the Beijing Olympics” may contain many instances of the terms “beijing” and “olympics”. While these terms are representative of the particular story they are not representative of the BBC website as a whole, and thus the tags used to annotate the BBC website may not contain those terms. So before we could compare the query log with tag data from Delicious, we first attempted to reconstruct the complete URL by submitting each query to the Google search engine (as that is arguably the same engine that was used to generate the results seen by the AOL search users) and selected the first occurrence of the given domain amongst the top 32 results returned. Obviously this method is not guaranteed to return the actual URL that was clicked on by the AOL users, but it is a reasonable approximation, given that the query logs are already quite noisy, and may indeed have the unintended benefit of removing some of the noise from the log.3 We then selected all “complete URLs” from the newly reconstructed log that were associated with at least 50 queries (i.e. searchers’ had clicked on the URL at least 50 times) and had been bookmarked a minimum of 20 times in Delicious. This process resulted in query and tag data for a set of 4145 URLs. This sample was considered sufficient for our purposes in order to provide statistically significant results. Figure 1 shows the frequency of URLs in our sample with each of the top level categories from the Open Directory Project (Dmoz). We see that while the distribution over categories for our sample does not follow the distribu3
We note that our query dataset may have a small bias toward consistently popular websites, i.e. sites that were popular in 2006 and have remained so until 2009.
Mean Std deviation Median
Term Occurrences Query Tag 955.3 1105.8 6464.7 1533.4 278.0 393.0
Vocab Size Query Tag 17.6 139.6 12.8 137.7 15.0 83.0
Table 1: Basic Statistics of URL Query/Tag Dataset
tion of URLs found in Dmoz4 , our sample does have good coverage over all the topics in Dmoz. We will use the Dmoz categorizations in later sections to determine how and if the similarity between tag and query distributions depends on the topic of the URL.
Overlap: queries and tags 1
0.8
0.6
0.4
0.2
0
3.2
Cleaning the Data
Web users often enter the URL they intend to navigate to as a search term in the query box rather than using the browser’s navigation bar. Taggers on the other hand, rarely enter the URL of the webpage they are annotating. To correct for this difference, we removed any instance of the URL domain (e.g. “www.flickr.com”) from both the query and tag log. Moreover, since the search engine performed automated spelling correction on malformed URLs, many queries in the log involve simple misspellings of the intended url, such as: “ww.flickr.com”. We removed all such queries, by calculating the Levenshtein distance between the domain of the URL and the query (/bookmark) and removing those which lie within 3 edits of one another. We also removed all punctuation, which is very common in tag data, where users sometimes use it to separate concepts. Finally we removed the most frequent and uninformative query terms using a standard set of Web search engine stopwords and applied Porter’s stemmer to reduce the size of the vocabulary. The last step is particularly important given the limited size of our samples (of queries and tags) for each URL. Basic summary statistics of our dataset are given in Table 1. It is interesting to note that while the average sample size for queries and tags is similar, the average vocabulary size is very different, with tag data having a much larger vocabulary on average than query data. This could be due to the fact that users can enter many times the same term in different queries, (where they are unlikely to enter a term more than once in a bookmark) or because searchers tend to use the same words as one another, while taggers tend to be more inventive.
4.
ARE THE DISTRIBUTIONS SIMILAR?
In this section we review a number of different similarity measures in order to compare and quantify the similarity between tag and query term distributions.
4.1
Vocabulary Overlap
The first and most basic comparison that can be made is to compare vocabularies to see whether the same terms are being used as queries for a URL and as tags to annotate it. To calculate the relative overlap between the vocabulary of query terms (denoted Vq ) and tag terms (Vτ ), we use the 4
The query log sample is biased towards US websites (hence the low value for the “World” category) and to popular websites (hence the high value for “News”).
All terms Remove singletons Top 20 terms
0
500
1000
1500
2000
2500
3000
3500
4000
URLs ordered by Overlap
Figure 2: Vocabulary overlap between queries and tags. URLs are ordered from most similar to least. Comparison between the complete query/tag vocabularies and those modified to remove noise by removing low frequency terms. so-called Overlap coefficient [10]: Overlap(url) =
|Vq ∩ Vτ | min(|Vq |, |Vτ |)
We do not use more common set overlap metrics such as the Jaccard or Dice coefficients because those metrics are sensitive to the relative size of the two sets (the vocabularies). The relative size of these vocabularies is not important to us and is highly dependent on the the sampling process over which we had little control (for some URLs we have lots of queries and very few bookmarks, while for others the reverse is true). The Overlap coefficient tells us how much of the smaller vocabulary is contained in the larger one. Figure 2 shows the amount of overlap between the query and tag vocabularies across the set of 4145 URLs. The URLs have been ordered from most similar to least. The uninterrupted line compares the complete vocabularies containing all terms, while the other two lines compare smaller query/tag vocabularies after we attempt to reduce noise by removing low frequency terms. For the complete case, we see that all URLs share some vocabulary and well over half of the URLs in the sample show a vocabulary overlap of 0.5 or more. This constitutes a large amount of overlap and demonstrates that query and tag vocabularies are indeed very similar. We postulated that a large number of the not overlapping vocabulary terms would be singletons (terms occurring once only in the sample) as they are more likely to be the result of noise in the logs than the more frequently occurring terms. Indeed, after removing singletons from the distributions we see a slight increase in the overlap in Figure 2. This indicates that removing low frequency terms may be a useful policy for applications where query vocabularies are used to approximate tag vocabularies and vice-versa. If however, we take this approach to the extreme and only keep the 20 most frequent terms from each distribution, the relative overlap between distributions drops off significantly. We decided to investigate whether the vocabulary overlap between tags and queries was in any way dependent on the
Overlap: all terms with Dmoz Categories 1
Regional Arts News Computers Business Reference Shopping
0.9 0.8 0.7
Kullback-Leibler Divergence (queries || tags) with Laplace Smoothing 6
All terms Remove Singletons Top 20 terms Uniform
5
4
0.6 0.5
3
0.4 2
0.3 0.2
1
0.1 0
0
500
1000 1500 2000 2500 3000 3500 4000 URLs ordered by Divergence
Figure 3: Vocabulary overlap between all terms in tag and query distributions across different URLs divided into the 7 most frequent Dmoz Categories. Successive curves have been shifted to the right to aid comparison.
0
0
500
1000
1500
2000
2500
3000
3500
4000
URLs ordered by Divergence
Figure 4: Kullback-Leibler divergence between the query and tag distributions with Laplace Smoothing applied to the tag distribution.
smoothing over all terms in the union of the vocabularies we guarantee that the KL divergence will be finite: topic area (domain) of the URL. To do this we compared the vocabulary overlap across URLs from different Dmoz categories. Figure 3 shows the overlap values for the seven most frequent top-level categories from the Dmoz directory. The curve for successive categories has been shifted to the right in the figure to facilitate better comparison. (Thus the fact that one curve lies to the right of another doesn’t indicate higher overlap in this case.) All curves are essentially the same, with the data points spread out with roughly the same distribution (density) along them. In other words, none of the curves has a much higher density at one end than another. This indicates that the amount of vocabulary overlap between tags and queries is not domain dependent.
4.2
Divergence Between Distributions
Having investigated the vocabulary overlap, we now investigate measures that compare the term frequency distributions with each other directly. In particular, we calculate the Kullback-Leibler (KL) divergence between the query and tag term frequency distributions. The formula for the KL divergence is: X pq (w) KL(pq ||pτ ) = pq (w) log p τ (w) w∈V q
where pq and pτ are the relative frequencies of term w in the query and tag distributions respectively. In this ordering the query distribution is considered to be the “true” distribution and the tag distribution is seen as an approximation to it. The relative frequency is calculated as follows: tfq (w) w∈Vq tfq (w)
pq (w) = P
where tfq (w) is the number of occurrences of term w in the query log for a particular URL. Since the KL divergence becomes infinite whenever the probability pτ (w) is zero (which happens for any term in the query vocabulary but not in the tag vocabulary), we replace the relative frequency by a Laplace smoothed estimate pˆτ (w). By performing Laplace
pˆτ (w|url) =
tfτ (w) + 1 P |Vq ∪ Vτ | + w∈Vτ tfτ (w)
We considered using other smoothing techniques such as linear interpolation with a collection model (term frequencies over the whole query/tag log), but decided to compute the similarity metric in the “rawest” form possible so as not to introduce additional smoothing coefficient parameters. Figure 4 shows the KL divergence between queries and tags. This plot tells us how well the smoothed tag term distribution does at describing the term frequencies observed in the query data.5 We note that in contrast to previous graphs, higher values on this graph indicate lower similarity between queries and tags. Removing infrequent terms to reduce noise has a slightly positive effect on the similarity. In order to decide whether or not tag data does a good job at approximating the query distribution, we added a fourth line to the plot. To calculate values along the line, the approximating tag distribution was replaced by a uniform distribution over the same vocabulary. The fact that the new line lies well above the other plots indicates that the smoothed tag distribution is indeed a better than random approximation to the query distribution. The reverse KL divergence, from tags to queries, is shown in Figure 5. This plot tells us how well the smoothed query distribution approximates the tag data. In this case the curve for the uniform distribution is much lower and even crosses over the KL(pτ ||pq ) line, indicating that for a more than one quarter of the URLs, a random distribution over the query vocabulary does a better job at approximating the tag data, meaning the distributions are not similar at all. We see that removing terms from the distributions in order to remove noise actually has the opposite effect in this case, slightly increasing the difference between the distributions. 5 In Information Theory the KL divergence is interpreted as the number of extra bits needed to encode a message generated by the first distribution using an encoding that is optimal for the second.
Kullback-Leibler Divergence (tags || queries) with Laplace Smoothing 5 4.5 4
Jensen-Shannon Divergence: all terms with Dmoz Categories 0.7
All terms Remove Singletons Top 20 terms Uniform
Regional Arts News Computers Business Reference Shopping
0.6
3.5
0.5
3 2.5
0.4
2 0.3
1.5 1
0.2
0.5 0
0
500
1000
1500
2000
2500
3000
3500
4000
0.1
0
500
1000 1500 2000 2500 3000 3500 4000
URLs ordered by Divergence
URLs ordered by Divergence
Figure 5: Kullback-Leibler divergence between the tag and query distributions with Laplace Smoothing applied to the query distribution.
Figure 7: Jensen-Shannon divergence between terms and queries comparing 7 Dmoz categories. Popularity vs Similarity (sample size: 200) 100000
0.7
Number of Bookmarks (URL Popularity)
Jensen-Shannon Divergence: queries and tags All terms Remove Singletons Top 20 terms Uniform
0.6 0.5 0.4 0.3 0.2 0.1
10000
1000
100
10 0.1
0
0
500
1000
1500
2000
2500
3000
3500
0.2
0.3
0.4 0.5 JS(tags||queries)
0.6
0.7
4000
URLs ordered by Divergence
Figure 8: Popularity of bookmark (URL) versus similarity of tag/query distributions.
Figure 6: Jensen-Shannon divergence between the tag and query distributions. While the KL divergence measures model similarity in an asymmetric fashion, it is also possible to measure it in a symmetric fashion using the Jensen-Shannon (JS) divergence. The JS divergence simply calculates the average KL divergence between each distribution and the mean of the two: JS(pq ||pτ ) =
1 1 KL(pq ||pm ) + KL(pτ ||pm ) 2 2
where pm (w) = 21 pq (w) + 12 pτ (w). This quantity has the advantage that the vocabularies of the distributions don’t need to match and thus Laplace smoothing isn’t required. The Jensen Shannon divergence for the URLs in our dataset is shown in Figure 6. We see that the uniform distribution line lies well above the others indicating that the queries and terms are similar. We note here that removing low frequency terms and/or selecting only the highest frequency terms has a small positive effect on similarity. Since the JS divergence is symmetric (and thereby the most practical) we use it in Figure 7 to compare different Dmoz categories to see if website topic has an effect on query/tag
similarity. As was the case when investigating vocabulary overlap, there doesn’t appear to be any noticeable change in the distribution of similarity values with the topic.
4.3
Does similarity depend on popularity?
We investigated whether the similarity between tags and queries was dependent on the popularity of the URL in the tag or query log. This is an important question, because if the similarity is correlated, it could mean that our results in this paper do not generalize to other less popular URLs in the logs. In order to allow for a fair comparison between URLs with different popularity values and hence different samples sizes, we first created equally sized samples6 for each URL, by sampling queries and tags without replacement from our dataset for each URL. Figure 8 shows a plot of bookmark popularity versus Jensen-Shannon divergence. We see that there doesn’t appear to be any clear relationship between bookmark popularity and similarity (Pearson’s r = 0.10). The same was found for popularity in the query log (Pearson’s r = 0.13). The fact that we found no rela6
Sample sizes of 200, 500 and 1000 gave consistent results.
Test all terms remove singletons top 20 terms total URLs
tionship between popularity and similarity does not guarantee that our results in this paper generalize to less frequent URLs, but it suggests that they could.
5.
COULD THEY BE IDENTICAL?
Likelihood Ratio 170 (4.1%) 9 (0.2%) 3 (0.1%) 4145 (100%)
MDL 0 (0.0%) 0 (0.0%) 0 (0.0%) 4145 (100%)
In Section 4 we established that the tag and query distributions share a large amount of vocabulary and are correlated with one another. We now want to see whether the examples we have for each distribution could be considered two samples from the same underlying probability distribution. We introduce two statistical tests to determine if and under what conditions the query and tag distributions could be considered the same in the sense that they are indistinguishable from one another.
Table 2: Results of the Log Likelihood Ratio and Minimum Description Length tests. The first column contains the counts of URLs for which the Likelihood Ratio test could not reject the hypothesis (p ≤ 0.01%) that the distributions are the same. The second counts cases where the MDL assigned the combined distributions a shorter code length.
5.1
The test was able to reject the null hypothesis that the two samples came from the same underlying distribution for all but 4% of the URLs when considering all terms. The number of non rejections decreased when low frequency terms were removed from the distributions.
The Likelihood Ratio Test
We can quantify the difference between the tag and query distributions in terms of a model selection problem. In this framework we ask the question, how likely is it that the observed sequence of query terms and tag terms were generated by different underlying term distributions as opposed to the same underlying distribution. In other words, we are going to test the hypothesis H1 : pq 6= pτ against the null hypothesis: H0 : pq = pτ . The log-likelihood ratio is given then by: « „ L([q1 , ..., qn ], [τ1 , ..., τm ]|H0 ) LR(url) = −2 log L([q1 , ..., qn ], [τ1 , ..., τm ]|H1 ) where [q1 , ..., qn ] is the observed sequence of query terms (we ignore boundaries between queries in our analysis) and [τ1 , ..., τm ] is the observed sequence of tag terms. We will now use pqτ to denote the Maximum Likelihood estimate for the term distribution generating the combined sequence [q1 , ..., qn , τ1 , ..., τm ], i.e.: pqτ (w|url) = P
tfq (w) + tfτ (w) tfq (w) + tfτ (w)
w∈V
where V = Vq ∪ Vτ . The hypotheses can then be replaced in our formula for the log likelihood ratio: « „ L([q1 , ..., qn ]|pq )L([τ1 , ..., τm ]|pτ ) LR(url) = 2 log L([q1 , ..., qn ]|pqτ )L([τ1 , ..., τm ]|pqτ ) If we assume that the order of terms in the respective logs is not important, (only their relative frequency is important), then we can calculate the likelihood values as follows: LR(url) = 2 log
Y pq (w)tfq (w) · pτ (w)tfτ (w) pqτ (w)tfq (w) · pqτ (w)tfτ (w) w∈V
which can be rewritten as:7 « X„ pq (w) pτ (w) LR(url) = 2 tfq (w) log + tfτ (w) log pqτ (w) pqτ (w) w∈V The log likelihood ratio as defined above follows a χ2 distribution with |V | − 1 degrees of freedom [10], so we can use it to calculate a confidence value for rejecting the null hypothesis, (that the query and tag samples come from the same distribution). We ran the analysis using a confidence threshold of p = 0.01% and the results are shown in Table 2. 7
Note that if the samples of query and tag terms are of the same size (i.e. m = n), then the log likelihood ratio above is simply 4n times the Jensen-Shannon divergence.
5.2
Minimum Description Length
Another approach to quantify if two sequences of words come from the same distribution is to apply a test based on the Minimum Description Length (MDL) principle[5]. The principle states that the best model of the process that generates an observed sequence is the one that gives the shortest description of the sequence, where the model itself is also a part of the description. In our case the principle can be written as: M DL(url) = min{DL([q1 , ..., qn ]) + DL([τ1 , ..., τm ]) + P, DL([q1 , ..., qn , τ1 , ..., τm ])} where DL(s) is the minimum description length of sequence s and P is the penalty for separating the sequences, which is actually the cost of encoding the location of the separating point in the combined sequence length, i.e. P = log2 (n+m). In order to calculate the description length of a sequence, we use the Krichevsky-Trofimov (KT) code length [8]. DL(s) = − log2 (KT (s)) where KT (s) is a marginal likelihood of the sequence s using a uniform Dirichlet prior. It can be calculated as follows [12]: Q Qtfs (w) (i − 12 ) w∈V i=1 KT (s) = Q|s|s |Vs | i=1 (i − 1 + 2 ) where |s| is the length of the sequence. We performed this MDL-based test on the URLs in our collection with the results shown in Table 2. The MDL test didn’t find any URLs for which it thought that the combined sequence was likely to have come from the same distribution. The fact that the MDL test is more restrictive than the Likelihood Ratio test makes sense since the MDL is not calculating whether it is possible that two samples come from the same distribution, but rather whether it is more likely that the sequences are the same or not.
6.
INVESTIGATING WEBSITE CONTENT
Having analyzed the similarity between tag and query distributions, we now turn our attention to the other term distribution normally at the heart of Information Retrieval, namely the content of the documents themselves. Our aim
Relative Overlap (tags, queries, content)
JS divergence (tags, queries, content) content
queries
tags
content
Figure 9: Ternary plot of relative vocabulary overlap between query, tag and content distributions. Points toward the top of the graph indicate large vocabulary overlap between queries and tags. Points toward the bottom left indicate large overlap between query and content vocabularies and so on.
is to answer two questions: Firstly, which of the term distributions, tag or query, is closer to the content of the bookmarked/clicked document? Secondly, are the tag and query distributions more or less similar to each other than they are to the content? In order to assess similarity we use two measures introduced in Section 4, namely the vocabulary overlap and the Jensen-Shannon divergence, and introduce a three-way graph called a ternary (triangular) plot. Figure 9 shows such a plot. For each data point, the perpendicular distance to the side of the triangle is proportional to the similarity between the two distributions that meet at the opposite vertex. In other words, the closer the point is to a corner, the more similar the distributions. For example, the closer a point is to the top of the graph, the more similar the query and tag distributions, and the closer the point is to the bottom right corner of the graph, the more similar the content and tag distributions. Similarity in this plot is measured in terms of vocabulary overlap. We can see from the graph that the queries and content distributions tend to share more vocabulary than the tags and queries. Tags and content seem to exhibit the least amount of vocabulary overlap in our dataset. The reason for this is probably due to the querying process itself: In order to click on a web page, the page must have appeared in the result set and hence the user is likely to have entered some keywords from the content of the document itself, while taggers are less inclined to annotate a page with a term that is contained in it. Figure 10 shows a ternary plot of the Jensen-Shannon divergence. In this case since the divergence measures dissimilarity between distributions, the distribution names are now placed at the corners of the plot. The data points for this graph are concentrated together toward the bottom of the triangle, indicating that the tag and query distributions are more similar to each other than they are to the content. We investigate whether the topic of the website has any noticeable affect on the relative similarity of the different dis-
tags
queries
Figure 10: Ternary plot of relative Jensen-Shannon divergence between query, tag and content distributions. tributions. Figure 11 shows two frequent Dmoz categories8 . It doesn’t appear that the is any way to differentiate between categories based on the relative similarity values. Finally, we briefly investigated whether tag data could be used to smooth a document Language Model (LM) for Information Retrieval (IR). In the LM approach to IR, the KL divergence between a query and a smoothed document content model is sometimes used as a retrieval function for ranking documents. The document model is usually smoothed (using Linear Interpolation or Dirichlet smoothing) with a collection model generated from the entire corpus of documents. For our experiment we used unigram counts from the Google ngram dataset9 to calculate a collection model. We used the collection model to smooth the content distribution for each URL, using mixture (Linear Interpolation) or Dirichlet smoothing, and optimizing parameter settings to minimize KL divergence between the query and the smoothed content model over all the URLs in the dataset. Figure 12 shows these plots. We then introduced the tag distribution into the smoothed content model, calculating the mixture pˆ = λ1 pτ + λ2 pc + λ3 pcol and optimizing for parameter values λi . The low divergence values in the graph indicate that tag data may indeed be useful for smoothing content models for IR.
7.
CONCLUSIONS
We have investigated the similarity between query term distributions and tag distributions for the same clicked/bookmarked URL. We have shown that the vocabularies contain a large amount of overlap and that the term frequency distributions are correlated. We have also found that the similarity between tags and queries does not seem to be dependent on the topic area - at least at the level of granularity provided by the top-level Dmoz categories. We have performed two different statistical tests that indicate that, 8
Other pairs of Dmoz categories showed similar results. http://www.ldc.upenn.edu/Catalog/CatalogEntry. jsp?catalogId=LDC2006T13 9
Kullback-Leibler Divergence: queries vs smoothed distributions
Relative Overlap (tags, queries, content) with 2 Dmoz Categories
10
mixture(content,background) dirichlet(content,background) mixture(tags,content,background)
9 8
Reference Shopping KL(query||?)
7
queries
tags
6 5 4 3 2 1 0
0
500
1000
1500
2000
2500
3000
3500
4000
URLs ordered by divergence
content
Figure 11: Ternary plot of relative vocabulary overlap for two Dmoz categories. while similar, the samples do not come from the same underlying distribution. We have compared the tag/query term distributions with term distributions describing the content of the URLs in our sample. Our analysis indicates that in terms of vocabulary overlap, queries are more similar to content than to tags, but in terms of frequency distributions, queries and tags are more similar to one another than to content. Finally, we have shown that tag data may be useful for smoothing document content models with the aim of improving document retrieval performance. Our results are of great importance to research in improving Web Search by incorporating additional forms of evidence such as that inferred from tag data. Future work involves developing models for automatically removing noise from the tag and query logs, developing techniques for predicting useful tags from query distributions and vice-versa, and developing techniques for the effective use of tag data to improve different forms of Web Search. Acknowledgments: This research was supported by the Hasler Foundation via the ADIR+ project and the EPSRC under grant number EP/F060475/1.
8.
Figure 12: Kullback-Leibler divergence between the query distribution and various smoothed content distributions. Smoothing is performed using a collection model. Including tag data reduces divergence for the language model.
[5]
[6]
[7]
[8]
[9]
REFERENCES
[1] S. Bao, G. Xue, X. Wu, Y. Yu, B. Fei, and Z. Su. Optimizing web search using social annotations. In WWW ’07: Proceedings of the 16th international conference on World Wide Web, pages 501–510, 2007. [2] S. M. Beitzel, E. C. Jensen, A. Chowdhury, O. Frieder, and D. Grossman. Temporal analysis of a very large topically categorized web query log. Journal of the American Society for Information Science and Technology, 58(2):166–178, 2007. [3] Z. Dou, R. Song, and J.-R. Wen. A large-scale evaluation and analysis of personalized search strategies. In WWW ’07: Proceedings of the 16th international conference on World Wide Web, 2007. [4] G. W. Furnas, T. K. Landauer, L. M. Gomez, and
[10]
[11]
[12] [13]
S. T. Dumais. Statistical semantics: analysis of the potential performance of keyword information systems. In Human factors in computer systems, 1984. R. Gwadera, A. Gionis, and H. Mannila. Optimal segmentation using tree models. In ICDM’06: Proceedings of the Sixth International Conference on Data Mining, 2006. P. Heymann, G. Koutrika, and H. Garcia-Molina. Can social bookmarks improve web search? In WSDM ’08: Proceedings of the First ACM International Conference on Web Search and Data Mining, 2008. T. Joachims. Optimizing search engines using clickthrough data. In KDD ’02: Proceedings of the eighth ACM SIGKDD international conference on Knowledge discovery and data mining, 2002. R. Krichevsky and V. Trofimov. The performance of universal encoding. IEEE Transactions on Information Theory, 27(2):199–207, 1981. M. Li, Y. Zhang, M. Zhu, and M. Zhou. Exploring distributional similarity based models for query spelling correction. In ACL ’06: Proceedings of the 21st International Conference on Computational Linguistics and the 44th annual meeting of the ACL, pages 1025–1032, 2006. C. D. Manning and H. Sch¨ utze. Foundations of Statistical Natural Language Processing. The MIT Press, Cambridge, Massachusetts, 1999. G. Pass, A. Chowdhury, and C. Torgeson. A picture of search. In InfoScale ’06: Proceedings of the 1st international conference on Scalable information systems, page 1, 2006. Z. Talata. Model selection via information criteria. Periodica Mathematica Hungarica, 51:99–117, 2005. Y. Yanbe, A. Jatowt, S. Nakamura, and K. Tanaka. Can social bookmarking enhance search in the web? In JCDL ’07: Proceedings of the 2007 conference on Digital libraries, pages 107–116. ACM, 2007.