A structural approach to distance rendering in personal auditory displays Federico Fontana, Davide Rocchesso and Laura Ottaviani University of Verona Dipartimento di Informatica 14 strada Le Grazie, 37134 Verona - Italy
[email protected],
[email protected],
[email protected]
Abstract A virtual resonating environment aiming at enhancing our perception of distance is proposed. This environment reproduces the acoustics inside a tube, thus conveying peculiar distance cues to the listener. The corresponding resonator has been prototyped using a wave-based numerical scheme called Waveguide Mesh, that gave the necessary versatility to the model during the design and parameterization of the listening environment. Psychophysical tests show that this virtual environment conveys robust distance cues.
1
Introduction
Humans use several senses simultaneously to explore and experience the environment. On the other hand, technological or human limitations often prevent computer-based systems from providing genuine multimodal displays. Fortunately, the redundancy of our sensory system can be exploited in order to choose, depending on cost and practical constraints, the display that is the most convenient for a given application. Providing access to information by means of audio signals played through headphones or loudspeakers is very attractive, especially because they can elicit a high sense of engagement with inexpensive hardware peripherals. Namely, one may be tempted to transfer spatial information from the visual to the auditory channel, with the expected benefits of enlarging the perceptual bandwidth and lowering the load for the visual channel. However, we should bear in mind that vision and hearing play fundamental but different roles in human perception. In particular, space is not considered to be an “indispensable attribute” of perceived sounds [1]. In audio-visual displays, the effectiveness of communication can be maximized if the visual channel is mainly devoted to spatial (end environmental) information, while the
auditory channel is mainly devoted to temporal (end eventbased) information. However, there are several situations where the spatial attributes of sound becomes crucial: 1. In auditory warnings, where sounds are used to steer the visual attention; 2. Where it is important to perceive events produced by objects that are visually occluded or out of the visual angle; 3. For visually impaired users, where visual information is insufficient or absent. Furthermore, if the “soundscape” of events being conveyed via the auditory channel is particularly rich, the spatial dislocation of sound sources certainly helps the tasks of separation and understanding of events, streams, and textures. Much research has been dedicated to spatial auditory displays, with special emphasis on directional cues [2], but the literature on the perception and synthesis of the range of sources is quite limited [3, 4, 5]. What most psychoacoustic studies have found in this field is that we significantly underestimate the distance of sources farther than a couple of meters from the subject. The acoustic cues accounting for distance are mainly monaural: 1. Intensity plays a major role, especially with familiar sounds in open space. In the ideal case, intensity in the open space decreases by 6 dB for each doubling of the distance between source and listener [6]. 2. Direct-to-reverberant energy ratio affects perception in closed spaces or reverberant outdoor environments. The reverberant energy comes from subsequent reflections of the direct sound, each of them having amplitude and time delay that vary with the characteristics of the enclosure, and with the source and listener’s positions.
3. Spectrum conveys distance information as well, if the listener has enough familiarity with the original sound. In that case, spectral changes introduced in the direct signal by air loss and/or sound reflection over non-ideal surfaces can be detected by the listener, and hence reconducted to distance information [7]. Also, the existence of binaural cues has been demonstrated, these cues being particularly important in the case of nearby sources [8]. Among the monaural cues, the third could be exploited to display very large distances, because the spectral cues are relevant only for long paths. The first cue is not very useful in auditory displays and sonification, because it imposes restrictions to the listening level and it may lead to annoying soundscapes. The second monaural cue can be exploited to synthesize spatial auditory displays of virtual sources in the range of about ten meters. In order to do that, we have to use artificial reverberators to add reverberant energies to sounds. The effects of the environment characteristics over sound are difficult to model and highly context-dependent. Moreover, the psychophysical process that maps the acoustics of a reverberant enclosure to the listener’s impressions of that enclosure is still partially unknown [9]. For this reason, artificial reverberators are typically the result of a perceptual design approach [10], which has the fundamental advantage of leading to affordable architectures working in real-time, and has resulted in several state-of-the art realizations, providing high-quality rendering of reverberant environments [11]. Nevertheless, most of these realization do not deal with distance rendering of the sound source. On the contrary, the structural design philosophy focuses on models whose properties have a direct counterpart in the structural properties that must be rendered, such as the geometry of an enclosure or the materials the wall surfaces are made of. Thanks to that approach, their driving parameters translate into correspondent model behaviors directly. Unfortunately, structural models resulted to be either too resource-consuming, or, when simplified to accommodate the hardware requirements (i.e., the real-time constraint), excessively poor in the quality of the audio results. The emerging auditory display field shifts the focus on the usability of the auditory interface rather than on the audio quality per se. For the purpose of enhancing the effectiveness of display, it is often useful to exaggerate some aspects of synthetic sounds. In spatial audio, this has led to the proposal of systems for supernormal auditory localization [12]. In this paper, we extend this concept to range localization of virtual sound sources. We use the structural approach to reverberation to design a virtual resonator that enhance our perception of distance. As a simple experience, consider a child playing inside one of those tubes that are found in kindergartens. If we listen to the child by staying at
4.75 6.71 0.84 1.68 2.37 3.36 0.59 0.42 1.19
9.5
S 9.5 0.45 0.45
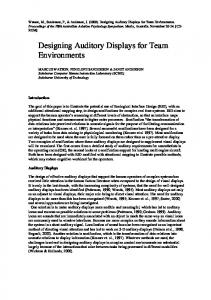
Figure 1: The listening environment. All sizes in meters. one edge of the tube, we have the feeling that she is located somewhere within the tube, but the apparent position turns out to be heavily affected by the acoustics of the tube. Using a virtual acoustic tool, we experimented with several tube sizes and configurations, until we found a virtual tube that seems to be effective for distance rendering. In a personal auditory display [5], where the user wears headphones and hears virtual as well as actual sound sources, these tubes will be oriented in space by means of conventional 3D audio techniques [2], so that the virtual sound sources may be thought to be embedded within virtual acoustic beams departing from the user’s head. This paper is organized in the following way: first, we propose an ideal listening environment where “augmented” distance cues can be conveniently conveyed to a listener. Then, we turn this ideal environment into a structure-based sound processing model, that requires very simple and direct parameterization. Finally, the performance of the model is evaluated through a listening test where subjects use headphones, in order to assess the suitability of the proposed model in personal auditory displays.
2 Acoustics inside a tube The listening environment we will consider is the interior of a square cavity having the aspect of a long tube, sized 9.5×0.45×0.45 meters. The internal surfaces of the tube are modeled to exhibit natural absorption properties against the incident sound pressure waves. The surfaces located at the two edges are modeled to behave as total absorbers (see Fig. 1) [13]. A careful investigation on the physical properties of this acoustic system, although not excessively complicated, is beyond the scope of this paper. The resonating properties of cavities having similar geometrical and absorbing characteristics (for example organ pipes) have been previously investigated by researchers in acoustics [14]. It seems reasonable that, although quite artificial, this lis-
tening context conveys sounds that acquire noticeable spatial cues during their path from the source to the listener. Given the peculiar geometry of the resonator, these cues should mainly account for distance. The edge surfaces have been set to be totally absorbent in order to avoid echoes originating from subsequent reflections of the wavefronts along the main direction of wave propagation. In fact, these echoes turned out to be ineffective for distance recognition in the range specified by the tube size, and would also originate a side-effect annoying for the listener. Summarizing, we have designed a resonating environment that is structurally simple, meanwhile it deals with an interesting range of the physical quantity we aim at rendering. In this environment, we put a sound source at one end of the tube (labeled with S in Fig. 1) along the main axis. Starting from the other end, we move a listening point along 10 positions x10 , . . . , x1 over the main axis, in such a way that, for each √ step, the source/listener distance is reduced by a factor 2. Finally the following set X of distances expressed in meters comes out, as shown also by Fig. 1: X = {xi , i = 1, . . . , 10} = (1) {0.42, 0.59, 0.84, 1.19, 1.68, 2.37, 3.36, 4.75, 6.71, 9.5} An obvious question arise prior to any investigation on distance rendering: why can’t we render distance in an auditory display by simply changing the loudness of sounds as a function of their distance from the listener? The answer is twofold: • Distance recognition by loudness is as more effective, as more familiar the sound source is. Conversely, a resonator, once become familiar to the listener, adds unique “footprints” to the sound emitted by the source, so that the listener has more chances to perform a recognition of distance also in the case of unfamiliar sounds. • As introduced above, loudness in open spaces follows a 6 dB law for each doubling of the distance. This means that a wide dynamic range is required for recreating interesting distance ranges in virtual simulations of open spaces. This requirement, apart from inherent technical complications coming from guaranteeing it at the hardware level, might conflict with the user’s need of hearing other events (possibly loud) in the display. These events would easily mask farther virtual sound sources, especially in the case when the auditory display is designed to work with open headphones or ear-phones [15]. In other words, distance rendering is as more effective as smoother the steepness of the loudness-to-distance law is, due to both technical and perceptual reasons. Summarizing, the proposed environment should lead to a robust rendering also with respect to unfamiliar sounds,
1 2
3 B(z) 5
6 4 z
P− P+
x y
Figure 2: Particular of a volume section. The lossless scattering junction in the center is connected to other junctions via waveguides 2, 3, 4, and 6. Waveguide 1 leads to a totally absorbing section of wall. Waveguide 5 leads to a partially absorbing section of wall, modeled using a waveguide filter. The triangles filled with black represent oriented unit delays. and to a broad perceived range obtained by a compressed loudness-to-distance law.
3
Modeling the listening environment
The square tube has been modeled by means of finitedifference schemes. Since these schemes provide a discretespace and time formulation of the fundamental partial differential equation accounting for three-dimensional wave propagation of pressure waves along an ideal medium [16], they clearly devise a structural approach to the problem of modeling a reverberant environment. Their ease of control is a key feature for this research, that came useful especially during the preliminary informal listening of several tubular environments differing in size, shape and absorption properties. In particular, a wave-based formulation of the finitedifference scheme has been used, known as the Waveguide Mesh, that makes use of the wave decomposition of a pressure signal p into its wave components p+ and p− , such that p = p+ + p− [17]. By adopting this formulation the spatial domain is discretized in space into equal cubic volume sections, and each of them is modeled as a lossless junction of ideal waveguides, scattering 6 input wave pressure sig+ nals coming from orthogonal directions, p+ 1 , . . . , p6 , into − − corresponding output waves, p1 , . . . , p6 , going to opposite directions, respectively (see also Fig. 2). It can be shown that, given the length dW of each waveguide, pressure waves travel along the Waveguide Mesh at a speed equal to 1 (2) cW ≤ √ dW Fs 3
40
20
0 averaged magnitude (dB)
30
magnitude (dB)
5
1R 1L 10R 10L
10 0 −10 −20
−10 −15 −20 −25
−30 −40 0
−5
1000
2000 frequency (Hz)
3000
−30
4000
Figure 3: Magnitude spectra of signals 1R, 1L, 10R, 10L, ordered by decreasing magnitude. where Fs is the sampling frequency, and the symbol < means that some spatial frequencies travel slower along the mesh. This effect is called dispersion [16], whose main effect is a detuning of high frequencies, which is not considered to be important for the application. Assuming the velocity of sound in air equal to 343 m/s, and setting Fs = 8 kHz, we have from (2) that each waveguide is about 74.3 mm long. Thus, the mesh needs 127 × 5 × 5 = 3175 scattering nodes to model our tube. Note that the sampling frequency has important effects on the computational requirement of the model. Clearly, our choice is oriented to efficiency rather than sound realism: reliable distance cues should be conveyed also using lower sampling frequencies. The Waveguide Mesh has already been used in the simulation of reverberant enclosures [18]. It has a major advantage in this application case, since it allows to deal with the boundary of the propagation domain quite effectively [19]. In fact, it enables to apply waveguide filters at the mesh boundary, that model the reflection properties of the internal surfaces of the tube [20]. More in detail, each waveguide branch falling beyond the boundary of the tube is terminated with a spring/damper system, that models a simplified resonating/absorption property of the surface at the waveguide termination. This system is algebraically rearranged into a Waveguide filter, then discretized into a Waveguide Digital filter establishing a transfer function, B(z), between pressure waves going out from, and incoming to the closest scattering junction: B(z) =
Pi+ (z) . Pi− (z)
(3)
For example, it is i = 5 in Fig. 2. Using the simple physical system seen above, the resulting filter terminations are made of 1st-order pole-zero filters. Despite this simplicity, these
RIGHT AVG LEFT 1
3 distance (m)
10
Figure 4: Averaged magnitudes of all acquired signals as a function of distance, together with magnitude values in the ideal open-space case. Above: right channel. Below: left channel. Middle: average between left and right channels. filters can be tuned to approach the reflecting properties of real absorbing walls [13]. Considering that the surfaces at the two terminations of the tube have been set to be totally absorbing (this meaning that p+ ≡ 0), the total number of boundary filters is 127 × 5 × 4 = 2540.
4
Model performance and chophysical evaluation
psy-
Ten stereophonic impulse responses have been acquired from the tube model along positions x1 , . . . , x10 . The right channel accounts for acquisition points exactly standing on the main axis (refer to Fig. 1), whereas the left channel accounts for points displaced two junctions far from that axis, this corresponding to an interaural distance of about 15 cm. We then convolved these responses with a monophonic, short anechoic sample of a cowbell sound, and labeled the resulting 20 sounds according to the indexes and channels of the respective impulse responses: 1R,...,10R and 1L,...,10L. Measures conducted on those sounds are summarized in Fig. 3 and Fig. 4. Fig. 3 shows spectral differences existing between sounds auditioned nearby and far from the sound source, both for the left and right channel. Fig. 4 shows how the P signals average magnitudes, defined by the value 10 log n1 n [s(n)]2 where s is the signal to be studied, and referenced to 0 in correspondence of the the closest position, vary with distance: These variations show that a dynamic range smaller than the 6 dB law is needed for rendering distances using the proposed method. In particular, Fig. 4 shows that the right-channel magni-
10 3 1 a = 0.86599 b = 0.47426
Perceived d. (m)
1
Perceived d. (m)
3
1
3
a = 0.70041 b = 0.85288
10
1
3
10 3 1
1
3
a = 0.51661 b = 0.37681 10
3
10
a = 0.57376 b = 0.91256
10
10 3 1
1 3 Distance (m)
1
a = 0.2454 b = 0.64866
10
10
10 3 1
a = 0.47895 b = 0.42876 3
3
a = 0.55139 b = 0.41365
10
10 3 1
1
1 10 3 1
a = 0.16481 b = 0.71879
10 3 1
a = 0.35025 b = 0.39286
10
10 3 1
3
10
a = 0.13936 b = 0.93615
10
10 3 1
1
Perceived d. (m)
10 3 1
1
3
a = 0.46119 b = 0.53244 10
3
a = 0.46487 b = 0.60935
1
10
1
10 3 1
1 3 Distance (m)
Perceived distance (m)
Perceived d. (m)
10 3 1
3 Distance (m)
10
a = 0.53037 b = 0.62434 1 3 Distance (m)
10
Figure 5: Individual distance evaluations together with individual linear regression lines. a: intercept. b: slope.
tudes diverge from the left ones, as long as the range becomes greater than about 1 m. This divergence does not appear in reverberant sounds taken from real-world environments. This effect can be certainly reconducted to the peculiarity of the listening environment proposed here. Nevertheless, a careful analysis of the side-effects coming from using a coarse-grained realization of the Waveguide Mesh as a model of the listening environment should be carried out, to assess the precision of the plots depicted in Fig. 4. We conducted also an experiment using the magnitude estimation method without modulus, to investigate how subjects scaled the perceived distance [21]. We asked 12 volunteers (4 females and 8 males, with age between 22 and 40), to estimate the distance from the 10 stereophonic sounds synthesized using the technique above. The experiment was executed in normal background noise conditions. The setup involved a PC, a Creative SoundBlaster audio card and Beyerdynamic DT 770 closed Hi-Fi headphones. The set of sounds was repeated 3 times, for a total of 30 stimuli randomly distributed. Each subject had to associate the first stimulus with a distance, in meters, without prior training. Then, she evaluated the other stimuli proportionally to the first estimation. Since we did not set a modulus, the estimations define scales that depend on the individual listeners’ judgments. These scales range from 0.2-8 (subject no. 8) to 1-30 (subject no. 5). The three judgments given for each sound were then geometrically averaged for each subject, and the resulting values were used to calculate a mean average. Subtracting it from the individual averages, we adjusted the listeners’ judgments to obtain a common logarithmic reference scaling [22].
Figure 6: Average distance evaluation together with linear regression line. a: intercept. b: slope. In Fig. 5 the distance evaluations as functions of the source/listener distance are plotted for each subject, together with the corresponding linear functions obtained by linear regression. The average slope is 0.6093 (standard deviation 0.2062), while the average intercept is 0.4649 (standard deviation 0.2132). In Fig. 6 the perceived distance averaged across values is plotted as function of the source/listener distance, together with the relative regression line (r2 = 0.7636, F (1, 8) = 25.8385, Fcrit (1, 8) = 11.2586, α = 0.01). The r2 coefficient is significant at α = 0.01 and, therefore, the regression line fits well with the subjects’ evaluations. We observe that subjects overestimate the distance for sound sources that are closer to the listener. This overestimation tends to decrease as long as the distance increases. These results partially conflict with the conclusions of other studies, where distance perception was carefully assessed using sounds resulting from impulse responses captured from the real world [4]. Those studies have concluded that, under normal listening conditions, humans tend to overestimate the distance of nearby sources and, conversely, underestimate the range of sound sources that are far from the listener. The point of correct estimation occurs at about 11.5 meters. One explanation for the results obtained here can be found in the exaggeration of the reverberant energy that is produced by the peculiar listening environment we adopted, which seems to offset the listeners’ evaluation toward higher ranges. Indeed, this exaggeration may help to set up an auditory display where sounds in the far-field must be reliably reproduced. An important remark is that in general subjects did not complained about the lack of externalization in the stimuli, even though the experiment was conducted without any binaural spatialization tool [2], and using regular headphones
rather than special equipment [15]. Only one subject (a graduating student who is not novice in the field) attributed a null distance to the stereophonic sound (1L,1R) in two of the three judgments, later reporting on some in-head localization of those two samples. Therefore, we conclude that the impression of distance can be rendered quite effectively and economically just by proper design of a reverberating environment.
5
Conclusion
We have proposed a virtual listening environment that is certainly capable of enhancing our perception of distance, and a versatile way to model it. Although listening tests show that in the actual realization it conveys exaggerated range cues, the possibility to parameterize the model easily makes this virtual environment interesting for the design of auditory displays, where information must be conveyed.
6
Acknowledgments
[7] J. Blauert, Spatial Hearing: the Psychophysics of Human Sound Localization, MIT Press, Cambridge, MA, 1983. [8] D. S. Brungart, N. I. Durlach, and W. M. Rabinowitz, “Auditory localization of nearby sources. ii. localization of a broadband source,” Journal of the Acoustical Society of America, vol. 106, pp. 1956–1968, 1999. [9] L. L. Beranek, “Concert hall acoustics - 1992,” Journal of the Acoustical Society of America, vol. 92, no. 1, pp. 1–39, July 1992. [10] W. G. Gardner, “Reverberation algorithms,” in Applications of Digital Signal Processing to Audio and Acoustics, M. Kahrs and K. Brandenburg, Eds., pp. 85–131. Kluwer Academic Publishers, Dordrecht, The Netherlands, 1998. [11] J.-M. Jot, “An analysis/synthesis approach to real-time artificial reverberation,” in Proc. Int. Conf. on Acoustics, Speech, and Signal Processing, San Francisco, CA, 1992, IEEE. [12] N. I. Durlach, B. G. Shinn-Cunningham, and R. M. Held, “Supernormal auditory localization. i. general background,” Presence: Teleoperators and Virtual Environments, vol. 2, no. 2, pp. 89–103, 1993. [13] H. Kuttruff, Room Acoustics, Elsevier Science, Essex, England, 1991, Third Ed.; First Ed. 1973.
Federico Beghini and Fabio Deboni, students in our Department, have collaborated in the design and informal evaluation of preliminary virtual listening environments during their graduation thesis activity. The Authors would also thank the volunteers who participated to the listening test. Partial support has been given by the EU IST Project SOb - The Sounding Object (IST-2000-25287)
[14] N. H. Fletcher and T. D. Rossing, The Physics of Musical Instruments, Springer-Verlag, New York, 1991.
References
[17] S. A. Van Duyne and J. O. Smith, “Physical modeling with the 2-D digital waveguide mesh,” in Proc. Int. Computer Music Conf., Tokyo, Japan, 1993, ICMA, pp. 40–47.
[1] M. Kubovy and D. Van Valkenburg, “Auditory and visual objects,” Cognition, vol. 80, pp. 97–126, 2001. [2] D. Rocchesso, “Spatial effects,” in DAFX: Digital Audio Effects, U. Z¨olzer, Ed., pp. 137–200. John Wiley and Sons, Inc., New York, 2002. [3] J. M. Loomis, R. L. Klatzky, and R. G. Golledge, “Auditory distance perception in real, virtual, and mixed environments,” in Mixed Reality: Merging Real and Virtual Worlds, Y. Ohta and H. Tamura, Eds., pp. 201–214. Ohmsha, Ltd., Tokio (Japan), 1999. [4] P. Zahorik, “Assessing auditory distance perception using virtual acoustics,” Journal of the Acoustical Society of America, vol. 111, no. 4, pp. 1832–1846, 2002. [5] W. L. Martens, “Psychophysical calibration for controlling the range of a virtual sound source: Multidimensional complexity in spatial auditory display,” in Proc. International Conference on Auditory Display, Espoo - Finland, Aug. 2001, pp. 197–207. [6] P. M. Morse and K. U. Ingard, Theoretical Acoustics, McGraw-Hill, New York, 1968, Reprinted in 1986, Princeton Univ. Press, Princeton, NJ.
[15] A. Kulkarni and H. S. Colburn, “Role of spectral detail in sound-source localization,” Nature, vol. 396, pp. 747–749, Dec. 1998. [16] J. Strikwerda, Finite Difference Schemes and Partial Differential Equations, Wadsworth & Brooks, Pacific Grove, CA, 1989.
[18] L. Savioja, J. Backman, A. J¨arvinen, and T. Takala, “Waveguide mesh method for low-frequency simulation of room acoustics,” in Proc. 15th Int. Conf. on Acoustics (ICA-95), June 1995, pp. 637–640. [19] S. A. Van Duyne and J. O. Smith, “A simplified approach to modeling dispersion caused by stiffness in strings and plates,” in Proc. Int. Computer Music Conf., Aarhus, Denmark, Sept. 1994, ICMA, pp. 407–410. [20] J. Huopaniemi, L. Savioja, and M. Karjalainen, “Modeling of reflections and air absorption in acoustical spaces: a digital filter design approach,” in Proc. IEEE Workshop on Applications of Signal Processing to Audio and Acoustics, New Paltz (NY), Oct. 1997, IEEE, pp. 19–22. [21] S. S. Stevens, “The direct estimation of sensory magnitudeloudness,” American Journal of Psychology, vol. 69, pp. 1– 25, 1956. [22] T. Engen, “Psychophysics. i. discrimination and detection. ii. scaling,” in Woodworth & Schlosberg’s Experimental Psychology, J. K. Kling and L. A. Riggs, Eds., pp. 11–86. Methuen, London, 3rd edition, 1971.