synthesis technique based on Fourier transform [14]. ..... The power spectral density (PSD) function, also referred to as a power .... data in an object file format.
A Study on Efficient Algorithms for Generating Virtual Wind Field Usable for Real-time Animation
Khorloo Oyundolgor
A thesis submitted for the degree of Doctor of Philosophy
Department of Design and Media Technology Graduate School of Engineering Iwate University
March 2012
Abstract We all experience the wind from our everyday life. Wind is invisible. It has no shape, size, smell, taste or sound of its own. Thus, it is the most challenging natural phenomenon to predict accurately. In the field of computer animation, wind is an important element for creating visually plausible motion in natural outdoor scenery. Examples of such motions include the swaying of tree branches in the wind, field of grass blowing in the breeze, the swirling of smoke, the waving of a flag, the flattering of cloth in the wind, etc. Without a turbulent wind field, animations would lack a natural chaotic look, which is an important characteristic of most natural phenomena. A series of natural wind models have been developed since the 1960s to facilitate the study of wind engineering problems. In this thesis, we present a study on wind turbulence models from the field of engineering and their applicability in computer animations for simulating a variety of motions and behaviors of flexible objects in windy conditions. At first, we describe some theoretical aspects of wind turbulence based on measurements of actual winds. Then we describe a simple yet visually convincing simulation of wind fields using our proposed wind models generated from actual wind data. The efficiency and practical utility of the wind field model is implemented in a simulation of grass blowing in the wind. Then, we also present a simple method to generate three-dimensional frozen and non-frozen turbulent wind fields for use in the animation of windinduced motion. Our approach uses 1/f β noise to match the characteristics of natural wind. By employing a noise-based approach, the complexity as well as computational cost is reduced. Additionally, by considering key characteristics of actual wind that are applied in the engineering field, our proposed method is also able to produce believable motion results in outdoor wind field simulations. In this thesis, we describe the implementation results of our i
proposed method and compare them with other existing approaches used to construct turbulent wind fields. The implementation and visualization are carried out for both two- and three-dimensional scenarios and compared with the results of other well-known methods. Finally, we present applications of noise-based non-frozen wind fields for animating flexible structures such as grass blades, cloth like objects, fire, etc.
ii
Acknowledgements This thesis would not have been possible without the support of many people. First of all, I would like to thank Prof. Norishige Chiba for introducing me to this wonderful field of Computer Graphics. This dissertation would not been possible without his guidance and support. Dr. Gunjee Zorig and Dr. Sosorbaram Batjargal deserve special thanks for their support and helpful discussions during the initial phase of the research. I am deeply indebted to Prof. Yuji Koui, Prof. Tadohiro Fujimoto, Prof. Kouichi Konno, all the past and present members of Chiba and Fujimoto CG Lab for their constructive comments and suggestions. I am also thankful to Mrs. Hikaru Kaketa for assistance with administrative work and to Mr. Norihiro Nasukawa for the computer related technical support. Finally, I would like to thank my parents Dashzeveg Khorloo and Lhamzav Baigalmaa, my husband Altantsetseg Enkhbayar for their love, encouragement and support.
iii
List of Publications Refereed Publications • Oyundolgor Khorloo, Zorig Gunjee, Batjargal Sosorbaram and Norishige Chiba. Wind Field Synthesis for Animating Wind-induced Vibration. The International Journal of Virtual Reality, 10(1), pp. 53–60, 2011. • Oyundolgor Khorloo, Zorig Gunjee, Batjargal Sosorbaram and Norishige Chiba. A Study on Wind Turbulence Models for Animating Flexible Objects. The Journal of the Society for Art and Science, 10(3), pp. 118–128, 2011.
Non-refereed Publications • Khorloo Oyundolgor, Sosorbaram Batjargal, Gunjee Zorig and Chiba Norishige. Fundamental study on wind models by experimental and theoretical approaches. Information Processing Society of Japan – Tohoku branch, Session 1, paper No. 2, Iwate University, December 2009. • Oyundolgor Khorloo, Zorig Gunjee, Batjargal Sosorbaram and Norishige Chiba. Fundamental Study on Wind Models for Animating Flexible Objects. In Proceedings of The 26th NICOGRAPH Paper Contest, Session 6, VI-2, Morioka, Japan, September 2010. • Gunjee Zorig, Khorloo Oyundolgor, Sosorbaram Batjargal and Chiba Norishige. Approximation Algorithms for Generating Wind Field Usable for Scenery Simulation. Information Processing Society of Japan
iv
– Tohoku branch, Session 6, paper No. 30, Iwate Universtiy, December 2010. • Oyundolgor Khorloo, Zorig Gunjee, Batjargal Sosorbaram and Norishige Chiba. Wind Field Synthesis for Animating Wind-induced Vibration. The 24th International Conference on CASA, China, May 2011. • Oyundolgor Khorloo and Norishige Chiba. An Application of Noisebased Wind Field Generalization for Animating Fire. The Society for Art and Science – Tohoku section, paper No. 23–01–05, Iwate University, November 2011.
v
Contents 1 Introduction
1
1.1
Motivation . . . . . . . . . . . . . . . . . . . . . . . . . . . . .
1
1.2 1.3
Prior works . . . . . . . . . . . . . . . . . . . . . . . . . . . . Methodology . . . . . . . . . . . . . . . . . . . . . . . . . . .
2 2
1.4
Objectives . . . . . . . . . . . . . . . . . . . . . . . . . . . . .
3
1.5
Contributions . . . . . . . . . . . . . . . . . . . . . . . . . . .
4
1.6
Thesis outline . . . . . . . . . . . . . . . . . . . . . . . . . . .
4
2 Noise Functions
6
2.1 2.2
Intuitive definition of noise . . . . . . . . . . . . . . . . . . . . 1/f β noise . . . . . . . . . . . . . . . . . . . . . . . . . . . .
8 8
2.3
Spectral densities for fBm and the spectral exponent β . . . .
10
2.4
Generation technique of 1/f β noise . . . . . . . . . . . . . . .
10
2.5 2.6
β
Higher dimensional 1/f noise . . . . . . . . . . . . . . . . . . 1/f β noise by example . . . . . . . . . . . . . . . . . . . . . .
3 The Nature of Wind
12 12 16
3.1
What is wind? . . . . . . . . . . . . . . . . . . . . . . . . . . .
16
3.2
The variable nature of wind . . . . . . . . . . . . . . . . . . .
16
3.3 3.4
Variation of wind speed with height . . . . . . . . . . . . . . . Turbulence of wind . . . . . . . . . . . . . . . . . . . . . . . .
17 18
3.5
Wind modeling . . . . . . . . . . . . . . . . . . . . . . . . . .
19
4 The General Form of Wind Modeling
23
4.1
Background . . . . . . . . . . . . . . . . . . . . . . . . . . . .
23
4.2
Measurements of wind speed . . . . . . . . . . . . . . . . . . .
24
vi
4.3
Analysis on measured data . . . . . . . . . . . . . . . . . . . .
26
4.4 4.5
General form of wind spectrum . . . . . . . . . . . . . . . . . The proposed method . . . . . . . . . . . . . . . . . . . . . .
26 28
4.5.1
Wind simulation . . . . . . . . . . . . . . . . . . . . .
28
4.5.2
Wind field construction . . . . . . . . . . . . . . . . . .
30
Animation of grass field . . . . . . . . . . . . . . . . . . . . . 4.6.1 Grass model . . . . . . . . . . . . . . . . . . . . . . . .
34 34
4.6.2
Grass animation . . . . . . . . . . . . . . . . . . . . . .
35
4.6.3
Performance results . . . . . . . . . . . . . . . . . . . .
37
4.6
5 Noise-based Non-frozen Wind Field Generation
41
5.1
Background . . . . . . . . . . . . . . . . . . . . . . . . . . . .
41
5.2 5.3
Characteristics of wind . . . . . . . . . . . . . . . . . . . . . . Wind field model . . . . . . . . . . . . . . . . . . . . . . . . .
42 44
5.3.1
Comparison with well-known approaches . . . . . . . .
44
5.3.2
Important steps in constructing the wind field . . . . .
45
Our approach . . . . . . . . . . . . . . . . . . . . . . . . . . . 5.4.1 Consideration of power spectral density . . . . . . . . .
46 47
5.4.2
Physical meanings of wind field model parameters . . .
47
5.4.3
Implementation steps . . . . . . . . . . . . . . . . . . .
49
Results . . . . . . . . . . . . . . . . . . . . . . . . . . . . . . . 5.5.1 Wind field simulation and its visualization . . . . . . .
50 51
5.5.2
51
5.4
5.5
Performance results . . . . . . . . . . . . . . . . . . . .
6 Applications of Noise-based Non-frozen Wind Field
55
6.1
Animation of grass field . . . . . . . . . . . . . . . . . . . . .
55
6.2
Tracing particles . . . . . . . . . . . . . . . . . . . . . . . . .
61
6.3
Animation of cloth in the wind . . . . . . . . . . . . . . . . . 6.3.1 Verlet integration . . . . . . . . . . . . . . . . . . . . .
61 62
6.3.2
Solving constraints by relaxation . . . . . . . . . . . .
62
6.3.3
Cloth simulation . . . . . . . . . . . . . . . . . . . . .
63
Animation of fire . . . . . . . . . . . . . . . . . . . . . . . . . 6.4.1 Introduction . . . . . . . . . . . . . . . . . . . . . . . .
65 65
6.4.2
Modeling and visualizing fire . . . . . . . . . . . . . . .
68
6.4.2.1
A simple model of fire . . . . . . . . . . . . .
69
6.4.2.2
Animating fire . . . . . . . . . . . . . . . . .
71
6.4
vii
6.4.3
Rendering fire . . . . . . . . . . . . . . . . . . . . . . .
73
6.4.4 6.4.5
Implementation and results . . . . . . . . . . . . . . . Conclusion . . . . . . . . . . . . . . . . . . . . . . . . .
74 74
7 Conclusion and Future Work
78
A A hot wire anemometer (Model: AM-4204)
80
A.1 Features . . . . . . . . . . . . . . . . . . . . . . . . . . . . . . A.2 RS232 PC Serial Interface . . . . . . . . . . . . . . . . . . . . Bibliography
80 81 87
viii
Chapter 1 Introduction 1.1
Motivation
Wind is one of familiar natural phenomena that we could find easily everywhere. However, we cannot see the wind, nor hold it in our hands. Instead what we can see is the ripple upon the waters, the fallen leaves dancing in a circle, dust swirling across the path, the swaying of tree-branches in the breeze, etc. Thus, in the field of computer animation, wind is an important element for creating believable and visually pleasant motion in natural outdoor scenery. It is challenging however to mathematically model and to predict accurately these matters, since such natural phenomena have irregular shapes and change their shapes quickly. Therefore the problem of simulating such motions and behaviors due to winds is a complex, scientific topic. Since wind exhibits a high degree of complexity, it is difficult to simulate using only physical models. On the other hand, in the computer animation industry, the ultimate goal for realistic animation is not a completely physics based reality, but rather a plausible reality. The success of simulating wind depends on many factors. An important visual fact of different types of winds is that they appear and behave differently at various scales. For practical reasons, smaller scales are modeled by a stochastic model. The idea of separating a wind phenomenon into a large scale smooth component and a small scale turbulent component has proven to be effective in both animation and rendering.
1
CHAPTER 1. INTRODUCTION
1.2
Prior works
In computer graphics, we have several research results on modeling winds. Most research efforts are focused on expressing them as natural phenomena [43], [39], [44], [52], [42], [51]. When wind blows, every object in the simulation environment is affected by the wind. Therefore, the natural wind has been expressed as velocity fields affecting on the whole environment. Wejchert et al. [52] introduced an aerodynamics model to simulate the motion of leaves blown by the wind. To depict animated trees and grass, Shinya et al. [39] constructed a complex flow field by modeling the wind field in Fourier space and then converting it to a time-varying force field. Stam et al. [44] decomposed the turbulent wind field into two components. The Kolmogorov spectrum was used to model the small-scale random vector field for the turbulent motion of gas. Ota et al. [32], Hu et al. [18] simulated the motion of branches and leaves swaying in a wind field by using noise functions. In the animations of waving phenomena, Fujimoto et al. [11], Qiang et al. [36] used fractional Brownian motion. Qiang et al. [36] expanded 2D simulation of breaking waves into 3D representation by giving motion variation using fBm. Computational fluid dynamics methods for solving the Navier-Stoke’s equations have led to significant developments in the visual simulation of fluids [43], [10]. Stam [43] proposed an unconditionally stable fluid solver using semi-Lagrangian advection schemes and implicit solving method. Wei et al. [51] presented an approach for modeling wind field affecting on lightweight deformable objects. They modeled the wind field by using the Lattice Boltzmann Model from computational fluid dynamics. In addition, many other papers, such as [46], [5], [15], are concerned with modeling the faithful motions to the influence of external forces such as caused by a wind.
1.3
Methodology
Approaches based on physical methods provide physical accuracy and visually convincing results, but their computational cost is quite high. Methods based on noise functions are simpler than abovementioned methods, but the simulated wind fields are not realistic enough because the key characteristics of
2
CHAPTER 1. INTRODUCTION
natural wind are not considered. To realistically model natural wind, experiments and statistics can be used from other fields, e.g. structural engineering or wind engineering. This observation forms the basis of our method and we derive a wind field model from the structural engineering. The key component of our model is a stochastic process that faithfully mimics the stochastic properties of the natural wind. This contributes to the visual and physical realism of the objects swaying in the wind. In this thesis, we will address the study on wind models from the field of engineering and indicate their applicability in computer animations for simulating a variety of motions and the behaviors of objects in windy conditions.
1.4
Objectives
The aim of this thesis is the identification of alternative approaches for simulating a wind field and the animation of dynamic natural scenes with reduced computational costs while simultaneously producing a realistic visual simulation. We use a noise-based approach to minimize computation time and stochastic approaches to approximate the complicated motions due to the winds. Fractional Brownian motion (fBm) is one useful technique to represent natural objects and phenomena with randomness. Up to now, fBm, also known as 1/f β noise, has been mainly used for representing the shapes of static objects, such as mountainous terrains or clouds of fractal density distribution [25]. In our approach, we implement fBm functions using a simple spectrum synthesis technique based on Fourier transform [14]. It is also possible to use other techniques such as Perlin noise [33] and procedural noise functions [21]. Specifically, in order to create natural motions and behaviors, we use measured data of actual wind and employ theoretical approaches used in the structural engineering. Additionally, in computer animation, it requires to realistically simulating different types of winds such as breezes or gusts since wind can be destructive as easily as it can be soothing.
3
CHAPTER 1. INTRODUCTION
1.5
Contributions
Our contributions can be summarized in the following points. • Our method is simple but can provide wind fields of almost same quality as those of well-known approaches. • Wind fields simulated by our method can be described using relatively few parameters. • Our wind model can simulate different kinds of wind conditions such as breezes or gusts by controlling parameters in wind models. • We can simulate winds at different heights or on different terrains by changing the parameter values in wind models • Our proposed model is applicable to a wide range of natural phenomena such as grass blowing in the wind, animation of fire simulation, animation of cloth in the wind, etc.
1.6
Thesis outline
This thesis is organized as follows. Chapter 2 gives a brief explanation on noise functions and a generation technique about 1/f β noise. In this section, we define noise both intuitively and formally. We then examine important issues of modeling details with noise. Chapter 3 describes natural features of wind. This section introduces the fundamental study of wind, descriptive terms of wind speed, and the relationship between wind speeds and the Beaufort force. Wind profiles parameters such as turbulence intensity, wind shear; and mathematical models of turbulence spectrums will be introduced on a basis of theoretical background. Chapter 4 presents methods of wind modeling which have been used in the field of engineering. We start with the experimental analysis of measured wind speed data using theoretical approaches from the structural engineering field. In this section, we describe a general form of wind modeling and estimate parameters for our wind turbulence model using selected sample cases. Then, we present results of simulated winds determined with our proposed spectrum
4
CHAPTER 1. INTRODUCTION
and describe the implementation algorithm for constructing wind fields. At the end, we describe a simulation of grass fields utilizing our wind field method. Chapter 5 describes an alternative method to construct 3D non-frozen wind fields based on 1/f β noise. In order to illustrate the natural characteristics of wind predicted in an intuitive manner, we included some experimental data. We show that 1/f β noise based wind field generation method is one useful technique to simulate different types of winds by controlling the parameters in wind field model. We compare our proposed two-dimensional and threedimensional wind field models to other existing approaches. Implementation and visualization of wind fields will be followed. Chapter 6 presents applications of noise-based non-frozen wind field generation. In this section, we describe the animation of complex behaviors of cloth-like object under the influence of the wind, animation of a simple grass field, animation of fire, etc. Chapter 7 draws conclusions on this thesis at the end.
5
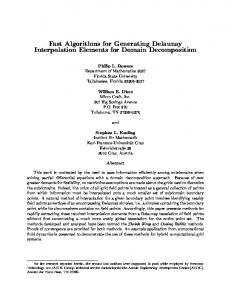
Chapter 2 Noise Functions Procedural noise functions are widely used in computer graphics, from off-line rendering in the movie production to interactive video games. The ability to add complex and intricate details at low memory and cost is one of its main attractions. Ever since the first image of the marble vase, presented by Perlin [33] (Figures 2.1 and 2.2), Perlin noise has been widespread use in both in research and in industry. Noise has been used for a diverse and extensive range of purposes in procedural texturing, including clouds, waves, tornadoes, rocket trails, heat ripples, incidental motion of animated characters and so on. Procedural noise has many advantages: it is typically very fast to evaluate, often allowing evaluation of complex and intricate patterns on-the-fly, and it has a very low memory footprint, making it an ideal candidate for compactly generating complex visual detail. In addition, with a suitable set of parameters, procedural noise can be used to easily generate a large number of different patterns. The most recent survey on noise is in the book of [9]. Since then there have been a multitude of recent research results in the domain such as [6], [3], [13], [22], as well as many others. In this section we provide more detail on fractional Brownian motion (fBm), also known as 1/f β noise. We start from a high-level review and classification of existing procedural noise functions. Then we examine the important issues of modeling details with 1/f β noise.
6
CHAPTER 2. NOISE FUNCTIONS
Figure 2.1: Perlin noise. (a) Perlin’s noise function, the first procedural noise functions. (Figure from [34]) (b) Perlin’s marble vase, one of the first procedural textures created using Perlin noise. (Figure from [33])
Figure 2.2: Image starting at the top-left (just noise) and going counterclockwise, ending at the top right marble image. (a) worn metal, water wave; (b) turbulent flows, fire, marble; (c) turbulent flows, fire, marble, clouds; (d) rock, mountains, clouds (Making noise by Ken Perlin)
7
CHAPTER 2. NOISE FUNCTIONS
2.1
Intuitive definition of noise
Noise is the random number generator of computer graphics. It is a random and unstructured pattern, and is useful wherever there is a need for a source of extensive detail that is nevertheless lacking in evident structure. Random patterns are often described in the frequency domain. Whereas in the spatial domain, a signal is determined by specifying the value for every location in space, in the frequency domain, a signal is determined by specifying the amplitude and phase for every frequency. However, for unstructured patterns, the phase is random and does not contribute useful information. Therefore, noise is often described by its power spectrum, which specifies the magnitude (squared) of each frequency and ignores the phase. A high value of a specific frequency in the power spectrum corresponds to a high contribution of the corresponding feature size in the spatial domain. Noise is completely characterized by its power spectrum as explained in Chapter 2.2. Many tasks involving noise can be described as manipulations of the power spectrum of the noise, or spectral control. For example, modeling a noise corresponds to shaping its power spectrum, and filtering a noise corresponds to damping frequencies in the power spectrum that are too high. White noise contains all frequencies in equal mixture and with random phase, so it provides the raw material to generate unstructured signals with any combination of frequencies. A band-limited power spectrum is non-zero only within a specific range of frequencies. So it can be used as a basis in the frequency domain to shape a desired power spectrum for modeling or filtering.
2.2
1/f β noise
The appearance of power laws in the theory of critical phenomena and all the work of Mandelbrot on fractals in the 1970s seemed to indicate that something deeper was hidden in those ubiquitous spectra. To the physicist, unpredictable changes of any quantity V varying in time t are known as noise. Graphical samples of typical noises V (t) are shown in Figure 2.3. To the left of each sample is a representation of its spectral densities. The spectral density, SV (f ), gives an estimate of the mean square
8
CHAPTER 2. NOISE FUNCTIONS
Figure 2.3: Samples of typical noises, V (t), the random variations of a quantity in time. (a) White noise, the most random. (b) 1/f −noise, an intermediate but very commonly found type of fluctuation in nature. (c) Brownian motion or a random walk. To the left of each sample is a graphical representation of the spectral density, SV (f ), a measurement characterizing the time correlations in the noise. fluctuations at frequency f and, consequently, of the variations over a time scale of order 1/f . Power laws and 1/f spectra were found most unexpectedly in many different phenomena, and Figure 2.4 show how such spectra reproduced in a famous review paper by [1]. The work of Clarke and Voss on 1/f noise in resistors also spawned an interesting aside, a study of 1/f noise in music, which becomes widely known thanks to an excellent popularization made by Gardner in his Scientific American column [12]. Clarke and Voss found that both voice and music broadcasts have 1/f spectra (see Figure 2.5), and even devised and algorithm to compose “fractal” music [49].
9
CHAPTER 2. NOISE FUNCTIONS
Figure 2.4: (a) Power spectrum of the east-west component of ocean current velocity; the straight line shows the slope of a 1/f spectrum. (b) Sea level at Bermuda: this is 1/f β spectrum with β = 1.6. [4]
2.3
Spectral densities for fBm and the spectral exponent β
1/f β noise is a noise of which the spectral density is proportional to 1/f β . The value of β determines the correlation between noise values varying along the time axis t. As β decreases, the fluctuation of the noise increases. On the other hand, as β increases, the fluctuation decreases. The method proposed in this thesis is based on the fact that 1/f noise is observed in natural wind blowing. By then many physicists were convinced that there had to be a deep reason for the ubiquity of this kind of power-law noises, that there had to be something similar to the universality of exponents in critical phenomena, and therefore many people set out to find an all-encompassing explanation. We understand that the behaviors and motions due to the winds can be effectively represented using 1/f β noise functions.
2.4
Generation technique of 1/f β noise
In the field of computer graphics, in general, we know that “Perlin noise” is a useful technique for generating noise functions [33], [8]. Perlin noise is a general-purpose noise generator, and can be used for generating 1/f β noise by giving proper weights to noise factors having different frequencies. 10
CHAPTER 2. NOISE FUNCTIONS
Figure 2.5: Loudness (left) and pitch (right) fluctuation spectra vs. frequency (Hz ) (log-log scale), for (a) Scott Joplin piano rags; (b) classical radio station; (c) rock station; (d) news-and-talk station. Nevertheless, in our method, we generate 1/f β noise using “Fourier filtering” [49], since we focus on only 1/f β noise, not general noise, and Fourier filtering is a technique that was specially developed for generating 1/f β noise easily. Using Fourier filtering, discrete 1/f β noise values are generated. Then, these values are smoothly interpolated to define a continuous 1/f β noise function V (t). In this technique, first, the coefficients of the discrete Fourier transform are obtained in the frequency domain so as to meet the condition of 1/f β noise by using a Gaussian random number generator. Then, the inverse Fourier transform of the coefficients is calculated to obtain discrete 1/f β noise values in the time domain. The discrete noise values are normalized and stored in a one-dimensional array, which is named noise array. A noise value V (t) at arbitrary time t can be obtained by interpolating the discrete noise values in the noise array near the time t. This makes the noise function V (t) continuous along the time axis t.
11
CHAPTER 2. NOISE FUNCTIONS
2.5
Higher dimensional 1/f β noise
In this section, we discuss how to generalize the spectral synthesis methods to two, three and higher dimensions. The generalization of 1/f β noise is straight forward. The random field V has stationary increments and is isotropic, i.e. all points (t1 , t2 , , tn ) and all directions are statistically equivalent. In the frequency domain we have for the spectral density S(f1 , ..., fn ) = �pP n
1
2 i=1 fi
�2H+n
(2.1)
where the parameter H satisfies 0 < H < 1. The parameter H describes the “roughness” of the noise function at small scales. This ensures that V restricted to any straight line will be 1/f β noise corresponding to 2H = β − 1. The fractal dimension of a sample V (t1 , t2 , , tn ) is 3−β (2.2) 2 where D spans the range E < D < E + 1, and 1 < β < 3. The value H = 0.8 D =E+1−H =E+
is empirically a good choice for many natural phenomena.
2.6
1/f β noise by example
In this section we represent the visual connection between many, seemingly complex, shapes in the natural world and the relation between fractal dimension D, the parameter value of fBm, and the spectral density exponent β. We show the results of spectral synthesis method for producing a finite sample of fBm as a noise (E = 1), a landscape (E = 2), or a cloud (E = 3). Creating visually rich and interesting content from noise is not an easy task, essentially because the random nature of noise makes it difficult to control and predict the result. Figures 2.6, 2.7 and 2.8 show samples of fBm noise for different values of H and D.
12
CHAPTER 2. NOISE FUNCTIONS
(a) H = 0.1, β = 1.2, D = 1.9
(b) H = 0.3, β = 1.6, D = 1.7
(c) H = 0.5, β = 2.0, D = 1.5
(d) H = 0.7, β = 2.4, D = 1.3
(e) H = 0.9, β = 2.8, D = 1.1
Figure 2.6: 1/f β noise via spectral synthesis. The above curves correspond to spectral density functions of the form 1/f β where β = 2H + 1, D = 2 − H. 13
CHAPTER 2. NOISE FUNCTIONS
(a) H = 0.2, D = 2.8
(b) H = 0.2, D = 2.8
(c) H = 0.5, D = 2.5
(d) H = 0.5, D = 2.5
(e) H = 0.8, D = 2.2
(f) H = 0.8, D = 2.2
Figure 2.7: Fractal clouds with varying dimensions. The above clouds correspond to spectral density functions of the form 1/f β where β = 2H + 2, D = 3 − H.
14
CHAPTER 2. NOISE FUNCTIONS
(a) H = 0.2, D = 3.8
(b) H = 0.2, D = 3.8
(c) H = 0.5, D = 3.5
(d) H = 0.5, D = 3.5
(e) H = 0.8, D = 3.2
(f) H = 0.8, D = 3.2
Figure 2.8: Fractal clouds with varying dimensions. The above clouds correspond to spectral density functions of the form 1/f β where β = 2H + 3, D = 4 − H.
15
Chapter 3 The Nature of Wind 3.1
What is wind?
We feel winds because the air around us moves. Wind is movement of air. Wind occurs because of horizontal and vertical differences in atmospheric pressure. We describe wind by its direction and speed. It is usually expressed in terms of the point of compass. Air moving from east to west is called easterly wind. Wind speed is the speed of the air flow. It is usually expressed in kilometers per hour or as a force on the Beaufort scale. The scale was introduced by Sir Francis Beaufort of the British navy in the early 19th century. The Beaufort scale is used to measure and describe the effects of different wind velocities on objects on land or at sea. It is divided into 13 levels, from the calm wind of force 0 to hurricane wind of force 12. Table 3.1 illustrates the relationship between descriptive terms of wind speeds, the Beaufort force and wind speeds.
3.2
The variable nature of wind
The wind speed at a given location is continuously varying. There are changes in the annual mean wind speed from year to year, changes with season (seasonal ), with passing weather system (synoptic), on a daily basis (diurnal ) and from second to second (turbulence).
16
CHAPTER 3. THE NATURE OF WIND
3.3
Variation of wind speed with height
Winds occur just above the surface or at high altitudes. The strongest, steadiest and most persistent winds occur in bands some 10 km above the earth’s surface. The region below about 1 − 2 km, the wind is strongly affected by the surface, through friction, and hence wind speeds are lower. In general, the wind speed is nominally zero at ground level and increases steadily with height. The change of wind speed with height is known as the wind shear. The variation of wind speed with height can be represented mathematically by a logarithmic law. U (z) = K ln(
z ) z0
(3.1)
where U (z) is the mean wind speed at height z, K is a factor which depends on the overall wind speed, and z0 is known as the surface roughness length. The surface roughness length characterizes the terrain and has a given value depending on the friction of the surface over which the wind passes. Typical values of z0 are given in Table 3.2. The mean wind speed profile for the atmospheric boundary layer is described using a power law [41], [17]: � U (z) = U (zref )
z
�α
zref
(3.2)
where U (z) is the mean wind speed at height z above the ground, zref is the reference height (normally taken to be 10 m), and α is the power law exponent. An alternative description of the mean wind speed uses the logarithmic law: U (z) =
1 z u∗ ln( ) k z0
(3.3)
where u∗ is the friction velocity, k is von Karman’s constant (= 0.4), and z0 is the roughness length. The determination of u∗ from Equation 3.3 requires U (z), z, and z0 . The typical values for α and z0 are listed in Table 3.2.
17
CHAPTER 3. THE NATURE OF WIND
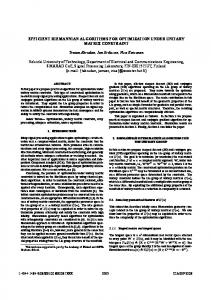
Figure 3.1: Atmospheric boundary-layer profiles (plots of average wind speed U versus height z) over different terrains. Wind speeds are expressed as percentages of the upper level wind (referred to as the gradient wind) above the boundary (or surface) layer. Wind blowing over the ground surface is slowed when it encounters the friction of uneven ground, trees, and buildings. This roughness affects the thickness of the boundary layer and the power law exponent. The thickness of the boundary layer and the power law exponent both increase as a function of the surface roughness. Thus, the velocity at any height decreases as the surface roughness increases (See Figure 3.1). If the speed of wind for a particular terrain is known, Equation 3.2 and Table 3.2 can be used to calculate the wind speed at some other terrain.
3.4
Turbulence of wind
Short term variations in wind speed are also important in the design and evaluation of winds. For simplicity, we can regard the instantaneous wind speed U (t) as quasi-steady component U and a turbulent fluctuations u(t) about this mean wind value. U (z, t) = U (z) + u(z, t)
18
(3.4)
CHAPTER 3. THE NATURE OF WIND
The quasi-steady state value is given by averaging over an appropriate period of time. Over this same period we characterize the variability of the wind by the variance of U (t), which is equal to the mean square value of u(t) in Equation 3.4. An indication of the gustiness at a given site is provided by a parameter, known as the turbulence intensity, denoted I. This is defined as σ(z) (3.5) U (z) An overall measure of the intensity of turbulence is provided by the root mean square value. Thus, the longitudinal component of the turbulence is I(z) =
�
1 σ(z) = T0 where T0 is the averaging period.
3.5
Z
T0
u2 (z, t)dt
� 12 (3.6)
0
Wind modeling
There are many mathematical models of wind turbulence spectrum ([19], [16], [7], [20], [40]). Wind power spectrums are expressed in a non-dimensional form, so we computed normalized power spectral density nS(n)/u2∗ and normalized frequency nz/U (z). In this section, we present a comparative study of these spectral densities. The formulae for the spectral densities are summarized as follows. • Kolmogorov [41]: nSu (n) = 0.26f −2/3 2 u∗ where n = the frequency in hertz,
(3.7)
u∗ = the friction velocity, f = nz/U (z) is the reduced frequency, U (z) = the mean wind speed at height z. • Davenport [7]: nSu (n) 4.0x2 = u2∗ (1 + x2 )4/3 19
(3.8)
CHAPTER 3. THE NATURE OF WIND
where x = 1200n/U (z) • Kaimal [20] and Simiu [40]: nSu (n) 200f = 2 u∗ (1 + 50f )5/3
(3.9)
where f = nz/U (z) The turbulence spectral density functions formulated to date have specific advantages and drawbacks. For example, Davenport’s spectrum has no relationship with height above the ground, whereas the spectrum proposed by Kaimal and Simiu depends on the altitude and it can be applied to both low-frequency and high-frequency spectrum areas.
20
CHAPTER 3. THE NATURE OF WIND
Table 3.1: Beaufort wind force scale.
Beaufort Force
Description
Wind speed (km/h)
Force 0
Calm