(IJACSA) International Journal of Advanced Computer Science and Applications,. Vol. 7, No ... technologies such as Cloud Computing or Big Data, large amount.
(IJACSA) International Journal of Advanced Computer Science and Applications, Vol. 7, No. 4, 2016
A Subset Feature Elimination Mechanism for Intrusion Detection System Herve Nkiama
Syed Zainudeen Mohd Said
Muhammad Saidu
Faculty of Computing University Technology Malaysia Skudai 81310, Johor Barhu Malaysia
Faculty of Computing University Technology Malaysia Skudai 81310, Johor Barhu Malaysia
Faculty of Computing University Technology Malaysia Skudai 81310, Johor Barhu – Malaysia
Abstract—several studies have suggested that by selecting relevant features for intrusion detection system, it is possible to considerably improve the detection accuracy and performance of the detection engine. Nowadays with the emergence of new technologies such as Cloud Computing or Big Data, large amount of network traffic are generated and the intrusion detection system must dynamically collected and analyzed the data produce by the incoming traffic. However in a large dataset not all features contribute to represent the traffic, therefore reducing and selecting a number of adequate features may improve the speed and accuracy of the intrusion detection system. In this study, a feature selection mechanism has been proposed which aims to eliminate non-relevant features as well as identify the features which will contribute to improve the detection rate, based on the score each features have established during the selection process. To achieve that objective, a recursive feature elimination process was employed and associated with a decision tree based classifier and later on, the suitable relevant features were identified. This approach was applied on the NSL-KDD dataset which is an improved version of the previous KDD 1999 Dataset, scikit-learn that is a machine learning library written in python was used in this paper. Using this approach, relevant features were identified inside the dataset and the accuracy rate was improved. These results lend to support the idea that features selection improve significantly the classifier performance. Understanding the factors that help identify relevant features will allow the design of a better intrusion detection system. Keywords—classification; decision tree; features selection; intrusion detection system; NSL-KDD; scikit-learn
I.
INTRODUCTION
With the recent advance in technologies where concepts like Cloud Computing, Big Data, and Social Media Network have emerged, our society produce enormous quantity of data. Finding useful information among this immense data generated by these technologies became critical for marketers, data scientist and even business corporate. With this amount of data transmitted over a network or internet, security becomes a major concern, although multiple intrusion prevention technologies have been built in the past decade to eliminate potential threats despite that, attacks still continue and increase in complexity, this is the reason there is a need of a mechanism to detect any suspicious or unwanted traffic which may cause damage on a particular network.
This security mechanism can be implemented using an Intrusion Detection System (IDS) which can be describe as a collection of software or hardware device able to collect, analyze and detect any unwanted, suspicious or malicious traffic either on a particular computer host or network[1]. Therefore to achieve its task, an IDS should use some statistical or mathematical method to read and interpret the information it collects and subsequently reports any malicious activity to the network administrator [2]. There still exist one main issue regarding the actual intrusion detection technique that is the involvement of human interaction when it comes to label the traffic between an intrusion and a normal one, another major concern is the new challenge of “Big Data” and “Cloud Computing”. These two ubiquitous technologies produce a large amount of data that must be collected and analyzed by the intrusion detection engine dynamically and often the IDS needs to deal with a multi-dimensional data generated by these large quantities of data. It is necessary to consider that the intrusion dataset can be huge in size, not only the number of observations grown, but the number of observed attributes can also increase significantly and may generated a considerably amount of false positives results as it can contain many redundant or duplicate records [3]. A data clean process can require a tremendous human effort, which is an extensive time consuming and expensive [4]. A machine learning approach and data mining technique which is the application of machine learning methods to large database are widely known and used to reduce or eliminate the need of a human interaction. Machine learning helps to optimize performance criterion using example data or past experience using a computer program, models are defined with some parameters, and learning is the execution of the programming computer to optimize the parameters of the model using a training data. The model can be predictive to make predictions in the future, or descriptive to gain knowledge from data. To perform a predictive or descriptive task, machine learning generally use two main techniques: Classification and Clustering. In classification, the program must predict the most probable category, class or label for new observation into one or multiple predefined classes or label while clustering, the classes are not predefined during the learning process.
148 | P a g e www.ijacsa.thesai.org
(IJACSA) International Journal of Advanced Computer Science and Applications, Vol. 7, No. 4, 2016
However if the purpose of the IDS is to differentiate between normal or intrusion traffic, classification is recommended and if we seeks to identify the type of intrusion, clustering can be more helpful [5]. However, a lot of researchers have suggested to use the KDD dataset to detect an attack [6][7] in the past. Unfortunately, these proposal have failed to ensure a good performance in terms of detection rate. Moreover those existing IDS aims to analyze all features which can result a misclassification of intrusion and quite amount of time when building the model, despite some concern and critic about the system evaluation of the KDD dataset [8], research still use it to test their model. Thus, in this paper a method has been suggested for selecting and identifying relevant features on the NSL-KDD dataset which is an improvement of the previous one [9]. The rest of this paper is divided as followed: Section II – Description of the NSL-KDD Dataset, Section III- Previous works, Section IV – Methodology, Section V- Experiment and Results and finally the Section VI- Conclusion and Further Works. II.
DESCRIPTION OF NSL-KDD
The KDD 1999 dataset was developed by the MIT Lincoln Labs [10] and was extensively used by researchers during the last decade. The entire dataset is very large in size and contains many attributes variables. Therefore to improve the machine learning computation, 10 % of it was extracted and adopted as training dataset in the intrusion detection process. However, some inherent drawback was made about this dataset [8][9]. The KDD 99 contains an important quantities of redundant records which has as consequence to prevent the learning algorithm to perform well. In addition, duplicate records found in the test dataset cause the evaluation result to be biased by the method used during the detection rates results. To resolve some issues found in the previous KDD 99, an improved version was created, the NSL KDD dataset which can be available at [11]. The reason behind the use of this dataset has been reported at [9] among them the following are relevant to mention:
Elimination of redundant records in the training set will help our classifier to be unbiased towards more frequent records.
No presence of duplicate records in the test set, therefore, the classifier performance will not be biased by the techniques which have better detection rates on the frequent records.
The training and test set contains both a reasonable numbers of instances which is affordable for experiments on the entire set without the need to randomly choose a small portion.
The NSL KDD dataset contains four main files as describe in the Table 1.
TABLE I.
NSL KDD DATASET DESCRIPTION
Name of the Files KDDTrain+.TXT
KDDTest+.TXT KDDTrain+_20Percent.TXT KDDTest-21.TXT
Description It is the full training set including attack-type labels and difficulty level in csv format It is the full test set including attack-type labels and difficulty level in csv format 20% subset of the KDDTrain+.txt A subset of the KDDTest+.txt file which does not include records with difficulty level of 21 out of 21
In this paper, the KDDTain+.TXT and the KDDTest+.TXT which consists of 126,620 and 22,850 records respectively were used. The training and test set contain both 41 features labeled as normal traffic or specific attack types, all these features are subdivided in 4 categories [12][13]: basic features, time-based traffic features, content features and host-based traffic features. All categories are described below: Basic features: It contains all features which derived from TCP/IP connection such as Protocol_type, Service, duration and etc. Time-based traffic features: It is used to capture those features which are mature over a 2 second temporal window (e.g. count, srv_count, Rerror_rate and etc.) Content features: Those features use domain knowledge to access the payload of the original TCP packets (e.g. hot, num_root, is_guest_login and etc.) Host-based traffic features: all attacks which span longer than 2 second intervals that have the same destination host as the current connection are access using these features (e.g. dst_host_count, dst_host_srv_count and etc.) The classes or labels in the NSL KDD dataset are divided into four categories which represent the attack class and one as normal traffic [12]: 1) Denial of Service (DoS): This attack aims to block or restrict a computer system or network resources or services. 2) Probe: here the intruder aims to scan for information or vulnerabilities in a network or computer system which later on will be used to launch attacks. 3) Remote to Local (R2L): Here the intruder gain remotely unauthorized access to a computer system over a network by sending data packet to that system. 4) User to Root (U2R): Here the intruder gains access to a user with normal privilege and later on try to access a user with administrator or root privilege. The Table 2 and 3 describe and explain the analysis of the attack classes and types in the NSL_KDD dataset in details and shows the number of individual instances and records, both in the training and testing set.
149 | P a g e www.ijacsa.thesai.org
(IJACSA) International Journal of Advanced Computer Science and Applications, Vol. 7, No. 4, 2016 TABLE II. Attack Classes or Labels
DoS
Probe
R2L
U2R
NUMBER OF INSTANCES IN THE TRAINING SET Attack types (number of instances) back (956), land(18), neptune(41,214), pod(201), smurf(2,646), teardrop(892) satan(3,633), ipsweep(3,599), nmap(1,493), portsweep (2,931) guess_passwd(53), ftp_write(8), imap(658), phf(4), multihop(7), warezmaster(20), warezclient(890), spy(2) buffer_overflow(30), loadmodule(9), rootkit(10), perl(3)
Grand Total
Total of instances
45,927
11,656
1,642
52 59,277
The normal traffic contains 67,343 instances which brings a total of 126,620 instances in the training set. TABLE III. Attack class or label
DoS
Probe
R2L
U2R Grand Total
NUMBER OF INSTANCES IN THE TEST SET Attack types (number of Total of instances instances) back(359), land(7), neptune(4,657), apache2(737), pod(41), smurf(665), teardrop(12), udpstorm(2), processtable(685), 7,460 worm(2), mailbomb(293) Satan(735), ipsweep(141), nmap(73), portsweep(157), mscan(996), saint(319) 2,421 guess_passwd(1,231), ftp_write(3), imap(307), xsnoop(4), phf(2), multihop(18), warezmaster(944), xlock(9), snmpguess(331), snmpgetattack(178), 3,191 httptunnel(133), sendmail(14), named(17) Buffer_overflow(20), loadmodule(2), xterm(13), rootkit(13), perl(2), 67 sqlattack(2), ps(15) 13,139
The normal traffic contains 9,711 instances which brings a total of 22,850 instances in the test set. More details on the features names and descriptions can be found at [13] III.
PREVIOUS WORK
Most of the proposed research system could effectively utilize feature selection process to improve detection rate of their system and minimize considerably the false alarm rate. Research usually missed to detect new intrusions, especially when the intrusion mechanism used differed from the previous intrusion. In 2009, Shi-Jinn [14] works revealed that not all research carried out feature selection before they trained their classifier, however based on [15][16], this processes takes a significant
part to different types of intrusion identification and features can be excluded without the performance of the IDS to be dropped. Juan Wang et al., in their work [17] proposed a decision tree based algorithm for intrusion detection, even if during their experiments the C4.5 algorithm was achieving a good detection accuracy, the error rate was remaining identical. Back in 2010, Farid et al. [18], used a decision tree based learning algorithm to retrieve important features set from the training dataset for intrusion detection. Their techniques found relevant features using a combination of ID3 and C4.5 decision tree algorithms. They assigned a weight value to each features. The weight is determined where the minimum depth of the decision tree at which each feature is checked inside the tree and the weights of features that do not appear in the decision tree are allocated a value of zero. Ektefa et al. [19], used different data mining method for intrusion detection and they found that the decision tree classifier was performing better than the SVM learning algorithm. Geetha Ramani et al. [20] used in their paper in 2011, a statistical method for analyzing the KDD 99 dataset. They identified the important features by studying the internal dependences between features. In their paper proposed in 2012, S. Mukherjee and N. Sharma [21] designed a technique called Feature- Vitality Based Reduction Method (FVBRM) using a Naïve Bayes classifier. FVBRM identifies important features by using a sequential search approach, starting with all features, one feature is removed at a time until the accuracy of the classifier reaches some threshold. Their method shows an improvement of the classification accuracy but takes more time and still complex when detecting the U2R attacks. In 2013, support vector machine classifier was used by Yogita B. Bhavsar et al. [22], for intrusion detection using the NSL KDD dataset. The drawback with this technique is the extensive training time required by the classifier, so to reduce the time, they applied a radial basis function (RBF) to reduce the extensive time. In 2014, O. Y. Al-Jarrah et al. [23], used an ensembles of decision-tree based voting algorithm with forward selection / backward elimination feature raking techniques using a Random Forest Classifier. Their method shows an improvement of detection accuracy when selected important features and it can be suitable for large-scale network. N. G. Relan and D. R. Patil [24] in their papers have tested two decision tree approach to classify attacks using the NSL KDD dataset. They have found that the C4.5 with pruning offers better accuracy than the C4.5 without pruning and it was necessary to reduce the number of features because using all features degrades the performance of the classifier also its time consuming. After analyzing some previous works, the reasons most of researchers are interested in selecting and identifying relevant features are described as follow: In most learning algorithms, the complexity depends on the number of input dimensions, d, as well as on the size of the data sample, N, and for reduced memory and computation, researchers are interested in selecting
150 | P a g e www.ijacsa.thesai.org
(IJACSA) International Journal of Advanced Computer Science and Applications, Vol. 7, No. 4, 2016
relevant and important feature to reduce the dimensionality of the problem. Decreasing d also decreases the complexity of the inference algorithm during testing.
When an input is decided to be unnecessary, the cost of extracting it is saved.
Simpler models are more robust on small datasets. Simpler models have less variance, that is, they vary less depending on the particulars of a sample, including noise, outliers, and so forth.
When data can be explained with fewer features, better idea about the process that underlies the data can be obtained and this allows knowledge extraction.
estimator (classifier) defines in the scikit-learn works well with numerical inputs, so a one-of-K or one-hot encoding method is used to make that transformation. This technique will transforms each categorical feature with m possible inputs to n binary features, with one active at the time only
When data can be represented in a few dimensions without loss of information, it can be plotted and analyzed visually for structure and outliers. IV.
METHODOLOGY
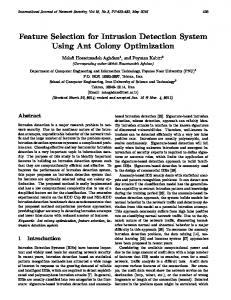
A. Scikit-Learn Description As stated before, during this experiment scikit-learn [25] was used, which is a machine learning library written in python. Most of the learning algorithm implement in scikitlearn required data to be stored in a two-dimensional array or matrix. The size of the expected matrix is [samples, features]. The first parameter defines the number of samples, each sample is an item to be processed and the second parameter is the number of features that can be used to describe each item in a quantitative manner, generally real-valued but may be Boolean or discrete-valued in some cases. Data in scikit-learn is represented as a feature matrix and a label vector. Fig. 1 shows the data representation in scikit-learn.
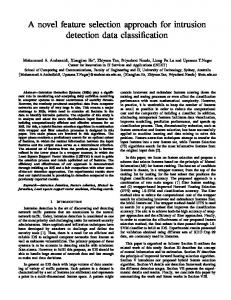
Fig. 2. Experiment methodology
Step 2: Features scaling Features scaling is a common requirement of machine learning methods, to avoid that features with large values may weight too much on the final results. For each feature, calculate the average, subtract the mean value from the feature value, and divide the result by their standard deviation. After scaling, each feature will have a zero average, with a standard deviation of one. Step 3: Features Selection Feature selection is used to eliminate the redundant and irrelevant data. It is a technique of selecting a subset of relevant features that fully represents the given problem alongside a minimum deterioration of presentation [26], two possible reason were analyzed why it would be recommended to restrict the number of features:
Fig. 1. Data representation in scikit-learn
Here, N are samples and D features B. Expriment Methodology The experiment methodology used in this paper, is illustrated in the Fig. 2 and describe as follow: Step 1: Data Cleaning and Pre-processing Basically in this step the dataset has to go through a cleaning process to remove duplicate records, as the NSL KDD dataset was employed which has already been cleaned, this step is not anymore required. Next a Pre-processing operation has to be taken in place because the dataset contains numerical and non-numerical instances. Generally the
Firstly, it is possible that irrelevant features could suggest correlations between features and target classes that arise just by chance and do not correctly model the problem. This aspect is also related to over-fitting, usually in a decision tree classifier. Secondly, a large number of features could greatly increase the computation time without a corresponding classifier improvement. The feature selection process starts with a univariate feature selection with ANOVA F-test for feature scoring, univariate feature selection analyzes each feature individually to determine the strength of the relationship of the feature with
151 | P a g e www.ijacsa.thesai.org
(IJACSA) International Journal of Advanced Computer Science and Applications, Vol. 7, No. 4, 2016
labels. The SelectPercentile method in the sklearn.feature_selection module were used, this method select features based on a percentile of the highest scores. Once, the best subset of features were found, a recursive feature elimination was applied which repeatedly build a model, placing the feature aside and then repeating the process with the remained features until all features in the dataset are exhausted. As such, it is a good optimization for finding the best performing subset of features. The idea is to use the weights of a classifier to produce a feature ranking. Step 4: Model
V.
EXPERIMENT AND RESULTS
A. Experiment The Decision Tree learning algorithm was used in the experiment. Decision Tree tends sometimes to over-fitting, so to find the best parameters to fit the model, an exhaustive grid search parameters tuning was computed and information gain is used to select features. Hence, building from the training data, a tree was obtained with its leaves being class labels. When building a decision tree, only one feature is used at a time to split the node and partition the data. Hence, features are used in a univariate manner.
Here, a decision tree model was built to partition the data using information gain until instances in each leaf node have uniform class labels. This is a very simple but yet an effective hierarchical method for supervised learning (classification or regression) whereby the local space (region) is recognized in a sequence of repetitive splits in a reduced number of steps (small). At each test, a single feature is used to split the node according to the feature's values. If after the split, for every branches, all the instances selected belong to the similar class, the split is considered complete or pure.
After obtaining the adequate number of features during the univariate selection process, a recursive feature elimination (RFE) was operated with the number of features passed as parameter to identify the features selected. During the RFE process, first, the classifier is trained on the original set of features and weights are attributed to each features. Then, features whose absolute weights are the smallest are pruned from the current set features. That process is recursively repeated on the pruned set until the desired number of features to choose is finally reached
One of the possible method to measure a good split is entropy or information gain. Entropy is an informationtheoretic measure of the ‘uncertainty’ found in a training set, because of the existence of more than one possible classification. The training set entropy is represented by H. It is calculated in ‘bits’ of information and it is described as:
B. Discussions and Results Feature selection is utilized to discriminate the redundant and irrelevant data. It is a technique of selecting a subset of relevant attributes that completely represent the given problem alongside a minimum deterioration of presentation. As consequence, working with a small number of feature may bring better results.
H=-∑ The generation process of a decision tree done by recursively splitting on features is equivalent to dividing the original training set into smaller sets recursively until the entropy of every one of these subsets is zero (i.e everyone will have instances from a single class target). A Decision Tree is made up internal decision nodes and terminal leaves. A test function is implemented by each decision node with a discrete results labelling the branches. Providing an input, at every node, a test is constructed and based on the outcome, one of the branches will be considered. Here the learning algorithm starts at the root and until a leaf node is reached, the process will be done recursively at which moment the value represented in the leaf node is the output. Every leaf node possesses an outcomes label, which it is the class target in case of classification and numeric value for regression. A leaf node can describe a localized space or region where instances finding in this input space (region) possess the same labels for classification and similar numeric value for regression Step 5: Prediction and Evaluation The test data was used to make prediction of our model and for evaluation, multiple settings was considered such as the accuracy score, precision, recall, f-measure and a confusion matrix. A 10-fold cross-validation was performed during all the process.
A general technique to achieve feature selection will be to retrieve the smallest set of features that can exactly characterize the training data. If an attribute always coincides with the label class (that is, it is an exact predictor), it is enough to characterize the data. On the other hand, if an attribute always has the same value, its prediction power will decrease and can be very low. A recursive feature elimination method which repeatedly build a model, placing the feature aside and then repeating the process with the remained features until all features in the dataset are exhausted. The objective of the recursive feature is to retrieve features by recursively keeping smaller and smaller group of features . A good feature ranking criterion does not necessarily produce a good feature subset generation. The some criteria estimate the effect of removing one feature at a time based on the goal to achieve. They become very sub-optimal when it comes to removing several features at a time, which is necessary to obtain a small feature subset. This problem can be overcome by using the following iterative procedure that is Recursive Feature Elimination: Train the classifier (optimize the weights of features with respect to criterion). Compute the ranking criterion for all features. Remove the feature with smallest ranking criterion.
152 | P a g e www.ijacsa.thesai.org
(IJACSA) International Journal of Advanced Computer Science and Applications, Vol. 7, No. 4, 2016
Firstly, the classifier is trained on the initial group of attributes and weights are assigned on each attributes. Then, absolute weights of some attributes that are the smallest are pruned from the current sets of attributes. That technique is recursively repeated on the pruned set until the desired number of attributes to select is eventually reached. As such, it is a good optimization for finding the best performing subset of features. In should be noted that RFE has no effect on correlation methods since the ranking criterion is computed with information about a single feature. An analysis was performed to determine the accuracy of our estimator after selecting relevant features as illustrate in the Fig. 3, 4, 5 and 6 and the detail is summarized in the Table 4. When comparing the result alongside the performance evaluation with all features describe in the Table 5, a significant improvement of the overall performance of the proposed model has been observed.
Fig. 5. R2L Recursive Feature Elimination
Fig. 6. U2R Recursive Feature Elimination
99.69 99.37 97.40 99.70
99.79 99.37 97.41 99.69
99.74 99.37 97.40 99.70
99.505 99.04 95.83 99.66
Dos Probe R2L U2R
99.61 98.94 95.71 99.65
41 41 41 41
Class
99.71 98.84 95.59 99.61
N of Features
F-measure
99.66 99.57 97.03 99.64
Recall
Fig. 4. Probe Recursive Feature Elimination
12 15 13 11
PERFORMANCE EVALUATION WITH 41 FEATURES
Precision
Accuracy
TABLE V.
Class
F-measure
99.90 99.80 99.88 99.95
N of Features
Recall
PERFORMANCE EVALUATION WITH SELECTED FEATURES
Precision
TABLE IV.
Accuracy
Fig. 3. DOS Recursive Feature Elimination
Dos Probe R2L U2R
153 | P a g e www.ijacsa.thesai.org
(IJACSA) International Journal of Advanced Computer Science and Applications, Vol. 7, No. 4, 2016
Table 6 shows a 2x2 confusion matrix after features selection on the dataset for a combination of two target classes (normal class and an attack class). TABLE VI.
DETAILS CONFUSION MATRIX AFTER FEATURES SELECTION
Confusion Matrix True Label
Normal
9676
25
DoS
15
7445
Confusion Matrix True Label
Predicted Label Normal DoS Positive predictive value Negative predictive value
99.74 % 99.79 %
Positive predictive value Negative predictive value
99.39 % 98.76 %
Positive predictive value Negative predictive value
98.79 % 96.98 %
Predicted Label Normal Probe
Normal
9652
59
Probe
30
2391
Predicted Label Normal
R2L
Normal
9594
117
R2L
87
2798
Confusion Matrix
True Label
Confusion Matrix True Label
TABLE VII. 99.84
2.368e-03
1.544e-03
1.153e-02
4.119e-04
3.485e-03 8.674e-03 4.540e-02 5.970e-02
99.691 2.891e-03 1.039e-03 0
9.38337802e-04 99.45 2.079e-03 0
6.702e-04 2.891e-03 96.10 2.089e-01
0 4.130e-04 6.239e-03 87.5
The completed confusion matrix as illustrate in the Figure 7 and Table 7 show the number of correct and incorrect predictions made by the classification model compared to the actual outcomes in the dataset. The Table 8 present the relevant features after a recursive features elimination was operated on the NSL KDD dataset. Features are retrieved based on their rank, relevant (i.e., estimated best) features are attributed a rank 1. During the selection process, some features have participated in improving the accuracy of the model, which it is called the important features selected. The important features or attributes are calculated as the reduction of the criterion brought by that attributes. Each time a split of a node is performed on a particular attributes, the criterion for the two children nodes is inferior to their parent.
Predicted Label Normal U2R
Normal
9683
28
U2R
7
60
CONFUSION MATRIX DETAILS
TABLE VIII. RELEVANT FEATURES Positive predictive value Negative predictive value
99.71 % 89.53 %
Target
Dos
Features selected diff_srv_rate,dst_bytes,dst_host_serror_rate,dst_host_sr v_serror_rate ,flag_S0, rerror_rate,same_srv_rate,service_ecr_i,service_http,ser vice_private,src_bytes, wrong_fragment'
Probe
src_bytes, service_http, dst_bytes, service_ftp_data, dst_host_rerror_rate, service_smtp,service_finger, service_private , rerror_rate , dst_host_diff_srv_rate , dst_host_same_srv_rate , service_telnet , dst_host_count , service_auth , count
R2l
dst_bytes , dst_host_same_src_port_rate , dst_host_same_srv_rate , dst_host_srv_count , dst_host_srv_diff_host_rate , duration , hot , num_access_files , num_fail_login , num_root , service_ftp_data , service_r2l4 , src_bytes
U2r
src_bytes , service_other , service_ftp_data , root_shell , num_shells ,num_file_creations , hot , dst_host_same_srv_rate , dst_host_count , dst_bytes , count
The Figure 8, 9, 10, 11 illustrate the subset features after the feature elimination process has been performed, the aim of this process is to elimination non-relevant features and only print out the relevant or important one. Fig. 7. Confusion Matrix
154 | P a g e www.ijacsa.thesai.org
(IJACSA) International Journal of Advanced Computer Science and Applications, Vol. 7, No. 4, 2016
Fig. 8. DOS Class Features Selected and Important
Fig. 10. R2L Class Features Selected and Important
Fig. 9. Probe Class Features Selected and Important
Fig. 11. U2R Class Features Selected and Important
The analysis for feature selection has been done in terms of the class that achieved good levels of entropy or Gini index from others in the training set and the analysis of feature relevancy in the training set. The importance of a feature is computed as the (normalized) total reduction of the criterion brought by that feature. From the Figure 8, 9, 10, 11 and the Table 7 shows that the most relevant features for Dos, Probes, R2L and U2R are respectively “same_srv_rate”, “src_bytes”, “dst_host_srv_count” and “root_shell”
With the improvement the accuracy, the proposed model demonstrated that it performs well after selecting relevant features. And from the Figure 12, it is evident that the time taken to build classifier is decreased through feature selection, especially the proposed approach. Building Decision Tree classifier on the dataset with features selected by our approach takes only 0.956 seconds for DoS attack class, which is faster than building on the dataset with all of the 41 features by 14.541s as shown on Table 9.
155 | P a g e www.ijacsa.thesai.org
(IJACSA) International Journal of Advanced Computer Science and Applications, Vol. 7, No. 4, 2016 TABLE X.
Author
Fig. 12. Execution time of the classifier TABLE IX. Attack Classes Dos Probe R2L U2R
TIME TAKEN TO BUILD CLASSIFIER ON EACH FEATURE SUBSETS With all Features 15.5 seconds 3.48 seconds 3.31seconds 2.10 seconds
With selected Features 0.959 seconds 0.868 seconds 0.929 seconds 0.530 seconds
This result provided new insight using a classification learning algorithm and reduction technique to selection relevant and important feature in order to improve the accuracy detection rate of the system and to identify possible features which may contribute to this improvement. As our goal was to determine whether or not a features selection process will improve the accuracy detection of a model on different set of attacks class found in the dataset used for our experiment, each set of attacks class were treated individually as they present different characteristics and are different by nature. This decision was also made in order to identify all relevant features for each different attacks class and to compare the accuracy improvement from the original set of features. As relevant features which are appropriated to classify those different attacks class have been found, the result analysis has shown that the performance of the model has really been improved. As an example the R2L attack accuracy detection has been improvement from 97.03% to 99.88% as well as its execution time as shown on the Table 9. The Table 10 shows a comparison between our method and some previous one.
(Dhanabal & Shantharaja h 2015) [27] (Senthilnay aki et al. 2015) [28] (Zhang & Wang 2013) [29] (Alazab et al. 2012) [30] (Mukherjee & Sharma 2012) [31] (Parsazad et al. 2012) [32] (Parsazad et al. 2012) [32] (Parsazad et al. 2012) [32] (Parsazad et al. 2012) [32] The proposed method
COMPARISON WITH OTHER FEATURES SELECTION TECHNIQUES
Method used Correlatio n based Feature Selection method Optimal Genetic Algorithm
Classifi er used
Accuracy for Attack Classes (Nbr of selected features) Prob DOS R2L U2R e
J48
99.1 % (6)
98.9 % (6)
97.9 % (6)
98.7 %(6)
99.15 % (10) 99.3 % (11) 99.7 % (12)
99.0 8% (10) 97.4 % (11) 97.8 % (12)
96.50 % (10) 95.0 % (11) 91.3 % (12)
97.0 3% (10) 59.6 % (11) 97.2 % (12)
98.7% (24)
98.8 % (24)
96.1 % (24)
64% (24)
98.34 % (30)
98.3 8% (30)
97.03 % (30)
83.3 3% (30)
98.28 % (10)
98.5 0% (10)
97.79 % (20)
82.0 0% (10)
98.34 % (30)
98.9 8% (20)
97.62 % (20)
82.6 1% (20)
Knearest neighbo r
98.03 % (30)
98.9 2% (10)
98.05 % (20)
90.7 0% (20)
Decisio n Tree Classifi er
99.90 % (12)
99.8 0% (15)
99.88 % (13)
99.9 5% (11)
SVM
Sequential search
Naïve Bayes
Informatio n gain
J48
Feature vitality based Method Correlatio n Coefficien t
Naïve Bayes
Fast feature Reduction Least Square Regressio n Error Maximal Informatio n Compressi on Index Recursive Feature Eliminatio n
Knearest neighbo r Knearest neighbo r Knearest neighbo r
VI.
CONCLUSION
In this paper, the significance of using a set of relevant features with an adequate classification learning algorithm for modelling an IDS has been demonstrated.
156 | P a g e www.ijacsa.thesai.org
(IJACSA) International Journal of Advanced Computer Science and Applications, Vol. 7, No. 4, 2016
A presentation and proposition of a feature selection method which consist of a univariate features selection associated with a recursive feature elimination using a decision tree classifier to identify important features have been done. This process repeatedly builds a model placing the feature aside and then repeating the process with the remaining features until all features present in the dataset are exhausted. The evaluation the effectiveness of the method using different classification metric measurement has been made and it has been proved that by reducing the number of feature, the accuracy of the model was improved. The feature selection method proposed in this paper had achieved a high result in term of accuracy and features were identified based on information gain and ranking technique. [1]
[2]
[3]
[4]
[5] [6]
[7] [8]
[9]
[10] [11] [12]
[13]
[14] [15]
REFERENCES A. Alazab, M. Hobbs, J. Abawajy, and M. Alazab, “Using feature selection for intrusion detection system,” 2012 Int. Symp. Commun. Inf. Technol., pp. 296–301, 2012. M. P. K. Shelke, M. S. Sontakke, and A. D. Gawande, “Intrusion Detection System for Cloud Computing,” Int. J. Sci. Technol. Res., vol. 1, no. 4, pp. 67–71, 2012. S. Suthaharan and T. Panchagnula, “Relevance feature selection with data cleaning for intrusion detection system,” 2012 Proc. IEEE Southeastcon, pp. 1–6, 2012. S. Suthaharan and K. Vinnakota, “An approach for automatic selection of relevance features in intrusion detection systems,” in Proc. of the 2011 International Conference on Security and Management (SAM 11), pp. 215-219, July 18-21, 2011, Las Vegas, Nevada, USA. L. Han, "Using a Dynamic K-means Algorithm to Detect Anomaly Activities," 2011, pp. 1049-1052. R. Kohavi, et al., "KDD-Cup 2000 organizers report: peeling the onion," ACM SIGKDD Explorations Newsletter, vol. 2, pp. 86-93, 2000. I. Levin, "KDD-99 Classifier Learning Contest: LLSoft s Results Overview," SIGKDD explorations, vol. 1, pp. 67-75, 2000. J. McHugh, “Testing intrusion detection systems: a critique of the 1998 and 1999 darpa intrusion detection system evaluations as performed by lincoln laboratory,” ACM Transactions on Information and System Security, vol. 3, no. 4, pp. 262–294, 2000. M. Tavallaee, E. Bagheri, W. Lu, and A. Ghorbani, “A Detailed Analysis of the KDD CUP 99 Data Set,” Submitted to Second IEEE Symposium on Computational Intelligence for Security and Defense Applications (CISDA), 2009. KDD 99 dataset, Accessed December 2015, http://kdd.ics.uci.edu/databases/kddcup99 NSL KDD dataset, Accessed December 2015, https://github.com/defcom17/NSL_KDD P. Ghosh, C. Debnath, and D. Metia, “An Efficient Hybrid Multilevel Intrusion Detection System in Cloud Environment,” IOSR J. Comput. Eng., vol. 16, no. 4, pp. 16–26, 2014. Dhanabal, L., Dr. S.P. Shantharajah, "A Study on NSL_KDD Daaset for Intrusion Detection System Based on Classification Algorithms," International Journal of Advanced Research in Computer and Communication Engineering, vol. 4, issue 6, pp. 446-452, June 2015 C. F. Tsai, et al., "Intrusion detection by machine learning: A review," Expert Systems with Applications, vol. 36, pp. 11994-12000, 2009. V. Bolón-Canedo, et al., "Feature selection and classification in multiple class datasets: An application to KDD Cup 99 dataset," Expert Systems
with Applications, vol. 38, pp. 5947-5957, 2011. [16] F. Amiri, et al., "Improved feature selection for intrusion detection system," Journal of Network and Computer Applications, 2011. [17] Juan Wang, Qiren Yang, Dasen Ren, “An intrusion detection algorithm based on decision tree technology,” In the Proc. of IEEE Asia-Pacific Conference on Information Processing, 2009. [18] Dewan Md. Farid, Nouria Harbi, and Mohammad Zahidur Rahman, "Combining Nave Bayes and Decision Tree for Adaptive Intrusion Detection," International Journal of Network Security & Its Applications, Vol. 2, No. 2, April 2010, pp. 12-25. [19] Ektefa M, Memar S, Sidi F, Affendey L., "Intrusion detection using data mining techniques," 2010 International Conference on Information Retrieval & Knowledge Management(CAMP). 2010.doi:10.1109/infrkm.2010.5466919. [20] Geetha Ramani R, S.SivaSathya, SivaselviK, "Discriminant Analysisbased Feature Selection in KDD Intrusion Dataset," , International Journal of Computer Application VoI.31,No.ll, 2011 [21] S. Mukherjee and N. Sharma, “Intrusion Detection using Naive Bayes Classifier with Feature Reduction,” Procedia Technol., vol. 4, pp. 119– 128, 2012. [22] Bhavsar Y. B, Waghmare K. C. "Intrusion Detection System Using Data Mining Technique: Support Vector Machine," International Journal of Emerging Technology and Advanced Engineering, Vol.3, Issue 3, pp.581-586(2013). [23] O. Y. Al-Jarrah, a. Siddiqui, M. Elsalamouny, P. D. Yoo, S. Muhaidat, and K. Kim, “Machine-Learning-Based Feature Selection Techniques for Large-Scale Network Intrusion Detection,” 2014 IEEE 34th Int. Conf. Distrib. Comput. Syst. Work., pp. 177–181, 2014. [24] N. G. Relan and D. R. Patil, “Implementation of Network Intrusion Detection System using Variant of Decision Tree Algorithm,” 2015 Int. Conf. Nascent Technol. Eng. F., pp. 3–7, 2015. [25] Scikit-Learn, Accessed December 2015, http://scikitlearn.org/stable/index.html [26] V. Bol´oN-Canedo, N. S´aNchez-Maro˜no, and A. Alonso-Betanzos, “Feature selection and classification in multiple class datasets: an application to kdd cup 99 dataset,” Expert System Application, vol. 38, pp. 5947–5957, 2011. [27] Dhanabal, L., Dr. S.P. Shantharajah, "A Study on NSL_KDD Daaset for Intrusion Detection System Based on Classification Algorithms," International Journal of Advanced Research in Computer and Communication Engineering, vol. 4, issue 6, pp. 446-452, June 2015. [28] Senthilnayaki, B., Venkatalakshmi, D.K. & Kannan, D.A., " Intrusion Detection Using Optimal Genetic Feature Selection and SVM based Classifier," 2015 3rd International Conference on Signal Processing, Communication and Networking (ICSCN) Intrusion, pp.1–4. [29] Zhang, F. & Wang, D., "An Effective Feature Selection Approach for Network Intrusion Detection," 2013 Eighth International Conference on Networking, Architecture and Storage, IEEE. [30] Alazab, A. et al.," Using feature selection for intrusion detection system," 2012 International Symposium on Communications and Information Technologies (ISCIT), pp.296–301. Available at: http://ieeexplore.ieee.org/lpdocs/epic03/wrapper.htm?arnumber=638091 0. [31] Mukherjee, S. & Sharma, N., " Intrusion Detection using Naive Bayes Classifier with Feature Reduction," 2012 Procedia Technology, 4, pp.119–128. Available at: http://dx.doi.org/10.1016/j.protcy.2012.05.017. [32] Parsazad, S., Saboori, E. & Allahyar, " Fast Feature Reduction in intrusion detection datasets, " MIPRO 2012 Proceedings of the 35th International Convention, pp.1023–1029.
157 | P a g e www.ijacsa.thesai.org