A Time-based Visualization for Web User Classification in Social Networks Andrew S Brunker1, Quang Vinh Nguyen2, Anthony J Maeder1, Rhys Tague1, Gregory S Kolt3, Trevor N Savage3, Corneel Vandelanotte4, Mitch J Duncan4, Cristina M Caperchione5, Richard R Rosenkranz6, Anetta Van Itallie4 and W Kerry Mummery7 1 2
School of Computing, Engineering and Mathematics, University of Western Sydney
MARCS Institute & School of Computing, Engineering and Mathematics, University of Western Sydney 3 4
School of Science and Health, University of Western Sydney
Institute for Health and Social Science Research, Central Queensland University
5
School of Health and Exercise Sciences, University of British Columbia, Canada 6 7
College of Human Ecology, Kansas State University, USA
Faculty of Physical Education and Recreation, University of Alberta, Canada
[email protected]
ABSTRACT
inappropriately [9]. This can be linked with the rapid growth of technologies and applications on the current Internet (web 2.0).
This paper presents a new visual analytics framework for analyzing health-related physical activity data. Existing techniques mostly rely on node-links visualizations to represent the usage patterns as social networks. This work takes a different approach that provides interactive scatter-plot visualizations on classified and time-based data. By providing a flexible visualization that can provide different angles on the multidimensional and classified data, the analyst could have better understanding and insight on web user behavior compared to the traditional social network methods. The effectiveness of our method has been demonstrated with a case study on an online portal system for tracking passive physical activity, called Walk 2.0.
These applications are much more interactive, visual and socially oriented. Incorporating sites and tools that include blogs, wikis and social networks. Interventions relating to physical activity delivered via the internet have been considered as a new approach to promote health [10]. The internet is an excellent medium for communicating messages that can increase physical activity in the general population; in addition to its potentiality for wide population reach [11]. Online environments incorporating social interaction offer a user freedom in creating, manipulating and disseminating information. This freedom is enhanced by allowing multiple interaction paths, and methods of user feedback. Although social networking is a broad and dominate research domain, that has been increasing, there has been little work on the visualization of user classification.
Categories and Subject Descriptors H.1.2 [User/Machine Systems], H.5.2 [User Interfaces].
There is a need for studies with social networking data to find insight of information, discover relationships and identify nontrivial structures and irregularities. These studies produce data that is required to be analyzed through the use of statistics, data mining, visualization or other methods. Among these, visualization has been considered as a major component for visual analytics, independently or supportively to automate data analysis [18]. Basic statistics and visualizations without effective interaction and capabilities to control the visual data mining process are often insufficient for the analysis and exploration processes [12].
General Terms Algorithms, Human Factors.
Keywords Information visualization, visual analytics, physical activity, classification, scatter plot.
1. INTRODUCTION We currently live in a world where data is being produced in rapidly increasing volumes every day. Leading to an information overload problem, referring to data that may be irrelevant for the desired task along with data being processed and presented Permission to make digital or hard copies of all or part of this work for Permission to make digital hard copies offee all provided or part ofthat thiscopies work are for personal or classroom use isor granted without personal or classroom use is granted without fee provided that copies are not made profit or commercial advantage and that not made orordistributed distributedforfor profit or commercial advantage andcopies that bear thisbear notice the full the firstonpage. Copyrights for copy copies thisand notice andcitation the fullon citation the first page. To otherwise, to postbyonothers servers to redistribute to lists, componentsorofrepublish, this work owned thanorACM must be honored. requires priorwith specific and/or a fee.otherwise, or republish, to Abstracting creditpermission is permitted. To copy VINCI 2014, August 5-8, 2014, Sydney, Australia. post on servers or to redistribute to lists, requires prior specific permission Copyright 2014 ACM 978-1-4503-2765-7… $10.00 and/or a fee. Request permissions from
[email protected]. VINCI '14, August 05 - 08 2014, Sydney, NSW, Australia Copyright 2014 ACM 978-1-4503-2765-7/14/08…$15.00. http://dx.doi.org/10.1145/2636240.2636842
This paper presents a visual analytics framework for analyzing web user behavior in a social network from health-related physical activity. The system consists of a multidimensional and interactive visualization for analyzing web user data resulting from the classification processing. Unlike available techniques which use node-link diagrams to visualize social network data, we adopt an interactive scatter plot approach to provide different views for attributes upon the mappings. Scatter-plot with time-
98
matrix, linked histograms, Mosaic plots, Glyphs, Icons and others[1]. Among them, attributed scatter plots method is considered as one of the best method for visualizing datasets with low number of dimensions. The visualization can convey overall impression of relationship between two and more variables in the space. We have adopted an attributed scatter plot approach, similar to that shown in TabuVis [13], where by attaining the data in a tabular form from the given database/s and associated Google Analytics data, we are able to present the classified data in a scatter plot that is suitable for the display and analysis of the data, in turn enabling various patterns to be visually displayed. Like TabuVis, its innovation lies on the ability to providing easy-to-use yet effective way to view multidimensional data at different angles by mapping various attributes to different visual properties.
based visualization was employed in our development based on its effectiveness on providing contextual views of entire population on different angles and detail views based on selection criteria.
2. RELATED WORK Interactive visualization has been recognized as one of best tools for enhancing the discovery and human understanding of implicit structures and hidden semantics extracted from large social networks. Social network visualizations have been receiving attention from the research community since late 1990s. A comprehensive survey on social network visualization techniques from the sociology perspectives were presented by Freeman [6]. Noticeably, recent social network visualization techniques are Visual Analysis of Large Heterogeneous Social Networks [15], Vizster [8], Pajek [3], NusEye [4] and Social Network Analysis with Treemaps [5]. Social network visualization techniques usually use node-link diagrams to show the connectivity among elements. The layout of a network is usually calculated using a graph drawing algorithm, such as those in the work produced by Battista et al. [7].
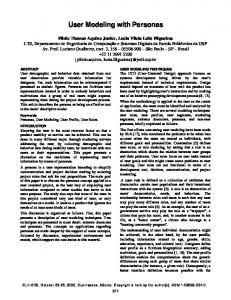
3. FRAMEWORK Data
Classification
Database
Selected Date Classification System
Time-based visualization techniques for representing dynamically changing user behavior, through the refinement of user objectives and the emergence of relationships, can show how a user’s actions and interactions change over time and thus how they change from one class to another. Visualization can be used to amplify the characterization of web applications usage patterns associated with social networks.
Tabular Data
Extracted Properties
Interactive Visualization
Knowledge Discovery
Interaction, filtering and control
Perception
Mapping Attributes to Visual Property
Exploration and Analysis
Knowledge
Figure 1. Framework diagram The framework adopted uses four modules, described as follows: Data: Data collected is from two sources, an environment database, and sessional data that has been monitored and extracted from Google Analytics. Within this context we have applied data collected from Walk 2.0 and pertains to activities such as, logging in, sending or responding to a message or commenting on a post from another participant to name a few. The data collected from the Google analytics data pertains to each user’s session length for each login.
Visualizations have been successfully used to enhance the navigation and analysis of personal health histories, such as [15]. These techniques provide an interactive visualization platform for clinical patient records in which health problems, diagnoses, test results and medications are represented as dots and lines. Bui et al presented a TimeLine system [4] that provides a temporal visualization for medical records, in which the data can be reorganized around medical disease entities and conditions. Zheng et al. investigates user interactions with electronic health records (EHRs) to uncover hidden navigational patterns in the data sets [19].
Classification: This process is used to collate the data that has been collected for each participant. This collated data is then used by the categorization system, to provide classification of a given user into one of three behavioral stereotypes, and assigns a marker for a user in an inactive state. The user can interact with the calculations performed somewhat, through the use of the date slider.
Some visualization techniques for health-related multivariate time series are presented at[2,13,15]. Ordonez et al.’s technique provides a set of desired state for patients for comparison purposes and it uses Star-Plots in an attempt to display concurrently vital signs [14]. Unfortunately, the use of Star-Plots can create an overlapping problem as multiple lines are drawn along the circular axes. Andry et al.[2] presents a web-based highly interactive graphics environment that provides an easy and pleasant way for viewers to browse through patient historical data. This technique cleverly applies design principles that present a selected vital sign or multiple vital signs as multiple graphs. Unfortunately, the authors do not provide an interactive visualization implementation with a concurrent view of all vital signs in the patient data histories. On the other hand, Tague et al.[17] present an interactive visualization of signs in patient data histories using multiple graphical lines and traffic light colors. Although the above methods are effective in their own applications, they are not designed for the analysis of healthrelated physical activity, particularly for classified information relating to social networks.
Visualization: In order to present the collated and calculated results from the analysis process in a clear, concise, easily interpretable and user friendly manner, a visualization process is required. The visualization process provides date filtering of the supplied data and axis mapping, in order for the analyst to attain their desired view of the data. Knowledge Discovery / Analysis: An appropriately chosen visualization will assist the analyst to gain an understanding of the data, allowing the construction of knowledge through visual perception and reasoning capabilities. Analysts who work within the relevant domain, should be able to, through their interactions, explore the data through various views, to make further discovery of underlying patterns in the data. The behavioral stereotypes chosen align with three user categories identified in the work done by Tague et al [16]. The tools (or widgets) of the target web application were associated with the user classes based on their overall functionality. The resulting stereotypes included in the framework are as follows:
The classified data from the social network are normally produced with multivariate data. There are various approaches to visualize of such information by mapping onto 2D or 3D space as attributed scatter plots, parallel coordinate plots, star plots, scatter-plot
99
Publisher: A publisher is a user who carries out an action resulting in an original publication of content or interaction to a medium. For instance, a user posts to a status stream in their online user profile for other users to make comment.
The visualization display includes four panels within the layout, including a mapping panel, main panel for the visual presentation, details panel for a particular item and a date slider. (See Figure 2) The mapping panel - is located on the left hand side of the display. This particular panel is responsible for enabling the user to choose what available data attributes to map to the axis of the visualization, through the use of interactive drop-down menus. The values of the axis range from the smallest value (zero) to the largest value (of the mapping attribute). There are several possible attributes to map to either the x-axis or the y-axis, as follows:
Annotator: An annotator is a user who uses a tool to annotate or add meaning through publication to an existing or original publication. For instance, a user provides a “Thumbs Up” to a stream item for the purpose to notify another user they like or enjoyed their content. Lurker: A lurker is a user who actively consumes media yet does not carry out the behavior of Publisher or Annotator during a particular session. They are an active user for the purpose of reading rather than contribution.
1) 2)
Inactive State: An inactive user is a marker for a user who registered and not provided any kind of interaction thereafter, or a user who has not provided interaction via tools, widgets or sessions for .an extended period of time, such as a month.
3)
3.1 Classification System During the classification process, there are calculations that are performed: 1)
2)
3)
4) 5)
Publisher Value: The publisher value for each participant is a tally/count of all the actions performed by the participant to the selected date. These actions incorporate the initiation of a message to one or more participants and posting to their profile or stream. Annotator Value: The annotator value for each participant is a tally/count of all the actions performed by the participant that fulfill the above requirements outlined for an annotator. Lurker Value: The lurker value for each participant is a tally/count of all the times a participant has logged in, browsed around and performed nothing else during their session.
6)
The particular shape that a participant’s node is assigned, depends on the classification that the user has been assigned to (from the classification system), at that given time/date. Each classification is assigned its own unique shape: publishers being assigned a circle (●), annotators are assigned a square (■), and lurkers are assigned a diamond (♦) and inactive participants are assigned a cross (×). This panel also contains detail descriptions about the given attributes that have been mapped to their respective axis, which update when a given axis has its attribute changed.
This classification process coupled with the date slider tool and ability to change the mapped attributes for the axis, gives the ability to track a user of interest over time and to learn whether the actions that the user has performed have changed over a given period of time.
Figure 2 illustrates an example of a visualization corresponding to the mapping of attributes: x-axis is the user’s computed identification, y-axis is the average time on site, and shape corresponds to their behavioral stereotypes (circle (●): publisher, square (■): annotator, diamond (♦): lurker and cross (×): inactive). Although the colors can be used to map an attribute, we also use colors to emphasize the stereotypes. In the visualization, user identification is linear to the joined date. Therefore, the identification numbers can also be used to indicate the property of joining sequence at a particular given period. For example, the figure shows that the selected participant is a publisher who joins the study at later time period and had an increased average time on site. Figure 3 shows the view when total time is mapped to yaxis. It illustrates clearly that the selected participant has moved to the top of the y-axis on the scatter plot, indicating their total time (in seconds) spent on the site is the highest out of all the registered users as of the 10/12/2013.Although this is the case, this doesn’t mean that the selected participant will have the highest value in the average time attribute.
3.2 Interactive Visualization Main panel
Date slider Mapping panel
User Index: A value derived to uniquely enumerate the participants, preserving their anonymity. Total Time: The computed value of the total time (in seconds) that the participant has spent on the site, to the chosen date, derived from the Google analytics data. Average Time: The computed value of the average time (in seconds of the total amount of sessions) that the participant has spent on the site, to the chosen date, derived from the Google analytics data. Publisher: The computed publisher value for the participants derived from the classification system. Annotator: The computed annotator value for the participants derived from the classification system. Lurker: The computed lurker value for the participants derived from the classification system.
Details panel
The main visualization panel - is located at the center of the display, and is the largest of the three panels. It displays the required content, and details of the scatter-plot visualization, using the required attributes. This panel also allows the user to interact with the displayed points on the graph, through a click event which updates the details in the details panel.
Figure 2: A visualization of classified data when an item is selected, showing four panels: mapping panel, main panel, details panel and date slider.
100
Figure 3: A visualization when the mapping at Figure 2 is changed to average time (x-axis) against total time (y-axis). The view also shows the same selected item as in Figure 2.
Figure 4: A visualization when mapping the annotator value (x-axis) against the average time (y-axis) at a later date on the experiment. The same participant is also selected. 2)
The details panel - is located on the right hand side of the display. This panel is responsible for displaying the details relating to a selected node. This is updated automatically when a node is either selected or deselected, as follows:If no nodes are selected the panel will contain no information and is blank. If a node is selected (Figures 2) the following details about the given node will be displayed: 1)
3)
User ID: The anonymized identifier of the user.
101
Classification: will show one of the following classifications the user has fallen in to, determined by the classification system. i. Publisher ii. Annotator iii. Lurker iv. Inactive Publisher Value: Computed publisher value for the user, derived from the classification system.
4)
Annotator Value: Computed annotator value for the user, derived from the classification system. 5) Lurker Value: Computed lurker value for the user, derived from the classification system All details displayed about the selected node requiring calculations are defined up to and including the selected date (as defined by the value provided by the date slider).
•
Date slider – is located underneath the main visualization. This date slider allows the user to change the active visualization to a corresponding date or a period of time. The visualization is recalculated to reflect the change. For example, Figure 4 shows a visualization of when mapping the annotator value (x-axis) against the average time (y-axis) on 22/03/2013. In this example, the date slider contains all the dates as stated section 3.2 from the introduction of Google analytics to the Walk 2.0 website on the 22/02/2011 to the 10/12/2013.
The data set resulted in a total of 60,973 records to be passed through the classification component, with 10% coming from the Google Analytics sessional data, and the other 90% coming from the Walk 2.0 project (from 22/02/2011 until 10/12/2013).
•
Shown below is a small sample of the interaction data collected in relation to participant’s commenting on a post (Figure 5) along with a sample of the Google analytics sessional data (Figure 6).
4. CASE STUDY: ANALYZING WALK 2.0’s DATA 4.1 Walk 2.0 The Walk 2.0 project is an online portal to allow users to generate and collaborate for the purpose of increasing health-related physical activity. This collaborative process is achieved through “Web 2.0” based tools and widgets, promoting personalized modes of behavior when interacting with other users in a social networking setting. The online portal is one part of a 3-arm randomized controlled trial study investigating how such tools and widgets can be effective to deliver a health promotion intervention for physical activity and health-related quality of life (HRQL) [10]. For this work only the interaction variables of anonymized users in the Walk 2.0 online portal trial arm will be used to demonstrate the various modes of behavior undertaken by the user base. • • • •
Interaction data relating to actual interaction output, such as status update content, a blog post or comments on other posts. Google Analytics sessional data relating to sessional variables, such as session length and average time of session.
User
Date and time of comment
23
2011-04-20 12:04:33
22
2011-04-20 12:22:56
23
2011-04-20 12:34:50
22
2011-04-20 12:38:16
9
2011-04-29 12:17:34
9
2011-04-29 12:18:07
Figure 5: Sample of the interaction data relating to users commenting on a post with the following respective fields: Users ID, date of posting, clock time of posting.
Research Trial Participants Project Investigators/Researchers Social network seeders/Research Assistants General Population
100
20131208
1
246.0
246.0
100
20131209
1
0.0
0.0
100
20131210
1
0.0
0.0
101
20130213
1
353.0
353.0
101
20130215
1
571.0
571.0
101
20130308
1
738.0
738.0
Figure 6: Sample of Google Analytics sessional data with the following respective fields: Users ID, date of login, number of pages viewed, total time logged in and the average time spent on each page (times are measured in seconds).
Research trial participants can be split into two subgroups; a randomized control trial and an ecological trial. The first is a group of participants who have been actively recruited by the investigators/researchers and randomized into one of the 3 different trial arms (one of which uses the Walk 2.0 portal), and the second are those participants who have organically arrived at the research registration and are randomized into one of the trial arms.
4.3 Visual Analysis and Discussion Through the exploration of the Walk 2.0 data, when mapping the users index value against the users publishing value we are able to deduce through simple visual observations that the amount of times a user has produced new material, is proportional to the length of time that they have been registered on the social network (figure 7).
Project Investigators/Researchers comprises individuals who contributed to the design and development of the site. They were also active participants in the creation of initial content and were encouraged to participate on the online portal throughout the project.
Using the same mapping we are also able to discover when selecting a particular user, in this case we have selected the user of index 86 at random, you are able to see changes in the users classification over time. This could be from a wide range of permutations of the classifications. On the 10/12/2013 we can see that user 86 is classified as being inactive (figure 7), compared to that of the 08/02/2013 where the user is shown as being classified as a publisher (figure 8). Over this approximately 10 month time period we can also see that user 86 has increased their publishing count by approximately 214%, from 290 to 621, along with increasing their annotating count by 700%, from 0 to 7.
Social network seeders/Research assistants were used for the purpose of stimulating and encouraging interaction in the portal with the main goal to seed interaction from the user base. The final group of users is General Population participants who have been invited to the portal by an existing participant and have not gone through a randomized registration.
4.2 Classified Data Two sources of data have been acquired via the Walk 2.0 Project:
102
Through the use of the date slider we are also able to visualize the growth of the social network, from the 22/02/2011 to the 10/12/2013, through mapping any given value against the number of registered users at any given point in time (figures 7 to 9). Shown through the number of users on the 22/02/2011 being 18 (figure 9) through to the 10/12/2013 with the number of users standing at 705 (figure 7).
month or two after registration, if the user does not interact with the site regularly. This is the case for participants 58 and 63 (figure 10). In the case of participant number 58, we are able to deduce from their interaction with the social network that from the date of registration (26/07/2012), they have been through all classifications, starting as a lurker, then a publisher, followed by an annotator and finally inactive (figure 11).
During the life cycle of Walk 2.0 (from start to finish and any given date in between) we have discovered that there are a very limited number of participants who are classified as an annotator at any given time, if none at all. The only case where we can see a participant/s as being classified as an annotator is around the first
Although this is the case for users classified as an annotator, the annotator value for a given participant will still increase over time, yet will not catch up to their publishing value, so long as the user is not deemed to be in an inactive state.
Figure 7: Mapping of the number of users against their respective publishing value as of the 10/12/2013, with a drawn line showing the relationship between the length of time on the network and the users publishing value. User number 86 selected.
Figure 8: Mapping of the number of users against each users' publishing value as of the 08/02/2013, with user number 86 selected.
103
Figure 9: Mapping of the number of users against each users' lurker value on 22/02/2011, with the very first user selected (User 0).
Figure 10: Snapshot of the social network on the 16/09/2012 showing users 58 and 63 as being classified as annotators.
5. Validation of the Framework The framework will be validated by researchers and investigators tied to the applied case study, Walk 2.0 along with researchers within the Telehealth Research and Innovation Laboratory (THRIL), at the University of Western Sydney, Australia. The participants will each use the framework individually, therefore there will be no cross influence on a user’s understanding and discovery during the exploration of the multivariate data from the case study. Questionnaires will be undertaken after the participant has had time to explore the data through the use of the framework, in order to determine if they were able to draw any conclusions or stories from the supplied data, compared to looking directly at the raw data. Along with feedback on the usability of the framework its self, for the reason being that having a visualization that performs well yet is frustrating to use, is not always better than implementing a traditional approach of sifting through raw data.
Figure 11: Five snapshots of the details panel from the 06/08/2012 – 27/12/2012 showing user 58 falling into each of the four categories.
104
This will allow for a comparison between the two methods, to determine if the framework is better at assisting in the understanding of the data.
[8] Heer, J. and Boyd, D. Vizster: Visualizing online social networks. Proceedings - IEEE Symposium on Information Visualization, INFO VIS, (2005), 33–40.
6. CONCLUSIONS
[9] Keim, D., Andrienko, G., Fekete, J.D., Gorg, C., Kohlhammer, J., and Melancon, G. Visual analytics: Definition, process, and challenges. Lecture Notes in Computer Science, (2008), 154–175.
This paper presents a visual analytics framework that has been developed for classifying web user behavior. It has been applied to an example case using sample data derived from the Walk 2.0 project. Through the use of simple yet effective user oriented choices for mapping attributes onto visualization properties, classified data sets shown and adjustable date control, the analyst is able to have a more robust and dynamic rather than static view of the development of the overall patterns of web user behavior. This could lead to the identification of regular and irregular patterns and persistence of user types in a social network setting.
[10] Kolt, G.S., Rosenkranz, R.R., Savage, T.N., et al. WALK 2.0 - using Web 2.0 applications to promote health-related physical activity: a randomised controlled trial protocol. BMC public health 13, (2013), 436. [11] Mummery, W.K., Schofield, G., Hinchliffe, A., Joyner, K., and Brown, W. Dissemination of a community-based physical activity project: The case of 10,000 steps. Journal of Science and Medicine in Sport 9, (2006), 424–430.
The preliminary case study has proved its effectiveness on using interactive scatter-plot visualization for exploring web user behavior. We will next carry out a formal usability study to evaluate the effectiveness of our technique on other datasets and application
[12] Nguyen, Q.V., Nelmes, G., Huang, M.L., Simoff, S., and Catchpoole, D. Interactive Visualization for Patient-toPatient Comparison. Genomics & informatics 12, 1 (2014), 21–34.
7. REFERENCES
[13] Nguyen, Q.V., Qian, Y., Huang, M., and Zhang, J. TabuVis: A tool for visual analytics multidimensional datasets. Science China Information Sciences 56, 5 (2013), 1–12.
[1] Aigner, W., Miksch, S., Schumann, H., and Tominski, C. Visualization of Time-Oriented Data. 2011.
[14] Ordóñez, P., DesJardins, M., Feltes, C., Lehmann, C.U., and Fackler, J. Visualizing multivariate time series data to detect specific medical conditions. AMIA ... Annual Symposium proceedings / AMIA Symposium. AMIA Symposium, (2008), 530–534.
[2] Andry, F., Naval, G., Nicholson, D., and Lee, M. Data Visualization in a Personal Health Record using Rich Internet Application Graphic Components. HEALTHINF, (2009), 111–116. [3] Batagelj, V. and Mrvar, A. PAJEK ANALYSIS AND VISUALIZATION OF LARGE NETWORKS. Science 2265, (2003), 8–11.
[15] Shen, Z., Ma, K.L., and Eliassi-Rad, T. Visual analysis of large heterogeneous social networks by semantic and structural abstraction. IEEE Transactions on Visualization and Computer Graphics 12, (2006), 1427–1439.
[4] Dennis, B.M. and Jarrett, A.C. NusEye: Visualizing Network Structure to Support Navigation of Aggregated Content. Proceedings of the 38th Annual Hawaii International Conference on System Sciences, (2005).
[16] Tague, R., Maeder, A., and Basilakis, J. Adaptive Web Framework for Online Collaborative Environments. 13, 4, 13–17.
[5] Frantz, T.L. and Carley, K.M. Treemaps as a Tool for Social Network Analysis. Security, (2005), 2–22.
[17] Tague, R., Maeder, A.J., and Nguyen, Q.V. Time-based interactive visualisation of vital signs. Studies in Health Technology and Informatics, (2010), 169–178.
[6] Freeman, L.C. Visualizing Social Networks. Journal of Social Structure 1, (2000), [np].
[18] Thomas, J.J. and Cook, K.A. Illuminating the path: The research and development agenda for visual analytics. 2005.
[7] Gd, B., Eades, P., Tamassia, R., and Tollis, I.G. Graph Drawing: Algorithms for the Visualisation of Graphs. Prentice Hall, 1999.
[19] Zheng, K., Padman, R., Johnson, M.P., and Diamond, H.S. An Interface-driven Analysis of User Interactions with an Electronic Health Records System. Journal of the American Medical Informatics Association 16, (2009), 228–237.
105