A time-respecting null model to explore the structure of growing networks Zhuo-Ming Ren,1 Manuel Sebastian Mariani,1, ∗ Yi-Cheng Zhang,1 and Mat´ uˇs Medo1, 2, †
arXiv:1703.07656v1 [physics.soc-ph] 22 Mar 2017
2
1 Department of Physics, University of Fribourg, 1700 Fribourg, Switzerland Department of Radiation Oncology, Inselspital, Bern University Hospital and University of Bern, 3010 Bern, Switzerland
A major challenge in network science is to determine whether an observed network property reveals some non-trivial behavior of the network’s nodes, or if it is a consequence of the network’s elementary properties. Statistical null models serve this purpose by producing random networks whilst keeping chosen network’s properties fixed. While there is increasing interest in networks that evolve in time, we still lack a robust time-aware framework to assess the statistical significance of the observed structural properties of growing networks. We fill this gap by introducing a null model that, differently from static models, preserves both the network’s degree sequence and the individual nodes’ degree time-series. By preserving the temporal linking patterns of the real systems it is applied to, the proposed model disentangles structural from temporal patterns. As a consequence, it allows us to properly assess the significance of structural properties in settings where temporal patterns heavily impact the outcomes of structural measurements, which is the case for a wide range of real networks. We apply the model to real citation networks to explore the significance of widely studied network properties such as degree-degree correlations and the relations between popular node centrality metrics. The proposed model can be used to assess the significance of structural properties for any growing network.
I.
INTRODUCTION
Complex networks [1, 2] have emerged as one of the leading frameworks to describe complex social, economic and information systems. In the last two decades, the network approach to complex systems has provided novel insights into various real-world problems, including understanding the growth of information systems [3–5], identifying influential spreaders [6–8], predicting the hitting time of an infectious disease [9, 10]. One of the central problems in network analysis is to assess whether an observed network property is a manifestation of a nontrivial phenomenon induced by the network’s structure, a statistical consequence of the network’s basic properties, or even a random fluctuation. For example, various community detection techniques [11] – such as the popular modularity optimization [12, 13] – rely on quantifying how much the observed number of edges within a given set of nodes deviates from its expected value under a certain null model. Network null models [14–19] serve this purpose by fixing one or more network properties while randomizing the rest. These null models turn out to be essential for the detection of network organizational patterns such as communities [12, 20], rich clubs [21], motifs [22], and nestedness [23]. Despite the growing interest in the temporal evolution of complex networks [5, 24–28], commonly used null models only focus on preserving structural network properties [15, 18] and neglect the temporal patterns entirely. We show that this omission results in model-generated networks that exhibit highly unrealistic features, which impairs their reliability as baselines to assess the significance of observed network properties. To overcome
∗ †
[email protected] [email protected]
this shortcoming, we introduce a time-aware null model, referred to as the dynamic configuration model (DCM), which preserves not only the node degree sequence, but also the temporal linking patterns. The dynamic configuration model allows us to construct networks where each node has similar degree trajectory k(t) as in the real evolving network. We use two datasets – the citation network among the papers published by American Physical Society journals and the inspiration network of US movies (hereafter referred to as Papers and Movies, respectively) – to show that differently from the static configuration model, the dynamic configuration model accurately reproduces temporal linking patterns of the real networks. Differently from existing null models, by preserving the temporal linking patterns of the original network, the proposed model allows us to assess the significance of network structural properties also in settings where termporal patterns significantly affect structural measurements, which is the case for a wide range of real systems [25, 26, 28–32]. We apply the dynamic configuration model to three classes of network properties: (1) degree-degree correlations, (2) correlations between centrality metrics, (3) centrality metrics’ ability to uncover significant nodes in the network. We find that for the movie-movie citation network, the observed real properties can be largely explained by the dynamic configuration model. This indicates that the movie citation network can be viewed as structurally random. By contrast, the paper citation network is found to show patterns that cannot be explained by existing network models, which calls for new mechanistic models of the citation network growth. The provided results are examples; the proposed dynamic configuration model can be applied to assess the significance of any structural network property in any evolving network.
2 II.
NETWORK NULL MODELS
A null model specifies the set of network properties to be kept fixed while randomizing the rest. The classical configuration model (CM, paragraph II A) preserves the degree sequence {kiin , kiout } where kiin and kiout are the indegree and out-degree of node i. Since the CM ignores the time structure of the network, the networks it produces exhibit unrealistic features (see paragraph II A), such as a substantial fraction of links pointing forward in time whereas in the two real networks studied here, all links point back in time. The dynamic configuration model (DCM, paragraph II B) preserves not only the degree sequence, but also the nodes’ degree trajectories. The networks produced with the DCM thus accurately reproduce the network’s temporal linking patterns. A.
Configuration model (CM)
For a directed network, the (static) configuration model (CM) [1] generates directed random networks with given in- an out-degree sequences {kiout } and {kiin }. To this end, each node i is endowed with kiout outgoing-edge stubs and kiin incoming-edge stubs. A realization of the CM is formed by consecutively forming pairs of nodes with remaining stubs (always an out-stub with an instub) until there is no node with out- or in-going stubs left. The random matching can generate self-loops and multiple edges. However, for large networks they constitute only a small fraction of the total number of edges and therefore they can be safely discarded [1]. Given a real directed network G and its degree sequences {k in } and {k out }, one can use the CM to generate maximally randomized networks with the same in- and out-degree sequences as G; the resulting randomized networks serve as a null model for patterns observed in the real network. The randomized networks obtained with the CM from G as are referred to as G’s CM-randomized networks. B.
Dynamic configuration model (DCM)
To amend the CM’s ignorance of the time information, we introduce the dynamic configuration model (DCM). We formulate the DCM for directed networks; adapting it to undirected networks is trivial. The DCM generates networks with fixed in- and out-degree time series (the final in- and out-degree values are thus automatically as the last points of the degree time series’). To this end, the system’s time span T is divided into L temporal layers of equal duration ∆T = T /L. The inand out-degree time series are defined as the sequences in out of in- and out-degree variations {∆ki,n , ∆ki,n }, respecout in tively, where ∆ki,n and ∆ki,n represent the change of inand out-degree of node i, respectively, within the temporal layer n (n = 1, . . . , L). A realization of the DCM is formed by individual layers, where in layer n we assign
out in outgoing stubs to each node incoming and ∆ki,n ∆ki,n i, and match the in- and out-stubs at random. The corresponding probability that nodes i and j are connected by a directed edge i → j in the temporal layer n is
P (i → j, n) =
out in ∆ki,n ∆kj,n En
(1)
where En is the number of edges in the temporal layer n. Multiple edges and self-loops are discarded. Note that when L = 1 (one layer limit), the DCM reduces to the CM. This model is similar in spirit to that used in [20] for a complicated setting (a multilayer network with community structure). We focus here on the simplest possible setting of a growing directed network which is thus applicable to a broad range of systems. Given a real directed network and its degree time-series in out {∆ki,n } and {∆ki,n }, one can use the DCM to generate maximally randomized networks with the same in- and out-degree time-series as the real network under consideration. These networks then serve as a null model for both static and temporal patterns observed in the real network. The randomized networks obtained with the DCM from G as referred to as G’s DCM-randomized networks. The number of temporal layers, L, is the sole parameter of the DCM model. While we only apply the DCM to citation networks, the model can be easily extended to temporal networks [24] where pairs of nodes can interact multiple times. C.
The DCM preserves real-data temporal linking patterns
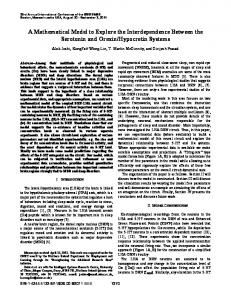
Figure 1a,b compares the distribution of the edges’ time lag in randomized networks obtained with the CM and the DCM with that found in the real data. The time lag of a directed edge i → j is defined simply as ti − tj , where ti denotes the time at which node i enters the system (the paper publication time and the movie release time for Papers and Movies, respectively). In both real datasets, links always point back time; the time lag values are thus constrained to be positive. The CM networks show a much different pattern with a substantial fraction of links violating the original time ordering (In the CM, the fraction of forward links is 32.41% and 17.93% for Papers and Movies, respectively). This is a direct consequence of the CM’s ignorance of the temporal dimension which is shared by a number of existing null models. Some links with negative time lag are produced also by the DCM but their fraction quickly diminishes as L grows and the time lag distribution approaches to that of the real network. To quantify the difference between the edge time lag distribution in real data, Preal (∆t), and in DCMrandomized networks, PDCM (∆t), we calculate the L1 distance X Preal (t) − PDCM (t) d(Preal , PDCM ) = (2) t
3 (a) Papers
(b) Movies
-2
10
-2
10 PDF
PDF
-4
10
CM L=2 L=5 L=10 L=100 Real
-6
10
-8
10 -120
-60
0 t
CM L=2 L=5 L=10 L=100 Real
-4
10
-6
60
120
10 -120
-60
0
60
120
t
FIG. 1. (Color online) Distribution of the edge temporal lag ∆t, where ∆tij = ti − tj for a directed edge i → j, for (a) Papers and (b) Movies. Results are shown for the real data, the configuration model (CM), and the dynamic configuration model with various layer counts L. 0
0
10
10
d(preal,pDCM)
d(preal,pDCM)
-2
10
-4
10
-1
10
-2
10
(a) Papers
(b) Movies
-6
10
0
10
1
10
4
2
10 L
3
10
4
0
10
10 4
10
10 L
1
10
2
1
10
10
S[PDCM]
S[PDCM]
3
10
2
10
3
10
(d) Movies
(c) Papers 1
10 0 10
2
1
10
2
10
3
10
4
10
10 0 10
2
10
L
L
FIG. 2. (Color online) Distance d(Preal , PDCM ) between the time-lag distribution in the real and DCM-generated data for (a) Papers and (b) Movies. Entropy S(PDCM ) of the dynamic configuration model as a function of the number of temporal layers L (L = 1 corresponds to the configuration model) for (c) Papers and (d) Movies.
where we uniformly divide the time-lag axis into bins of one-year duration and sum over all of them. As shown in Figure 2a,b, the distance d(Preal , PDCM ) monotonously decreases with L. This is an expected result because the edge time lag error introduced by the DCM, which is at most 2∆T , decreases with the number of layers. While this result might suggest that one should choose L values as large as possible, large L corresponds to short duration of individual layers which consequently leaves little space for randomness and limits the statistical significance of thus-obtained results. In the extreme case of temporal layers containing only one edge each, randomness has no
place and the DCM-randomized network is by definition identical with the input real network. To quantify the level of randomness in the model-generated networks, we measure the entropy of the dynamic configuration model, defined as S(PDCM ) = −
L X X PDCM (i → j, n) n=1 i,j
En
log
PDCM (i → j, n) . En
(3) which generally decreases with L (Figs. 2c-d). We set L = 100 for both Papers and Movies, which avoids two extremes: unrealistic temporal patterns for
4 too small L, and too small randomness for too large L. At the chosen value of L, PDCM matches well the real time-lag distribution and yields substantial model entropy. It remains open whether one can devise a general statistically-grounded criterion to choose the value of L. Nevertheless, the presented results obtained with the DCM do not alter qualitatively when L changes, which suggests that the problem of finding an optimal value of L is not essential for practical purposes. Our results are based on ten independent realizations of the DCM.
III. USING THE DCM TO ASSESS THE SIGNIFICANCE OF NETWORK PROPERTIES
In this section, we apply the DCM to assess the significance of three distinct network properties: (1) degreedegree correlations, (2) correlations between node centrality metrics, and (3) performance of node centrality metrics in identifying significant nodes.
A.
Degree-degree correlations
The degree-degree correlation is usually visualized by the assortativity plot [33] which displays the average degree of a node’s neighbors as a function of the node degree. Out of the various possible options for degreedegree correlation in directed networks [34], we focus here on two distinct cases: the indegree-indegree dependence between a node and the nodes it points to (cited nodes), as well as the nodes it is pointed by (citing nodes). The Papers network exhibits a clear assortative pattern in both cases and this pattern cannot be explained by the DCM (see Fig. 3a, c). Note that the possible interpretations of these two cases are different: while panel (a) suggests that little cited papers are cited by other little cited papers, panel (b) suggests that the authors of highly cited papers choose and cite other highly cited papers. By contrast, no significant indegree-indegree correlation are found in the Movies network and the same is true for its DCM-randomized networks. Degree-degree correlations impact, among others, the correlations between different node centrality metrics. For uncorrelated networks, for example, PageRank score is on average expected to be proportional to indegree (in other words, PageRank score carries no more information than node indegree). A similar result holds for the node H-index introduced in [35]: the H-index of a node is highly correlated with node indegree for uncorrelated networks [36]. We shall discuss the implications of the DCM on the indegree-PageRank relation in the following sections.
B.
Relations between node centrality metrics
While prior studies [30, 37–40] have reported the values of indegree-PageRank correlations measured in real data, whether the observed correlations are large or small is often discussed without any reference to a suitable null model. We use here DCM-randomized networks to assess whether correlations between network metrics of structural importance can be explained by degree dynamics or not. Consider the vectors s1 and s2 of scores produced by two different metrics, and suppose that we are interested in the linear Pearson correlation r(s1 , s2 ) between the two score vectors. We estimate the significance of r(s1 , s2 ) in a given network G by computing its z-score with respect to its distribution in G’s DCM-randomized networks as follows z[r(s1 , s2 )] =
r(s1 , s2 ) − µ[r(s1 , s2 )] . σ[r(s1 , s2 )]
(4)
Here µ[r(s1 , s2 )] and σ[r(s1 , s2 )] represent the mean and the standard deviation, respectively, of r(s1 , s2 ) over the ensemble of DCM-randomized networks. An analogous definition is used to estimate the significance of Kendall’s tau correlation τ (s1 , s2 ). In addition to node indegree k in and PageRank score p, we study here also age-rescaled variants of these two metrics, rescaled indegree R(k in ) and rescaled PageRank R(p), which were proposed in [41] (see Appendix B for the definition of the four metrics and computation details). The main idea behind the rescaled metrics is that the rescaling to a large extent removes the strong age bias of the original metrics and thus makes it possible to compare the nodes regardless of their age. The procedure described here can be applied to assess the significance of the relation between any other pair of node centrality metrics. Pearson and Kendall correlation between the centrality metrics are high in both Movies and Papers network (see Figure 4a,c). The z score values in Figure 4b,d imply that the interpretation of these similar correlation values is actually different between the two studied systems. In the Movies network, the correlation observed in real datasets matches well (the z score is close to zero) the correlation observed in DCM-randomized networks. This indicates that the information conveyed by indegree is the same as that conveyed by PageRank and the existing discrepancies (manifested by the correlation lower than one) can be explained by random fluctuations. In the Papers network, the correlation observed in real datasets is significantly lower (the z score is strongly negative) than in DCM-randomized networks, which indicates that PageRank scores carry additional information that is not captured by node indegree. We illustrate an interesting consequence of this result in the following section. In summary, we find that similar correlation values can yield vastly different z scores when compared with DCMrandomized networks. This indicates that null models are
5
(b) Movies
6
4
in
15
in
20 (a) Papers
10
2 Real L=100
Real L=100
5 0
1
10
10
2
k
600
3
10
10
0 0 10
4
10
1
10
in
120
(c) Papers
2
10
2
10
10 k
in
k
in
3
(d) Movies 80
400 in
in
Real L=100
200
40 Real L=100
0 0 10
1
10
2
3
10 k
10
4
10
0 0 10
1
10
in
10
3
in FIG. 3. (Color online) Relation between node indegree kin and the average indegree hkciting i of citing nodes for (a) Papers in in and (b) Movies. Relation between node indegree k and the average indegree hkcited i of cited nodes for (c) Papers and (d) Movies. Square and circle symbols represent the real data and the DCM-generated data, respectively.
1.0 (a)
-200 (b)
0.8
-150
r
Z_score
0.6 0.4
-50
0.2 0.0
in
(p,k ) Movies 1.0
-100
in
in
in (p,k ) (R(p),R(k )) (R(p),R(k )) Paper Papers Movies
0 -100
(c)
-80
0.6
-60
Z_score
0.8
0.4 0.2 0.0
in
in
in
in
in
in (p,k ) (R(p),R(k )) (R(p),R(k )) Paper Papers Movies
in
in (p,k ) (R(p),R(k )) (R(p),R(k )) Paper Papers Movies
(p,k ) Movies (d)
-40 -20
in
(p,k ) Movies
in
in
in (p,k ) (R(p),R(k )) (R(p),R(k )) Paper Papers Movies
0
(p,k ) Movies
FIG. 4. (Color online) (a) Pearson’s correlations r between the various metrics for Papers and Movies, and (b) associated z-scores with the DCM. (c) Kendall τ values between the various metrics for Papers and Movies, and (d) associated z-scores with the DCM.
6 essential for a proper interpretation of measurements in complex networks.
C.
The performance of centrality metrics in identifying significant nodes
This section discusses the implications of the previous findings on the ability of indegree and PageRank to identify significant nodes. In a recent work [41], some of the authors of this manuscript used the Papers network to evaluate the ranking of nodes produced by various node centrality metrics with a particular emphasis on the ranking positions of a set of fundamental papers, called Milestone Letters, chosen by the Physical Review Letters editors for their “long-lived contributions to physics, either by announcing significant discoveries, or by initiating new areas of research”. Differently from the common static evaluation of bibliometric indicators [29, 42– 44], the analysis of presented in [41] takes the temporal dimension into account and concerns the ability of the different metrics to single out the milestone papers as a function of their age (the logic behind this is that a good ranking method should be able to rank a milestone paper high short after it has been published). Here, we use the DCM to deepen that result and show that the observed performance gap between networkbased indicators (PageRank p and time-rescaled PageRank R(p)) and indicators based on citation count (citation count k in and rescaled citation count R(k in )) disappears when we randomize the network and thereby destroy the real network’s topological patterns. a. Identification of milestone papers in the Papers network. The ranking performance of a metric is measured by the fraction of milestone papers that appear in top 1% of the ranking t years after their publication (see [41] for details); this quantity is referred to as the identification rate. The identification rate achieved by the four considered metrics in the Papers network is shown in Figure 5a (this panel is identical with the result shown in [41]). The network-based indicators (p and R(p)) significantly outperform local metrics (k in and R(k in )) in identifying the milestone papers. Thanks to the suppression of PageRank’s time bias that generally favors old papers, rescaled PageRank is superior to PageRank until approximately 15 years after publication; from then on, the two metrics perform similarly. We now use the DCM to assess whether the same holds in DCM-randomized networks. To this end, Figure 5b shows the identification rate difference between the real and DCM-randomized networks. We see that the observed differences are small for both R(k in ) and k in . This is a directed consequence of the fact that the DCM preserves the citation time-series of all the papers. By contrast, p and R(p) perform substantially better in the real network than in the DCM-randomized networks. This implies that the dynamics of the paper citation count alone cannot explain the superior performance of R(p)
and p in identifying the milestone papers [41]. b. Identification of awarded movies in the Movies network. Data on expert-based assessment of movie significance are available as well and have been used, for instance, to assess whether classification algorithms based on centrality metrics can identify expert-selected movies of lasting importance [45]. We carry out the same identification rate analysis as before with the movies that received at least five Oscar awards having the same “ground truth” role as we previously assigned to the Milestone Letters. Figure 5c shows that the rescaled metrics are again superior to the unrescaled ones short after the movie release. However, the performance differences shown in Figure 5c are close to zero which indicates that the four metrics behave in the real network in almost the same way as they do in the DCM-randomized networks. This suggests that in the Movies network, there is no gain in using the whole network to compute node centrality. To summarize, whether PageRank-related metrics outperform indegree-related metrics depends on the topological properties of the network under consideration. In particular, if the given network is uncorrelated, PageRank-related and indegree-related metrics give similar information and there is thus no gain in assessing node importance using PageRank which is furthermore computationally more demanding than indegree. If instead the network exhibits non-trivial degree-degree correlations, indegree-PageRank correlation is smaller than the expected value in an uncorrelated network, and PageRankrelated methods have the potential to produce node rankings that are superior to those obtained with indegreerelated metrics.
IV.
CONCLUSIONS
We have introduced here a network null model, called dynamic configuration model, which preserves not only the network’s degree sequence, but also the individual nodes’ degree time series. We can say that in the same way as the configuration model generates random networks with arbitrary degree sequence [14], the dynamic configuration model produces random networks with arbitrary degree dynamics. Differently from the static configuration model, the new model is able to accurately reproduce the original network’s temporal patterns, thus providing a baseline to assess the significance of observed properties of growing networks. Among others, three extensions of our work are possible. First, in a similar spirit as the dk-series introduced in [18] generalizes the original configuration model, one could try to construct time-respecting null models that preserve not only the individual nodes’ time series, but also the dynamics of higher-order structural properties, such as degree-degree correlations. Second, the proposed null model can be extended to include deletion of edges in a similar spirit as the random graph for temporal networks recently proposed in ref. [46]. Third, a null model
7 0.8
0.3 (b) Papers
(a) Papers IRReal-IRDCM
IR
0.6 0.4 p R(p) in k in R(k )
0.2 0.0 0
5 10 15 20 Years after publication
0.2
0.0 25
0
0.8
25
(d) Movies
0.4
IRReal-IRDCM
0.6 IR
5 10 15 20 Years after publication
0.3 (c) Movies
p R(p) in k in R(k )
0.2 0.0 0
p R(p) in k in R(k )
0.1
5
10 15 Years after release
20
0.2
p R(p) in k in R(k )
0.1
0.0 25
0
5
10 15 Years after release
20
25
FIG. 5. (Color online) Identification rate as a function of paper age (a) for the Milestone Letters in Papers and (c) for the Oscar-awarded movies in Movies. Identification-rate difference between the original dataset and the DCM-generated networks for (b) Papers and (d) Movies. The curves are averages over ten independent realizations of the randomization process.
that reflect the network evolution better than existing null models can be used to improve community detection in evolving networks. This will be addressed in a forthcoming work [47]. Our results on the citation network of scientific papers can be also viewed from another perspective. From its definition, it follows that the DCM can be interpreted as a model where scientists mindlessly follow the current trends when choosing which paper to cite. The fact that the real data exhibit structural properties substantially different with respect to those found in the DCMrandomized networks can be interpreted as an encouraging sign that the citing behavior of scientists is to a considerable extent different from simply picking the currently trending papers. This directly challenges the existing growth models for academic citation networks which assume that all scientists are driven by the same mechanism when choosing which papers to cite [5, 48]. Our findings show that this assumption leads to results that are not consistent with those found in the real data. This calls for more complex models where diversified citation strategies exist in the system. It remains open whether to the observed non-trivial patterns can be reproduced by a unipartite network model – possibly an extension of the existing models [5, 48] – or if additional layers of complexity (such as the behavior of authors, research groups, and institutions) will need to be introduced in the modeling framework.
Appendix A: The datasets
a. Papers We denote as Papers the citation network composed of E = 4, 672, 812 directed edges between the N = 449, 935 papers published in American Physical Society journals between 1893 and 2009. The data can be obtained under request at http://journals.aps.org/ datasets. Edges are time-stamped with temporal resolution equal to one day. b. Movies We denote as Movies the citation network composed of E = 42, 794 directed edges between N = 15, 425 that compose the giant component of the network of US movies released between 1894 and 2011. The data is publicly available at https://amaral.northwestern.edu/ resources/data-sets/us-film-citation-network, were extracted by the authors of ref. [45] from the movies’ references data available at ftp: //ftp.fu-berlin.de/pub/misc/movies/database/. Edges are time-stamped with temporal resolution equal to one year.
Appendix B: Network centrality metrics
a. Indegree The indegree of a given node is defined as the number of incoming edges received by that node. In terms of the network’s adjacency matrix A (in a directed network, Aij = 1 if node j points to node i,
8 Aij = 0 otherwise), the indegree kiin of a node can be P in simply expressed as ki = j Aij . b. PageRank The PageRank vector of scores p is defined by the following equation p = α P p + (1 − α)v,
(B1)
where Pij = Aij /kjout and v is a uniform teleportation vector (vi = 1/N for all nodes i). We set here α = 0.5 which is the usual choice in citation networks [49]. Eq.(B1)can be interpreted as the stationary equation of a stochastic process on the network where a random walker either follows the network’s edges with probability α, or he jumps to a randomly chosen node with probability 1 − α. c. Rescaled indegree and rescaled PageRank Rescaled indegree R(k in ) and rescaled PageRank R(p) aim to suppress the temporal bias of indegree and PageRank, respectively [41, 50]. For both metrics, each node’s structural centrality score is only compared with the scores of nodes of similar age. Node i’s rescaled indegree score Ri (k in ) quantifies the number of standard deviations node i outperforms with respect to nodes of similar age with respect to k in . In formulas,
ank score Ri (p) of node i is defined as [41] Ri (p) =
pi − µi (p) , σi (p)
(B3)
where µi (p) and σi (p) represent mean value and standard deviation, respectively, of the indegree of the nodes j ∈ [i − ∆p /2, i + ∆p /2]. For Papers, we set ∆p = ∆c = 1000 [41]. For Movies, we set ∆p = ∆c = 500. A potential issue for Movies is that we do not know the exact order of movies released in the same year due to the time resolution of the data. For this reason, we randomize the order of movies published in the same year in order to assign the temporal window. We observed that our findings do not depend on the particular order of movies released in the same year; for simplicity, the results presented in this article refer to one particular realization of the order of movies released in the same year.
ACKNOWLEDGEMENTS
where µi (k in ) and σi (k in ) represent mean value and standard deviation, respectively, of the indegree of the nodes j ∈ [i−∆k /2, i+∆k /2]. Analogously, the rescaled PageR-
ZMR and MSM contributed equally to this work. We wish to thank Giacomo Vaccario for inspiring discussions and useful suggestions. This work was supported by the EU FET-Open Grant No. 611272 (project Growthcom). The authors declare that they have no competing financial interests. Correspondence and requests for materials should be addressed to M. S. Mariani (email:
[email protected]).
[1] Newman M 2010 Networks: an introduction (Oxford University Press) [2] Jackson M O 2010 Social and Economic Networks (Princeton University Press) [3] Bianconi G and Barab´ asi A L 2001 Europhys. Lett. 54 436 [4] Kong J S, Sarshar N and Roychowdhury V P 2008 Proceedings of the National Academy of Sciences 105 13724– 13729 [5] Medo M, Cimini G and Gualdi S 2011 Physical Review Letters 107 238701 [6] Kitsak M, Gallos L K, Havlin S, Liljeros F, Muchnik L, Stanley H E and Makse H A 2010 Nature Physics 6 888– 893 [7] Ren Z M, Zeng A, Chen D B, Liao H and Liu J G 2014 Europhys. Lett. 106 48005 [8] L¨ u L, Chen D, Ren X L, Zhang Q M, Zhang Y C and Zhou T 2016 Physics Reports 650 1–63 [9] Brockmann D and Helbing D 2013 Science 342 1337– 1342 [10] Iannelli F, Koher A, Brockmann D, Hoevel P and Sokolov I M 2016 arXiv preprint arXiv:1608.06201 [11] Fortunato S and Hric D 2016 Physics Reports 659 1–44 [12] Blondel V D, Guillaume J L, Lambiotte R and Lefebvre E 2008 Journal of Statistical Mechanics: Theory and Experiment 2008 P10008
[13] Sobolevsky S, Campari R, Belyi A and Ratti C 2014 Physical Review E 90 012811 [14] Newman M E, Strogatz S H and Watts D J 2001 Physical Review E 64 026118 [15] Park J and Newman M E 2004 Physical Review E 70 066117 [16] Squartini T and Garlaschelli D 2011 New Journal of Physics 13 083001 [17] Saracco F, Di Clemente R, Gabrielli A and Squartini T 2015 Scientific Reports 5 (2015) [18] Orsini C, Dankulov M M, Colomer-de Sim´ on P, Jamakovic A, Mahadevan P, Vahdat A, Bassler K E, Toroczkai Z, Bogu˜ na ´ M, Caldarelli G et al. 2015 Nature Communications 6 [19] Casiraghi G, Nanumyan V, Scholtes I and Schweitzer F 2016 arXiv preprint arXiv:1607.02441 [20] Mucha P J, Richardson T, Macon K, Porter M A and Onnela J P 2010 Science 328 876–878 [21] Colizza V, Flammini A, Serrano M A and Vespignani A 2006 Nature Physics 2 110–115 [22] Milo R, Shen-Orr S, Itzkovitz S, Kashtan N, Chklovskii D and Alon U 2002 Science 298 824–827 [23] Jonhson S, Dom´ınguez-Garc´ıa V and Mu˜ noz M A 2013 PLoS One 8 e74025 [24] Holme P and Saram¨ aki J 2012 Physics Reports 519 97– 125
Ri (k in ) =
kiin − µi (k in ) , σi (k in )
(B2)
9 [25] Rosvall M, Esquivel A V, Lancichinetti A, West J D and Lambiotte R 2014 Nature Communications 5 [26] Scholtes I, Wider N, Pfitzner R, Garas A, Tessone C J and Schweitzer F 2014 Nature Communications 5 5024 [27] Holme P 2015 The European Physical Journal B 88 1–30 [28] Xu J, Wickramarathne T L and Chawla N V 2016 Science Advances 2 e1600028 [29] Chen P, Xie H, Maslov S and Redner S 2007 Journal of Informetrics 1 8–15 [30] Mariani M S, Medo M and Zhang Y C 2015 Scientific Reports 5 (2015) [31] Vidmer A, Medo M and Zhang Y C 2015 EPJ Data Science 4 20 [32] Vidmer A and Medo M 2016 Europhys. Lett. 116 30007 [33] Pastor-Satorras R, V´ azquez A and Vespignani A 2001 Physical Review Letters 87 258701 [34] Foster J G, Foster D V, Grassberger P and Paczuski M 2010 Proceedings of the National Academy of Sciences 107 10815–10820 [35] L¨ u L, Zhou T, Zhang Q M and Stanley H E 2016 Nature Communications 7 [36] Pastor-Satorras R and Castellano C 2016 arXiv preprint arXiv:1610.00569 [37] Upstill T, Craswell N and Hawking D Predicting fame and fortune: Pagerank or indegree [38] Chen Y Y, Gan Q and Suel T 2004 Local methods for estimating pagerank values Proceedings of the Thirteenth ACM International Conference on Information
and Knowledge Management (ACM) pp 381–389 [39] Pandurangan G, Raghavan P and Upfal E 2006 Internet Mathematics 3 1–20 [40] Fortunato S, Bogu˜ n´ a M, Flammini A and Menczer F 2006 Approximating pagerank from in-degree International Workshop on Algorithms and Models for the WebGraph (Springer) pp 59–71 [41] Mariani M S, Medo M and Zhang Y C 2016 Journal of Informetrics 10 1207–1223 [42] Sidiropoulos A and Manolopoulos Y 2006 Journal of Systems and Software 79 1679–1700 [43] Dunaiski M, Visser W and Geldenhuys J 2016 Journal of Informetrics 10 392–407 [44] Medo M and Cimini G 2016 Physical Review E 94 032312 [45] Wasserman M, Zeng X H T and Amaral L A N 2015 Proceedings of the National Academy of Sciences 112 1281– 1286 [46] Zhang X, Moore C and Newman M 2016 arXiv preprint arXiv:1607.07570 [47] Zeng A, Mariani M S, Medo M and Zhang Y C 2017 In preparation [48] Wang D, Song C and Barab´ asi A L 2013 Science 342 127–132 [49] Walker D, Xie H, Yan K K and Maslov S 2007 Journal of Statistical Mechanics: Theory and Experiment 2007 P06010 [50] Newman M 2014 Europhys. Lett. 105 28002