A tutorial on Multi-Block Discriminant Correspondence Analysis (MUDICA): A new method for analyzing discourse data from clinical populations Lynne J. Williams
Herv´e Abdi
University of Western Ontario
University of Texas at Dallas
Rebecca French
J.B. Orange
Southlake Regional Health Care
University of Western Ontario
Purpose. In communication disorders research, we frequently describe clinical groups based on patterns of performance, but we often study only few participants described by many quantitative and qualitative variables. These data are difficult to handle by standard inferential tools (e.g., ANOVA or factor analysis) whose assumptions are unfit for these data. This paper presents Multi-block Discriminant Correspondence Analysis (MUDICA) which is a recent method that can handle datasets not suited for standard inferential techniques. Method. M UDICA is illustrated with clinical data examining conversational trouble-source repair and topic maintenance in dementia of the Alzheimers type (DAT). Seventeen DAT participant/spouse dyads (6 control, 5 early DAT, 6 moderate DAT) produced spontaneous conversations analyzed for co-occurrence of trouble-source repair and topic maintenance variables. Results. M UDICA found that trouble-source repair sequences and topic transitions are associated and that patterns of performance in the DAT groups differed significantly from the CTRL group. Conclusions. M UDICA is ideally suited to analyze language and discourse data in communication disorders because it (1) can identify and predict clinical group membership based on patterns of performance, (2) can accommodate few participants and many variables, (3) can be used with categorical data, and (4) adds the rigor of inferential statistics.
In clinical research, we need to identify the patterns of performance that discriminate clinical groups. Yet, in speech and language research, we are often faced with the problem of finding a suitable method to address this question. This problem occurs because of two primary characteristics of our data: First, our studies typically have few participants but many variables; Second, our studies frequently use categorical, or qualitative, variables. Because these types of data are not suitable for methods such as analysis of variance or factor analysis, researchers often feel compelled to report only the frequency of occurrence of each variable rather than using inferential procedures. Interestingly, however, some recently developed data analysis methods can apply the rigor of statistical analysis to the questions and data specific to clinical research in our discipline. In this paper we present Discriminant Correspondence Analysis (DICA) and its extension Multiblock Discriminant Correspondence Analysis (MUDICA), which are methods that can show relationships between clinical diagnostic groups described by categorical (i.e., qualitative) variables. D ICA and MUDICA also can identify diagnostic group membership based on patterns of performance. We illustrate DICA and MUDICA by analyzing a dataset collected
in order to reveal the relationship between conversational trouble-source repair and topic maintenance in dementia of the Alzheimer’s type (DAT).
Discriminant Correspondence Analysis (DICA) D ICA is used when we collect variables describing observations (e.g., participants, conversational dyads, etc.) obtained from a priori defined groups (e.g., control vs. clinical groups) and when we want to: (1) assess whether group membership explains some variance of the observations; (2) find out what variables are important to discriminate between the groups; and (3) predict group membership of new observations. The main idea behind DICA is to represent each a priori group, observation, and variable as a point on a map such that the positions of these points reflect the important features of the data. As clinical researchers our groups are, in general, diagnostic groups. D ICA is intuitively appealing to analyze clinical data because the proximity between group points in the DICA maps represents their similarity and the proximity between variable points represents their association (Abdi, 2007a).
2
WILLIAMS, ABDI, FRENCH & ORANGE
In DICA, we examine the “style” of our a priori groups because DICA is sensitive to the groups’ relative use of all the variables, rather than to the absolute number of occurrences of each variable. That is, DICA analyzes the variable frequencies for each group (These frequencies are obtained by dividing each row entry by the sum of the variables for that row). Formally, DICA combines the features of discriminant analysis (see Klecka, 1980) and correspondence analysis (see Abdi & Williams, in press-c; Greenacre, 1984, 2007, see also Abdi & Valentin, 2007 and Le Roux & Rouanet, 2010) 1 in order to perform a type of discriminant analysis appropriate for qualitative data. Because it is derived from correspondence analysis, which is a model-free technique, DICA is also model-free and therefore does not impose parametric distributional assumptions such as normality or homogeneity of variance. In addition, DICA can handle data sets with few observations described by many qualitative or quantitative variables. Multi-block discriminant correspondence analysis (MUDICA), an extension of DICA, can be used to examine group performance on a subset of the variables included in the DICA analysis. All of these features make DICA , and by extension MUDICA , ideal tools for clinical research.
A “Real-World” Example: Trouble-source Repair and Topic Maintenance in Dementia of the Alzheimer’s Type
Cite as:. Williams, L.J., Abdi, H., French, R., & Orange, J.B. (in press, 2010). A tutorial on Multi-Block Discriminant Correspondence Analysis (MUDICA): A new method for analyzing discourse data from clinical populations. Journal of Speech Language and Hearing Research, 53. This research was supported in part by grants from the R. Samuel McLaughlin Centre for Gerontological Health Research at McMaster University and from the Faculty of Health Sciences at the University of Western Ontario. This research is part of a larger study examining conversational trouble-source repair in DAT. We used data collected at Time 1 of the larger study in the current analysis. There are no known conflicts of interest. Color versions of the figures are available from the second author’s homepage at http://www.utd.edu/∼herve Correspondence regarding this article should be addressed to: Lynne J. Williams, Department of Psychology, University of Toronto Scarborough, 1265 Military Trail, Toronto, Ontario M1C 1A4, Canada. Tel: 416-208-4870; E-mail:
[email protected] or to Herv´e Abdi, School of Behavioral and Brain Sciences, University of Texas at Dallas, MS GR4.1, 800 West Campbell Road, Richardson, TX 75080-3021, USA. Tel: (972) 883-2065; Email:
[email protected].
Background Individuals with dementia of the Alzheimer’s type (DAT) have problems participating in meaningful conversations and these problems worsen as the disease progresses. (Orange, Lubinski & Higginbotham, 1996; Orange & Colton-Hudson, 1998; Orange, Van Gennep, Miller & Johnson, 1998; Watson, Chenery & Carter, 1999; Guendouzi & M¨uller, 2002). This deterioration in conversational ability creates more conversational breakdowns which, in turn, require caregivers to spend more time and effort repairing these breakdowns. (Orange et al., 1996; Orange, Van Gennep et al., 1998). As DAT progresses, conversational partners take on more responsibility for initiating and maintaining conversation as well as for negotiating trouble-source repairs. This results in differences in how individuals with DAT and their conversational partners signal breakdowns. For example, partners use repair initiators that require a specific response (e.g., “You played what?”), while individuals with DAT are less interactive and less specific in their requests for repair (e.g., “err”; Watson et al., 1999). In addition to having more conversational breakdowns, DAT participants also experience topic management problems. Typically, they have difficulty introducing, changing, elaborating on, and maintaining the topic of conversation as compared to their conversational partners (Mentis, BriggsWhittaker, & Gramingna, 1995). Consequently, DAT participants introduce and unexpectedly shift topics more frequently (Garcia & Joanette, 1994, 1997). Because individuals with DAT have trouble with both conversation breakdown and topic management, we expect to find that the amount of conversational breakdown is associated with the amount of topic management skills. But, curiously, there have been no systematic studies examining cooccurrence of conversational breakdown and topic maintenance. This led us to ask the following research questions: (1) do conversational trouble-sources occur during topic transitions in DAT participant/spouse conversational dyads; and (2) does dementia severity affect the pattern of conversational trouble-source repair at topic transitions?
Dataset Diagnostic Groups and Participants We examined trouble-source repair and topic transitions in three clinical groups: control (CTRL), early stage DAT (EDAT), and middle stage DAT (MDAT). DAT participants were diagnosed with probable DAT according to the NINCDS ADRA criteria (McKahnn, Drachman, Folstein, Katzman, Price & Stadlan, 1984). We established the clinical stage based on scores from the Standardized Mini-Mental State Examination (Molloy, Alemayheu, and Roberts, 1991) and the Global Deterioration Scale (Reisberg, Ferris, De Leon & Crook, 1982). There were twelve participants making 1 Correspondence analysis was developed by the French school of data analysis expressly for analyzing relationships in linguistic data.
3
USING MUDICA TO ANALYZE DISCOURSE
up six DAT participant/spouse conversational dyads in both the CTRL and MDAT groups and ten participants making up five DAT participant/spouse dyads in the EDAT group (The sixth EDAT dyad was excluded from the analysis because the spouse produced no trouble-source repair sequences). Spouses were selected as conversational partners because partner familiarity promotes natural conversation, ensures that individuals are familiar with each others’ verbal, nonverbal, and idiosyncratic cues, and minimizes adjustments in communication style (Santo Pietro, 1994). Participant demographic characteristics are given in Table 1.
Procedure Mid-day and evening meal-time conversations were video recorded on a single day. The mid-day session was used to habituate the dyads to the recording equipment. All recording sessions occurred in the participants’ homes in the location where the participants usually ate their meals (e.g., kitchen, dining room, family room). Participants were given no specific instructions on topics to discuss, nor on how to interact with one another. The examiner was not present during either recording session. Conversations ranged from 111 to 561 utterances (M = 322.71). All spouse-participants reported that the recorded conversations were typical of their daily interactions. Because we were interested in the pattern of communication between DAT participants and their spouses, we considered that dyads constituted the observations for our analysis. We used thirty-six variables to describe the troublesource repair sequences produced by each participant. The same variables were used to code trouble-source repair sequences initiated by each member of the dyad, making a total of seventy-two variables per dyad. Note that the troublesource repair sequences are not equally represented by all of the variables which fall into three broad categories: (1) trouble-source repair, (2) topic, and (3) trouble-source repair sequencing. Trouble-source repair, topic, and trouble-source repair sequencing variables and their definitions are shown in Appendix B.
Inter-rater Reliability Four raters recoded a random 16% of the conversational samples (as per Mentis et al. 1995). For trouble-source repair sequences at topic boundaries, percent agreement with the original rater was 75%.
D ICA In order to perform DICA, we start with a data table where each row represents an observation (i.e., a dyad) and each column a variable. In our example, the original data table is a contingency table in which each row is a dyad and each variable counts the number of occurrences of a given behavior. D ICA per se is performed on a group by variable contingency table . This table gives the number of occurrences of each variable for all the observations of a given diagnostic group (the group by variable contingency table for
the trouble-source repair and topic dataset is shown in Appendix A; also see Figure 1–DICA). Correspondence Analysis (Figure 1–CA) is then applied to this group by variable contingency table (correspondence analysis is the equivalent of principal component analysis for qualitative data, see, e.g., Abdi & Williams, in press-c, for an introduction). From the contingency table, correspondence analysis computes new variables called factors, which are combinations of the original variables. The values of these new variables are called factor scores. The scores of the first factor have the largest possible variance and therefore the first factor “explains” the largest possible part of the variance of the data. The second factor is statistically independent of the first factor (i.e., these two factors are uncorrelated) and accounts for the largest possible amount of the remaining variance. The other factors are computed likewise. Correspondence analysis produces two sets of factors scores: One for the rows and one for the columns of the data table and, importantly, these two sets of factor scores have the same variance. To create a map of the groups and the variables, their factor scores are used as coordinates. This process is illustrated in Figure 1. These factors scores can also be interpreted geometrically as the projections of the groups and of the variables onto the factors. After the analysis of the group by variable contingency table has been performed, the original observations are then projected as points on the factor map. For each factor, the mean of the factor scores of the observations of a group is equal to the factor score of this group.
Interpreting DICA Once the maps are generated, how do we interpret them? The points in the map represent the observations/groups and the variables. The factor scores of the groups and the variables have the same variance and therefore observations/groups and variables can be plotted on the same map. However, the proximity between two points can be directly interpreted only when these two points belong to the same set (e.g., the proximity of two variables can be interpreted directly but not the proximity of a variable and a group). Accordingly, we show here the observations/groups and the variables in separate maps. The proximity of the points representing the observations/groups expresses their similarity and the proximity of the variables represents their association (i.e., their correlation; see Abdi & Williams, in press-b). As mentioned before, the interpretation of the proximity between observations/groups and variables is delicate, but a useful rule of thumb is that when a variable and an observation/group fall within the same quadrant of the map, this variable is more associated to this group than to the averages of the other groups.
What are the Important Factors? The importance of a factor is given by the amount of variance that it explains. This amount called an eigenvalue, is represented by the Greek letter λ (lambda). In DICA (in contrast with principal component analysis) the eigenvalues are always smaller than one. The importance of a factor is also
4
WILLIAMS, ABDI, FRENCH & ORANGE
Table 1 Demographics of participants, spouses, and conversational dyads Age (yrs) Participants
Mean
(SD)
Education (yrs) Mean
(SD)
Spouse
69.54 66.93
(5.72) (5.92)
13.17 13.50
(2.32) (4.37)
DAT e Spouse
68.42 65.80
(6.39) (4.35)
14.8 11.6
(3.03) (3.21)
DAT Spouse
74.47 75.00
(4.35) (6.19)
13.42 12.25
(2.62) (1.72)
CTRL
SMMSE a
Mean
GDS b
(SD)
Mean
(SD)
C TRL Dyads (n = 6)g — — — — — — — — E DAT Dyads (n = 5)d 25.00 (1.55) 3.40 (0.49) — — — — M DAT Dyads (n = 6) f 15.67 (2.07) 5.67 (0.52) — — — —
DAS c
Mean
(SD)
114.83 112.00
(9.81) (6.07)
— 117.20
— (8.01)
— 116.00
— (8.69)
Note. There were no significant differences on age (F(2, 33) = 2.94, p > .05, MS E = 41.08), education (F(2, 14) = 0.07, p > .05, MS E = 8.52), or the Dyadic Adjustment Scale (F(2, 20) = 0.05, p > .05, MS E = 69.39). All spouses and the CTRL participants completed the Dyadic Adjustment Scale
Standardized Mini-Mental State Examination (Maximum score = 30; Molloy et al. 1991) Global Deterioration Scale (Scores range from 1 – 7; Reisberg et al. 1982) c Dyadic Adjustment Scale (Cut-off score = 97; Spanier 1976) d E DAT = participants in early stage dementia of the Alzheimer’s type e DAT = participants with dementia of the Alzheimer’s type f M DAT = participants in middle stage dementia of the Alzheimer’s type g C TRL = control participants a b
expressed as the proportion or percentage of the total variance explained by a factor. This proportion is represented by the Greek symbol τ (tau). The maximum number of possible factors in DICA is one less than the number of groups or variables (whichever is less). The procedure for interpreting the factors in DICA is similar to the one used for principal component analysis (see Abdi & Williams, in press-e, for an example with principal component analysis). In order to find the important groups/variables, the first step is to compute for each group or variable an index called its contribution to the factor, or simply its contribution. gives the proportion of an eigenvalue accounted for by a given groups or variable. Taking into account that the sum of the squared factor scores for a given factor equals the eigenvalue of that factor, a contribution is defined as contribution =
(factor score of group or variable)2 . eigenvalue
Groups or variables with greater than the average contribution are considered to be important. The average contribution is computed as: average group contribution =
1 . number of groups
Also, because factor scores can be either positive or negative, contributions also can be interpreted as positive or negative. This means that the groups or variables that contribute the most to each “end” (i.e., pole) of the factor in the map help determine what the factor represents.
For our example, DICA produced the maps displayed in Figures 2 and 3. Note that in Figure 3 the variables are shown in separate maps because the number of variables makes interpretation difficult when they are all presented in one map. Keep in mind, however, that the variables are actually all in the same DICA space (i.e., they all come from the same map). The DICA found two factors: Factor 1 has an eigenvalue of .08 which accounts for 66 percent of the total variance; and Factor 2 has an eigenvalue of .04 which accounts for the remaining 34 percent of the total variance. Because we have only two factors, the percentage of the variance accounted for by these two factors sums to 100. If we had more factors, the sum of the first two factors would be smaller than 100. Now that we have determined the importance of our factors, we need to decide how many factors to keep. Deciding which factors to keep depends upon their eigenvalues, the research hypothesis, and what “makes sense” given the dataset and the research questions. In our example, we have 3 groups and because the maximum number of factors is the number of rows or columns minus one (whichever is less), we have only 2 factors in our example. Yet, in datasets with more than three groups, DICA finds, in general, more than 2 factors. When this occurs, we must choose the number of factors to keep. A scree plot is a useful tool to help determine which factors to keep. A scree plot is a line segment plot showing the proportion of the total variance in the data accounted for by each factor. The factors are ordered from those accounting for the most to the least variance. When read from left to right across the X-axis, scree plots often show the point
.
5
USING MUDICA TO ANALYZE DISCOURSE
project observations
Obs Grp 1 A B 2 C 3 A 4 B 5 C 6
DICA
C
B
Block Block 1 2 var1 var2 var3 var4
Block Block 1 2 Grp var1 var2 var3 var4 A B C
Σ
C B
A
CA A var1
var3
var2
Tolerance and Prediction Intervals
var4
Block 1 C
B
MUDICA
B
C
C
B A Block 2 A
Confidence Intervals
A
C
B
resample with replacement 10,000 times
A
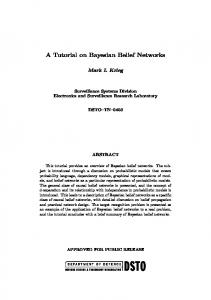
Figure 1. (a) Steps to run DICA: Step 1. From the original observation by variable contingency table, take the sum of each variable within each a priori determined category (usually diagnostic groups in clinical research), Step 2. Run correspondence analysis (CA) on the category (diagnostic group) by variable contingency table to produce the row and variable DICA maps; (b) Steps to run a multi-block discriminant correspondence analysis (MUDICA): Step 3. Divide the group by variable contingency table into 2 or more blocks, each representing only a subset of the variables for all groups, Step 4. Project the blocks into the original DICA space as supplementary elements; (c) Steps to add an inferential step to DICA and MUDICA: Step 5. Project the observations and the jackknifed observations into the DICA space as tolerance or prediction intervals; Step 6. Generate 10,000 samples with replacement from the original data using bootstrap resampling, Step 7. Project the 10, 000 samples into the original DICA space as supplementary elements as confidence, intervals, Step 8. Trim tolerance, prediction, and confidence points to 95% intervals and replace by ellipse.
2
2 CTRL
MDAT λ1 = 0.08 τ1 = 66%
MDAT 1
λ1 = 0.08 τ1 = 66%
CTRL 1 2
6 3
5
3 5 6 4
1
4
1
2
4 5 3
1
2
EDAT λ2 = 0.04 τ2 = 34%
EDAT λ2 = 0.04 τ2 = 34%
(a)
(b)
Figure 2. D ICA map of rows (observations) representing a priori diagnostic groups. (a) D ICA map of the placement of the CTRL, EDAT, and MDAT groups along Factors 1 and 2. Factor 1 separates the CTRL and MDAT groups. Factor 2 separates the EDAT group from the CTRL and MDAT groups. (b) D ICA map of the placement of the CTRL, EDAT, and MDAT groups with the DAT participant/spouse dyads projected into the DICA space as supplementary elements. The projections of the dyads confirm that Factor 1 separates the CTRL and MDAT groups. CTRL = Control, EDAT = early stage DAT, MDAT = middle stage DAT. All subfigures are plotted at the same scale. High contributors to Factor 1 include: CTRL and MDAT groups. High contributors to Factor 2 include: EDAT group. Factor 1: λ1 = 0.08, τ1 = 66%. Factor 2: λ2 = 0.04, τ2 = 34%. Note that in DICA λ is always smaller than 1.
6
WILLIAMS, ABDI, FRENCH & ORANGE
2
DATST(+2)
SPST(+2) DATSU(+2) DATST(>2) SP SU(+2) SPComplex
SPSU λ1 = 0.08 τ1 = 66%
2
DATT(+2)
SPT
DATT(>2)
1
DATT SPST SPT(+2) DATST DATSU SPST(>2) DATSU(+1) SPT(+1) DATSU(>2) DATT(+1) SPSU(>2) DATST(+1)
λ1 = 0.08 τ1 = 66%
DATSimple
1
SP#TS SPSimple
DAT#TS DATComplex
SPT(>2) SPSU(+1)
λ2 = 0.04 τ2 = 34%
λ2 = 0.04 τ2 = 34%
SPST(+1)
(a) DATTangential Shift
(b)
2
DATST(Reintroduced)
DATNonCoherent Change
2
SPST(Reintroduced)
SPShift DATT(New)
λ1 = 0.08 τ1 = 66%
1
DATShift DATChange
λ1 = 0.08 τ1 = 66%
SPT(Reintroduced)
SPT(New)
DATT(Reintroduced)
SPChange
1
SPST(New)
DATST(New)
λ2 = 0.04 τ2 = 34%
λ2 = 0.04 τ2 = 34%
SPNonCoherent Change
(c)
(d)
(DAT)
λ1 = 0.08 τ1 = 66%
2
2
SPCog (DAT) SPSem
DATPhon(DAT) DATCog
(DAT)
DATOther
DATSem
(SP)
SPSem(SP)
SPOther(SP)
1
(DAT)
DATDisc
(SP)
SPDisc DATOther
(DAT)
DATDisc
SPDisc (SP) SPCog(SP)
(SP)
SPUnsuccessful
SPOther(DAT)
(DAT)
λ1 = 0.08 τ1 = 66%
DATMost-Successful DATSuccessful
SPSuccessful
1
SPMost-Successful
DATUnsuccessful
DATSem
(DAT)
λ2 = 0.04 τ2 = 34%
DATCog
(SP)
(e)
λ2 = 0.04 τ2 = 34%
(f)
Figure 3. D ICA map of variables. Note that all variables are represented in the same DICA space and have been separated for easier viewing. (a) Trouble sources at topic, sub-topic, and social unit boundaries; (b) Number of trouble sources and trouble source repair sequence complexity; (c) Trouble sources at topic shifts and changes; (d) Trouble sources at new and reintroduced topics; (e) Trouble source types. The “sub-subscript” represents the dyad member who initiated the trouble source; and (f) Trouble source resolution success. Descriptions of the variables can be found in Appendix B. DATX = trouble-source repair sequence initiated by DAT participant, SPX = trouble-source repair sequence initiated by spouse, T = topic boundary, ST = subtopic boundary, SU = social unit boundary, X+1 = 1 utterance after boundary, X+2 = 2 utterances after boundary, X>2 = more than 2 utterances after boundary, XXDAT = trouble source by DAT participant, XXSP = trouble source by spouse, Disc = discourse trouble-source trouble source, Phon = phonological trouble-source trouble source, Sem = semantic trouble-source trouble source, Cog = cognitive trouble-source trouble source, Other = other trouble-source trouble source. High contributors to Factor 1 include: cognitive (DATCogDAT ), other (DATOtherDAT ), and discourse (DATDiscDAT ) trouble source produced by the individual with DAT in DAT participant initiated trouble-source repair sequences and trouble source at topic shifts (SPShift ), and trouble source at new topic introductions (SPT(New) ) in spouse initiated trouble-source repair sequences. High contributors to Factor 2 include: semantic trouble source produced by the individual with DAT (DATSemDAT ) in DAT participant initiated trouble-source repair sequences and trouble source at topic introduction (SPT ), trouble source at subtopic introduction plus 1 utterance (SPST+1 ), trouble source at social unit introduction plus 1 utterance (SPSU+1 ), trouble source at greater than 2 utterances after topic introduction (SPT>2 ), and trouble source at topic shift (SPShift ) in spouse initiated trouble-source repair sequences. All subfigures are plotted at the same scale. Factor 1: λ1 = 0.08, τ1 = 66%. Factor 2: λ2 = 0.04, τ2 = 34%. Note that in DICA λ is always smaller than 1.
USING MUDICA TO ANALYZE DISCOURSE
Table 2 Contributions of the groups to Factors 1 and 2
CTRL EDAT MDAT
Factor 1
Factor 2
0.544 0.000 0.456
0.145 0.694 0.161
of separation between the “most important” and “least important” factors. This point of separation is often called the ‘elbow’ (Abdi & Williams, in press-e). However, scree plots act only as guidelines. We still need to maintain a critical eye and decide on the number of factors based on what makes the most sense given the dataset.
Interpreting the Observations and Groups (Rows) Interpreting the meaning of the factors is done in two stages: First, by looking at the observations/groups and then by looking at the variables. The relative position of the observations/groups is shown in Figure 2. Recall that, for our example, the groups represent the responses of the CTRL, EDAT , and MDAT dyads. Looking at Factor 1 (plotted on the horizontal) in Figure 2a, we see that the CTRL and MDAT dyads are contrasted. For Factor 2 (plotted on the vertical), the EDAT dyads is contrasted with the CTRL and MDAT dyads. To confirm this interpretation, we look at the contributions of the three groups to each factor. From Table 2 we can see that, indeed, this interpretation is correct. The CTRL and MDAT groups contribute the most to Factor 1, while the EDAT group contributes the most to Factor 2. Because the contributions for each factor always sum to one, the average contribution of the three groups to a given factor is: average group contribution =
1 1 = ≈ 0.33 . number of groups 3 (1)
Supplementary elements. Using supplementary elements is a useful way to enrich the interpretation of the DICA factors. Supplementary elements are additional observations/groups (or variables) that are not included as part of the DICA computations. Rather, they are observations/groups (or variables) that are projected into the DICA space after it has been computed. This shows where the observations/groups (or variables) would have fallen if they had been included in the analysis. For the sake of illustration, we projected the original dyads into the DICA space as supplementary elements (Figure 2b). This shows the actual dispersion of the original dyads around the groups. The dispersion of the dyads confirms that Factor 1 differentiates the CTRL and MDAT groups.
Interpreting the Variables (Columns) The relative position of the variables is shown in Figures 3a through 3f. Recall that, for convenience, the vari-
7
ables are shown in different maps but that they are all part of the same DICA space (and come from the same map). When there are so many variables, determining which ones are the most important to a given factor can be difficult when only looking at the map. Note that in DICA, variables that occur rarely contribute more to the factors because, in correspondence analysis, rare variables have a large importance and therefore could uniquely define a factor. When there are a lot of variables (or groups) it is helpful to start with the variables having large contributions and then return to the map(s). Determining the importance of a variable to a factor is done in the same way as for the groups. That is, the important variables have contributions larger than the average contribution2 (i.e., 1÷ number of variables). When we use the contributions to select the important variables, we see that Factor 1 reveals the following contrasts: (1) DAT initiated trouble-source repair sequences at topic introductions vs. DAT initiated trouble-source repair at two utterances following topic introductions and spouse initiated trouble-source repair sequences at topic introductions (Figure 3a); (2) DAT and spouse initiated reintroduced topics and subtopics vs. spouse initiated new topics and subtopics (Figure 3d); (3) DAT discourse and other trouble source vs. DAT cognitive trouble source in DAT initiated trouble-source repair sequences (Figure 3e); and (4) new topics vs. topic shifts in spouse initiated trouble-source repair sequences (Figures 3d and 3c, respectively). All together, this suggests that Factor 1 represents the difference in performance between the individuals with DAT and their spouses, with the individuals with DAT producing more discourse and other type trouble-source repair sequences at both new and reintroduced topics. From the map in Figure 3, we also see that Factor 2 contrasts the following variables: (1) DAT initiated troublesource repair sequences at one utterance following topic introductions and spouse initiated trouble-source repair sequences at two utterances following topic introduction vs. DAT initiated trouble-source repair sequences at two utterances following topic introductions and spouse initiated trouble-source repair sequences at topic introductions, at two utterances following topic introductions, and one utterance following social unit introductions (Figure 3a); (2) DAT initiated new and reintroduced topics, tangential topic shifts, spouse initiated reintroduced topics, and topic shifts vs. spouse initiated topic change and non-coherent topic change (Figures 3c and 3d); (3) DAT semantic trouble source in DAT initiated trouble-source repair sequences, DAT cognitive trouble source in spouse initiated trouble-source repair sequences, and spouse discourse trouble source in DAT initiated trouble-source repair sequences vs. DAT cognitive trouble source in DAT initiated trouble-source repair sequences, spouse semantic and other trouble source in spouse initiated trouble-source repair sequences (Figure 3e). All together, this suggests that Factor 2 represents when both the individual with DAT and their spouses encounter trouble sources. 2
The contributions of the variables are available for download at www.utdallas.edu/∼herve
8
WILLIAMS, ABDI, FRENCH & ORANGE
The individual with DAT has more difficulty at topic transitions and following their spouses reintroduction of a previous topic. In contrast, the spouses had more difficulty one utterance past the topic transition, suggesting that they are not understanding the individual with DAT’s utterance.
Putting It All Together Now that we have defined the factors in terms of both the observations/groups and the variables of the original data set, we need to integrate the information from both the rows and the columns to interpret the factors. For Factor 1, individuals with DAT produce discourse and other trouble source when a topic or subtopic is reintroduced. In contrast, spouse initiated trouble-source repair sequences occur when there is a shift to a new topic, while DAT initiated trouble-source repair sequences occur when there is a cognitive trouble source. Because the first set of variables falls to the left of the origin of the axes, one can say that cognitive and other trouble source at reintroduced topics and subtopics characterizes the performance of the MDAT group. The second set of variables, falling to the right of the origin, characterizes the performance of the CTRL group. For Factor 2, the occurrence of trouble source at topic boundaries other than topic introductions (i.e., greater than two utterances after a topic introduction and one utterance past a subtopic or social unit introduction) characterize the performance of the EDAT group, whereas the second set of variables is more characteristic of the CTRL and MDAT groups’ performances.
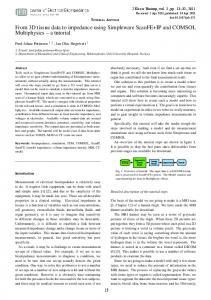
Analyzing “Blocks” of Variables: Multi-Block Discriminant Correspondence Analysis (MUDICA) So far DICA characterizes the patterns of performance of the three diagnostic groups. However, as researchers, we often want to know more about some subsets of the variables. A common example would be to examine differences in discourse performance on language vs. memory related variables. In our example, we wanted to analyze the differences in patterns of performance between the trouble-source repair sequences initiated by the DAT participants and by their spouses because we expected that they would play different roles in their conversations. To analyze these differences we used a multi-block discriminant correspondence analysis (MUDICA). To perform MUDICA, we divided the group by variable contingency table into two blocks or sub-tables (see Figure 1–MUDICA): One block represents the trouble-source repair sequences initiated by the DAT participants and the other block represents the trouble-source repair sequences initiated by the spouses. We computed the average performance of the DAT participants and of their spouses. Then, we projected the averages of the two blocks into the original factor space as supplementary elements. This procedure is outlined in Figure 1-MUDICA. For our example, MUDICA produced the map shown in Figure 4. The map(s) produced by MUDICA are interpreted
2 CTRL
MDAT λ1 = 0.08 τ1 = 66%
MDATDAT
CTRLDAT
CTRLSP MDATSP
1
SP
DAT EDATDAT EDATSP
EDAT λ2 = 0.04 τ2 = 34%
Figure 4. Multi-block discriminant correspondence analysis. The blocks representing trouble-source repair sequences initiated by the DAT participants and the spouses were projected into the DICA space as supplementary elements. DAT = trouble source sequence initiated by DAT participant, SP = trouble-source repair sequence initiated by spouse, CTRL = Control, EDAT = early stage DAT, MDAT = middle stage DAT. Factor 1: λ1 = 0.08, τ1 = 66%. Factor 2: λ2 = 0.04, τ2 = 34%. Note that in DICA λ is always smaller than 1.
as the observations/groups and variable maps previously described. Factor 1 separates the two blocks. Note that troublesource repair sequences initiated by the spouses closely resemble the performance of the CTRL group in the original DICA . In our example, we also could have projected the three types of variables as blocks (i.e., trouble-source repair, topic, and sequencing variables). The decision on which blocks to project depends on the research question of interest.
From Descriptive to Inferential So far, DICA, and by extension MUDICA, provide a description of the patterns of variables that differentiate the diagnostic groups. However, DICA does not assess the quality or the robustness of this description. This assessment requires an inferential step which determines the quality of the discrimination for the observations used to create the discriminative model, the quality of the discrimination for new observations, and the significance of the results of the DICA. To determine the quality of group assignment, we compute an R2 and we look at how the DICA model assigns observations to groups. To determine the significance of the DICA model, we compute confidence intervals around the groups. We determine the quality of DICA group assignment in three ways. First, we examine how much variance of the observations is explained by their groups. Second, we examine the accuracy of the assignment both within our sample and for new observations. Finally, we examine the separability of the groups.
USING MUDICA TO ANALYZE DISCOURSE
Table 3 Fixed Effect Model: DICA assignment of dyads within the sample to the CTRL, EDAT, and MDAT groups Actual group Assigned group CTRL EDAT MDAT
CTRL
EDAT
MDAT
5 1 0
0 5 0
0 1 5
Quality of Group Assignment: R2 and the Permutation Test In order to evaluate the quality of group assignment, we compute an R2 which expresses the proportion of variance explained by group membership. In MUDICA, the total variance is the sum of the distances between all points and the grand barycenter (i.e., the origin in the DICA/MUDICA maps). In a way analogous to ANOVA, for which the sum of squares total is equal to sum of the between groups sum of squares and the within groups sum of squares, MUDICA decomposes the total variance (a.k.a. total inertia) into between groups and within groups variance. Specifically, R2 is computed as R2 =
between group variance . total variance
R2 takes values between 0 and 1 and is a squared correlation coefficient. If group membership is random, then R2 is close to zero. If group membership is systematic, R2 is close to one. So, a large R2 value indicates that observations can be reliably assigned to the groups (Abdi & Williams, in press-a). To assess significance of R2 we use a permutation test. A permutation test randomly assigns observations repeatedly to the groups and computes the R2 values associated with each random group assignment. This gives a probability distribution for R2 under the null hypothesis (i.e., when the assignment of the observations to the groups is random), and this distribution can then be used to derive p-values. When we reject the null hypothesis, the assignment of the observations to their groups is not due to chance. For our example, R2 is .7534 with a p-value less than .001. This confirms that group assignment is reliable.
Fixed Effect Model: Accuracy and Separability of Group Assignment Within the Sample How well DICA classifies observations within the sample is called a fixed effect model.
Accuracy: Fixed effect confusion matrix In order to assign an observation to a group, DICA computes the distance between this observation and all groups and then assigns this observation to the closest group. Table 3 shows the DICA’s assignment of the dyads within our sample to the CTRL, EDAT, and MDAT groups.
9
Within our sample, the observations are well classified by the DICA. It correctly assigned five of six CTRL dyads, all five EDAT dyads, and five of six MDAT dyads. The misclassified dyads in the CTRL and MDAT groups were both assigned to the EDAT group. This misclassification arises because of the variability of the EDAT and MDAT groups.
Separability: Tolerance intervals The accuracy of the assignment of the observations to their groups can be expressed graphically by tolerance intervals (see Figure 1–Tolerance Intervals). Tolerance intervals are computed so that they encompass a given proportion of the observations. In two dimensions, these intervals have the shape of ellipses and are often called tolerance ellipsoids. For example, a ninety-five percent tolerance interval indicates the range in which 95% of the observations from a given group, fall and, like the confusion matrix, the tolerance intervals represent how well the DICA assigns observations to the groups. In the tolerance interval map, when two groups do not overlap, they are separable (Abdi, Dunlop & Williams, 2009). For our example, we computed the 95% tolerance intervals. They are shown in Figure 5a. From the display, we can see that the tolerance intervals for all three groups overlap. Therefore, the EDAT, MDAT, and CTRL groups are not separable. However, the small amount of overlap indicates that the DICA model shows good performance.
Random Effect Model: Accuracy of Group Assignment of New Observations Knowing how well DICA assigns observations within our sample is important. However, as clinical researchers, we are really interested in classifying new clients or participants whose diagnosis is unknown. Although the fixed effect model gives a good representation of the variability within the sample, the fixed effect tolerance intervals over-estimate the separability of groups in the population. This is because the same observations are used both to develop and to test the model and this can result in gross overestimation of the predictive performance of the model (Cureton, 1950; Kriegeskorte, Simmons, Bellogowan & Baker, 2009; Vul, Harris, Winkielman & Pashler, 2009). In order to correctly estimate the performance of the model, we need to use different sets of observations to build and to test the DICA model. This amounts to assigning new observations to groups and corresponds to a random effect model.
Accuracy: Random effect confusion matrix In order to evaluate the performance of DICA for a random effect model, we used a jackknife (a.k.a. “leave one out”) procedure (see Appendix C and Abdi & Williams, in press-d). The jackknife removes each observation in turn and recalculates the DICA without this observation. The removed observation is then projected into the DICA space as a supplementary element and the distance between that observation and each group is computed. The removed observation is
10
WILLIAMS, ABDI, FRENCH & ORANGE
2
2
MDAT
2
MDAT
MDAT
CTRL λ1 = 0.08 τ1 = 66%
CTRL λ1 = 0.08 τ1 = 66%
1
CTRL 1
EDAT
λ1 = 0.08 τ1 = 66%
1
EDAT
λ2 = 0.04 τ2 = 34%
λ2 = 0.04 τ2 = 34%
(a)
EDAT
λ2 = 0.04 τ2 = 34%
(b)
(c)
Figure 5. (a) 95% Tolerance Intervals. Tolerance intervals represent the range in which 95% of each of the CTRL, EDAT, and MDAT groups’ scores should fall in the population. Because the tolerance intervals for all 3 groups overlap, the CTRL, EDAT, and MDAT groups cannot be reliably separated; and (b) 95% Prediction Intervals. Prediction intervals represent the range in which 95% of new CTRL, EDAT, and MDAT scores should fall in the population. Because the prediction intervals for all 3 groups overlap, the CTRL , EDAT , and MDAT groups cannot be reliably separated; (c) 95% Confidence Intervals. Confidence intervals represent the range in which the population parameter will fall 95% of the time. Because the CTRL group’s confidence ellipse does not overlap with the EDAT and MDAT groups’ ellipses, the CTRL group is significantly different from the EDAT and MDAT groups at the p ≤ .05-level. CTRL = Control, EDAT = early stage DAT, MDAT = middle stage DAT. Factor 1: λ1 = 0.08, τ1 = 66%. Factor 2: λ2 = 0.04, τ2 = 34%. Note that in DICA λ is always smaller than 1.
Table 4 Random Effect Model: DICA assignment of new dyads to the CTRL , EDAT, and MDAT groups Actual group Assigned group CTRL EDAT MDAT
CTRL
EDAT
MDAT
5 1 0
2 2 1
0 4 2
then assigned to its closest group. Table 4 shows the random effect model assignment of “new” dyads to the CTRL, EDAT, and MDAT groups.
For the random effect model, observations from the CTRL group are well classified by the DICA which, like for the fixed effect model, correctly assigned five of six dyads (the misclassified dyad was assigned to the EDAT group). D ICA, however, performed less well in assigning new observations to the EDAT and MDAT groups. D ICA correctly classified two of the dyads to the EDAT and MDAT groups, respectively. From the three misclassified dyads in the EDAT group, two were assigned to the CTRL group and one was assigned to the MDAT group. The four misclassified dyads from the MDAT group were all assigned to the EDAT group. The group assignment using the random effect model suggests that it is unlikely that a new CTRL dyad will be misclassified as an MDAT dyad (and vice versa). However, both the CTRL and the MDAT dyads could potentially be misclassified as an EDAT dyad. In addition, a new EDAT dyad could be assigned to any of the diagnostic groups. The random effect model supports the interpretation of increased variability in trouble-source repair at topic boundaries in the EDAT and MDAT groups.
Separability: Prediction intervals Like in the fixed effect model, we can examine the separability of the groups in a random effect model. To do this, we compute a prediction interval for each group (see Figure 1– Prediction Intervals). A ninety-five percent prediction interval indicates the range in which 95% of the population should fall and therefore represents how well the DICA assigns new observations to the groups. In the prediction interval map, when two groups do not overlap, their corresponding populations are separable (Abdi et al., 2009). To compute the prediction intervals, we again used the jackknife procedure on the original observations and projected the jackknifed observations in the DICA space. The 95% prediction intervals are shown in Figure 5b. Like in the fixed effect model, the EDAT, MDAT, and CTRL groups overlap and cannot be reliably separated. This confirms the fixed effect findings that the groups cannot be reliably separated. However, note that in a random effect model, prediction intervals, unlike tolerance intervals are not centered around the sample means. The difference between the group mean and the mean of the corresponding prediction interval reflects the “bias of the estimation” because a group mean is only an estimator of the population mean.
Determining Significance of Group Differences: Bootstrap Confidence Intervals Finally, we need to determine whether the group differences in the DICA model are statistically significant. To do this, we compute a 95% confidence interval for each group. The American Psychological Association (APA) recommends using confidence intervals over standard null hypothesis testing because confidence intervals specify the range of values that likely includes the population parameter of interest (Wilkinson and the Task Force on Statistical Infer-
11
USING MUDICA TO ANALYZE DISCOURSE
ence, 1999; Publication Manual of the American Psychological Association, 2001). If we compute confidence intervals from samples taken repeatedly from the population we create a population sampling distribution. A certain percentage of the samples from the population (usually set a priori to 95%) will contain the parameter (Easton & McColl, n.d.). We can estimate the population sampling distribution by sampling within our sample using the bootstrap. The bootstrap is a non-parametric resampling technique that is used to estimate sampling distributions (Efron & Tibshirani, 1993; Hesterberg, Moore, Monaghan, Clipson & Epstein, 2005). For the bootstrap, a large number of new samples of the diagnostic groups (usually 1,000 or 10,000) are created. The new samples for the CTRL, EDAT, and MDAT groups have the same number of observations as the original groups and are obtained by sampling the dyads with replacement within their respective diagnostic groups. When we draw with replacement, each observation is put back into the sample after it has been drawn, therefore a given observation can be drawn several times, once, or not at all (see Figure 1–Resample with replacement). We resampled within the CTRL, EDAT, and MDAT groups 10,000 times. We then projected the observations from the bootstrapped samples into the original DICA space as supplementary elements (see Figure 1–Confidence Intervals). The resulting confidence intervals are shown in Figure 5c. To make the graph easier to read, the dispersion of the dyads around each diagnostic group is represented by a 95% confidence ellipse centered on the group. The confidence ellipses are read the same way as confidence intervals. That is, when two confidence ellipses do not overlap, they represent different populations and the corresponding groups can be declared significantly different at the α = .05 level (Abdi et al., 2009). We can see from Figure 5c that the 95% confidence ellipse for the CTRL group does not overlap with the ellipses from the EDAT and MDAT groups. Therefore, the CTRL group can be considered significantly different from the EDAT and MDAT groups (p < .05). However, there is no significant difference between the EDAT and MDAT groups because their confidence intervals overlap.
Discussion Overall, the DICA found that topic boundaries did affect trouble-source repair sequences in spousal conversational dyads where one member has probable DAT. In the early stage, DAT dyads had more difficulty with subtopic and social unit boundaries after a topic transition. This suggests a reduction in the cognitive flexibility required to shift and/or change topics and confirms the findings of Mentis et al. (1995) and Garcia and Joanette (1994; 1997). In middle stage DAT, dyads began to show cognitive trouble source when a topic or subtopic was reintroduced. This suggests that topic and subtopic reintroduction may function as a type of event boundary and also that individual with DATs may experience more difficulty due to the increased memory load inherent in boundaries/transitions (Speer & Zacks, 2005). As such,
individuals with middle stage DAT may have trouble recalling previously introduced information and have trouble using shared knowledge with their spouse. However, these differences between the EDAT and MDAT groups may be more a matter of degree than type because the groups could not be reliably separated. These findings have important implications for understanding the nature of conversation breakdowns in DAT and their association with topic management. Understanding these associations is crucial for developing successful communication enhancement education and training programs and testing empirically-based enhancement strategies for spousal caregivers of individuals with DAT (Savundranayagam, Hummert & Montgomery, 2005). In this paper we describe DICA which is a method that describes patterns of performance of a priori determined diagnostic groups. Using DICA, the relationships between groups and between variables can be displayed in two maps. With the addition of a hierarchical or multiblock component (MUDICA), we can also visualize the groups’ performance(s) on blocks representing subsets of variables. Furthermore, we can add inferential steps that show the reliability of the analysis through confidence and tolerance intervals. These inferential steps help determine whether the a priori designated groups significantly differ and how well the DICA model categorizes old and new observations. As such, DICA provides an ideal method to analyze language and discourse data in communication disorders research, especially data sets with few observations described by a large number of qualitative and quantitative variables.
Software D ICA and MUDICA are based on correspondence analysis which is implemented by most statistical packages such as SAS (PROC CORRESP) and SPSS / PASW (model CATE GORIES ) and therefore, in principle, any standard package can be used as long as the data are correctly pre-processed (see Appendix C for technical details). The freely available package [R] incorporates several libraries dedicated to correspondence analysis (e.g., ca, factoMineR, and ade4 which also incorporates DICA), and a library (written by Derek Beaton), specially written to implement the MUDICA analyses described here is available from the the home page of the second author (http://www.utd.edu/∼herve). Finally, the set of M ATLAB programs and the dataset used for this paper also are available from the home page of the second author.
References Abdi, H. (2007a). Discriminant correspondence analysis. In N. Salkind (Ed.), Encyclopedia of Measurement and Statistics (pp. 270–275). Thousand Oaks, CA: Sage. Abdi, H. (2007b). Distance. In N.J. Salkind (Ed.), Encyclopedia of Measurement and Statistics (pp. 280–284). Thousand Oaks, CA, Sage.
12
WILLIAMS, ABDI, FRENCH & ORANGE
Abdi, H. (2007c). Eigen-decomposition: eigenvalues and eigenvecteurs. In N.J. Salkind (Ed.), Encyclopedia of Measurement and Statistics (pp. 304–308). Thousand Oaks, CA: Sage. Abdi, H. (2007d). Singular Value Decomposition (SVD) and Generalized Singular Value Decomposition (GSVD). In N.J. Salkind (Ed.), Encyclopedia of Measurement and Statistics (pp. 907– 912). Thousand Oaks (CA): Sage. Abdi, H., Dunlop, J. P., & Williams, L. J. (2009). How to compute reliability estimates and display confidence and tolerance intervals for pattern classifiers using the Bootstrap and 3-way multidimensional scaling (DISTATIS). NeuroImage, 45, 89–95. Abdi, H. & Valentin, D. (2007). Multiple correspondence analysis. In N.J. Salkind (Ed.), Encyclopedia of Measurement and Statistics (pp. 651-657). Thousand Oaks, CA: Sage. Abdi, H. & Williams, L. J. (2010a, in press). Barycentric discriminant analysis. In N.J. Salkind, D.M., Dougherty, & B. Frey (Eds.), Encyclopedia of Research Design. Thousand Oaks, CA: Sage. Abdi, H. & Williams, L. J. (2010b, in press). Coefficients of correlation, alienation and determination. In N.J. Salkind, D.M., Dougherty, & B. Frey (Eds.), Encyclopedia of Research Design. Thousand Oaks, CA: Sage. Abdi, H. & Williams, L. J. (2010c, in press). Correspondence analysis. In N.J. Salkind, D.M., Dougherty, & B. Frey (Eds.), Encyclopedia of Research Design. Thousand Oaks, CA: Sage.
Greenacre, M. J. (2007). Correspondence Analysis in Practice. Boca Raton, FL: Chapman & Hall/CRC. Gottman, J. M. (1979). Time-series analysis of continuous data in dyads. In M. E. Lamb, S. J. Suomi, & G. R. Stephenson (Eds.), Social Interaction Analysis: Methodological Issues (pp. 207– 229). Madison, WI: University of Wisconsin Press. Guendouzi, J., & M¨uller, N. (2002). Defining trouble-sources in dementia: Repair strategies and conversational satisfaction in interactions with an Alzheimer’s patient. In F. Windson, M. L. Kelly, & N. Hewlett (Eds.), Investigations in Clinical Phonetics and Linguistics (pp. 15–30). Mahwah, NJ: Lawrence Erlbaum Associates. Hesterberg, T., Moore, D. S., Monaghan, S., Clipson, A., & Epstein, R. (2005). Bootstrap methods and permutation tests. In G. P. McCabe & D. S. Moore (Eds.), Introduction to the Practice of Statistics (pp. 14.1–14.70). New York: W.H. Freeman Company. Klecka, W. R. (1980). Discriminant Analysis. Thousand Oaks, CA: Sage. Kriegeskorte, N., Simmons, W. K., Bellgowan, P. S. F., & Baker, C. I. (2009). Circular analysis in systems neuroscience: The dangers of double dipping. Nature Neuroscience, 12, 535–540. Le Roux, B. & Rouanet, H. (2010). Multiple Correspondence Analysis. Thousand Oaks, CA: Sage.
Abdi, H. & Williams, L. J. (2010d, in press). Jackknife. In N.J. Salkind, D.M., Dougherty, & B. Frey (Eds.), Encyclopedia of Research Design. Thousand Oaks,CA: Sage.
McKahnn, G., Drachman, D., Folstein, M., Katzman, R., Price, D., & Stadlan, E. (1984). Clinical diagnosis of Alzheimer’s disease: Report of the NINCDS-ADRDA work group under the auspices of the Department of Health and Human Services Task Force on Alzheimer’s Disease. Neurology, 34, 939–944.
Abdi, H. & Williams, L. J. (2010e, in press). Principal component analysis. Wiley Interdisciplinary Reviews: Computational Statistics, 2.
Mentis, M., Briggs-Whittaker, J., & Gramingna, G.D. (1995). Discourse topic management in senile dementia of the Alzheimer type. Journal of Speech and Hearing Research, 38, 1054–1066.
Abdi, H. & Williams, L.J. (2010f, in press). Matrix algebra. In N.J. Salkind, D.M., Dougherty, & B. Frey (Eds.), Encyclopedia of Research Design. Thousand Oaks,CA: Sage.
Molloy, D., Alemayheu, E., & Roberts, R. (1991). Reliability of a Standardized Mini-Mental State Examination compared with the traditional Mini-Mental State Examination. American Journal of Psychiatry, 148, 102–105.
Cureton, E. E. (1950). Validity, reliability, and baloney. Educational and Psychological Measurement, 10, 94–96. Easton, V. J. & McColl, J. H. (n.d.). Statistics Glossary. Retrieved January 10, 2009, from http://www.stats.gla.ac.uk/steps/glossary/index.html Efron, B., & Tibshirani, R. (1993). An Introduction to the Bootstrap. Boca Raton, FL: Chapman and Hall/CRC. Garcia, L. J., & Joanette, Y. (1994). Conversational topic-shifting analysis in dementia. In R. L. Bloom, L. K. Obler, S. De Santi, & J. S. Ehrlich (Eds.), Discourse Analysis and Applications: Studies in Adult Clinical Populations (pp. 161–183). Hillsdale, NJ: Lawrence Erlbaum Associates. Garcia, L. J., & Joanette, Y. (1997). Analysis of conversational topic shifts: A multiple case study. Brain and Language, 58, 92–114. Greenacre, M. J. (1984). Theory and Applications of Correspondence Analysis. London: Academic Press.
Orange, J. B. Lubinski, R., & Higginbotham, D. (1996). Conversational repair by individuals with dementia of the Alzhiemer’s type. Journal of Speech and Hearing Research, 39, 881–895. Orange, J. B., & Colton-Hudson, A. (1998). Enhancing communication in dementia of the Alzheimers type. Topics in Geriatric Rehabilitation, 14, 56–75. Orange, J. B., Van Gennep, K. M., Miller, L., & Johnson, A. M. (1998). Resolution of communication breakdown in dementia of the Alzheimers type: A longitudinal study. Journal of Applied Communication Research, 26, 120–138. Publication Manual of the American Psychological Association, 5t h edition (2001). Washington, DC: American Psychological Association. Reisberg, B., Ferris, S., De Leon, M., & Crook, T. (1982). The global deterioration scale for assessment of primary degenerative dementia. American Journal of Psychiatry, 139, 1136–1139.
USING MUDICA TO ANALYZE DISCOURSE
Santo Pietro, M. (1994). Assessing the communication styles of caregivers of patients with Alzheimer’s disease. Seminars in Speech and Language, 15, 236–254. Savundranayagam, M. Y., Hummert, M. L., & Montgomery, R. J. V. (2005). Investigating the effects of communication problems on caregiver burden. The Journals of Gerontology Series B: Psychological Sciences and Social Sciences 60, S48–S55. Shewan, C. (1988). The Shewan Spontaneous Language Analysis (SSLA) system for aphasic adults: Description, reliability, and validity. Journal of Communication Disorders, 21, 103–138. Spanier, G. (1976). Measuring dyadic adjustment: New scales for assessing the quality of marriage and similar dyads. Journal of Marriage and Family, 38, 15–28. Speer, N. K. & Zacks, J. M. (2005). Temporal changes as event boundaries: Processing and memory conseuqnces of narrative time shifts. Journal of Memory and Language, 53, 125 – 140. Vul, E., Harris, C., Winkielman, P., & Pashler, H. (2009). Puzzlingly high correlations in fMRI studies of emotion, personality, and social cognition. Perspectives on Psychological Science, 4, 274–290. Watson, C. M., Chenery, H. J. & Carter, M. S. (1999). An analysis of trouble and repair in the natural conversations of people with dementia of the Alzheimers type. Aphasiology, 13, 195–218. Wilkinson, L. and the Task Force on Statistical Inference (1999). Statistical methods in psychology journals: Guidelines and explanations. American Psychologist, 54, 594–604. Wilson, R., Rosenbaum, G., & Brown, G. (1979). The problem of premorbid intelligence in neuropsychological assessment. Journal of Clinical Neuropsychology, 1, 49–53.
Appendix A Group by Variable Contingency Table for Trouble-source repair and Topic Dataset Appendix B Definitions of Variables Trouble-source Repair Variables We coded trouble-source repair sequences using a modified version of the trouble-source repair variables described by Orange, Lubinski, and Higginbotham (1996), Orange and Colton-Hudson (1998), and Orange, Van Gennep et al. (1998). Trouble-source repair variables refer to problems related to speaking, hearing, attending, or understanding. They represent and identify problems in the interaction between conversation partners. Trouble sources related to an incongruence of the intent and the understanding of a speaker and a listener and may result from difficulties in the output of the speaker or mishearings by the listener (Orange & ColtonHudson, 1998, p. 8).
13
Trouble-source Type Semantic (Sem): Disturbances related to lexical access, word recall, word retrieval, and accurate or known word use. Discourse (Disc): Difficulties relating to the listener’s apparent comprehension of topic content (e.g., maintenance, change, accuracy, initiation), shared knowledge (e.g., clarity and relevance), and cohesion (e.g., referencing problems). Cognitive (Cog): Related to memory impairment; Previously discussed information is reintroduced as if not previously mentioned or discussed. Phonological (Phon): Mispronunciations, slips of the tongue, and poor knowledge of rules for sound combinations. Morphological/ Syntactical (Morph): Disturbances in grammatical and syntactical rule systems (e.g., time and possession markers, agreement, and word order problems). Other: Problems that cannot be unambiguously classified (e.g., abandoned/incomplete utterances, unrepaired utterances, no indication in repair initiation to nature of trouble source, direct repetitions without paralinguistic/nonverbal adjustments).
Trouble-source Repair Sequence Complexity Trouble-source repair sequence complexity refers to whether or not there are embedded or secondary trouble sources in the trouble-source repair sequence. Simple: Trouble-source repair sequence consists of a single trouble source, repair initiator, and repair or a trouble source and repair without a repair initiator. Complex: Trouble-source repair sequence contains a primary trouble source and one or more embedded or secondary trouble sources.
Degree of Resolution Success Resolution variables refer to the outcome of the repairing process. Resolutions describe how trouble-sources are overcome by participants. Most successful: A single trouble source, repair initiator and repair or a single trouble source and repair with no repair initiator; Partners continue with the conversation on topic or move appropriately to a new topic.
14
WILLIAMS, ABDI, FRENCH & ORANGE
Table A1 Group by variable contingency table Individual with DAT
C TRL E DAT M DAT
# TS
Tintro
Tintro+1
Tintro+2
Tintro>2
STintro
STintro+1
STintro+2
31 38 56
14 20 37
1 5 5
6 1 1
3 3 5
2 2 1
1 2 1
0 0 1
continued . . . NB: In complex trouble-source repair sequences, individual trouble sources may come from the individual with DAT or the spouse, regardless of who initiated the trouble-source repair sequence. TS = trouble source T = superordinate topic intro = topic introduction +1 = plus one utterance +2 = plus two utterances > 2 = plus greater than 2 utterances ST = subordinate topic SU = social unit Res = trouble source resolution success
Individual with DAT
C TRL E DAT M DAT
STintro>2
SUintro
SUintro+1
SUintro+2
SUintro>2
Tnew
Treintroduced
3 0 0
0 2 2
3 2 2
3 0 0
0 1 1
1 8 17
0 21 31 continued . . .
Individual with DAT
C TRL E DAT M DAT
Change
Shift
Non-Coherent Change
Tangential Shift
STnew
STreintroduced
12 19 28
12 10 15
0 0 1
0 0 4
27 32 38
1 1 13 continued . . .
Individual with DAT
C TRL E DAT M DAT
TS discourseDAT
TS cognitiveDAT
TS semanticDAT
TS phonologicalDAT
TS otherDAT
TS discoursespouse
28 22 15
2 5 22
3 8 3
0 0 1
3 10 20
3 8 9 continued . . .
15
USING MUDICA TO ANALYZE DISCOURSE
Individual with DAT TS cognitivespouse
TS semanticspouse
TS otherspouse
TS simple
TS complex
Resmost-successful
0 1 0
1 0 0
0 1 1
24 26 47
7 12 9
22 22 39
C TRL E DAT M DAT
continued . . . Individual with DAT
Spouse
Ressuccessful
Resunsuccessful
TS
Tintro
Tintro+1
Tintro+2
Tintro>2
9 11 12
0 5 5
47 40 39
29 11 20
4 6 4
1 2 3
3 7 0
C TRL E DAT M DAT
continued . . . Spouse
C TRL E DAT M DAT
STintro
STintro+1
STintro+2
STintro>2
SUintro
SUintro+1
SUintro+2
SUintro>2
4 4 6
0 3 0
1 0 0
2 2 1
1 1 4
1 3 0
1 0 0
0 1 1 continued . . .
Spouse
C TRL E DAT M DAT
Tnew
Treintroduced
Change
Shift
Non-Coherent Change
STnew
STreintroduced
22 13 10
15 13 17
16 20 16
21 5 11
0 1 0
40 35 32
4 0 2 continued . . .
Spouse
C TRL E DAT M DAT
TS discourseDAT
TS cognitiveDAT
TS semanticDAT
TS otherDAT
TS discoursespouse
TS cognitivespouse
1 4 3
1 0 1
1 0 1
2 1 0
29 30 31
4 6 5 continued . . .
Spouse
C TRL E DAT M DAT
TS semanticspouse
TS otherspouse
TS simple
TS complex
Resmost-successful
Ressuccessful
7 1 2
13 6 12
39 34 27
8 6 12
35 31 23
9 7 9 continued . . .
16
WILLIAMS, ABDI, FRENCH & ORANGE
Spouse Resunsuccessful C TRL E DAT M DAT
3 2 7
Successful: More than one repair initiator and repair are used to successfully repair trouble source(s); Partners continue the conversation on topic or appropriately move to a new topic. Unsuccessful: More than one repair initiator and repair are used to attempt to repair trouble source(s); Trouble sources are not repaired; May result in continuation of the conversation on topic or may result in abrupt and inappropriate turn-taking, topic shift/change, or termination of the conversation.
Topic Variables We coded topic information using a modified version of the taxonomies described by Garcia and Joanette (1994, 1997) and Mentis et al. (1995).
Topic Types Global Topic: Each utterance within a topic sequence expresses the central concept of theme being addressed based on shared background knowledge of the interlocutors; May be stated explicitly or implicitly. Subtopic: An associated, but distinct concept or theme that is related back to the global topic. Topic Unit (T): A set of continuous utterances relating to the same global topic without being separated by introduction or renewal (reintroduction) of another global topic (see Global Topic). Subtopic Unit (ST): A set of continuous utterances appearing to relate to the same subtopic without being separated by introduction or renewal (reintroduction) of another subtopic or global topic (see Subtopic). Social Unit (SU): An utterance or sequence of utterances that addresses an element within the immediate social context and fulfils a social convention (e.g., politeness: “Would you like some butter?”).
Topic Introductions New topic (T{New}): A topic which has not occurred previously in the conversation. Reintroduced topic (T{Reintroduced}): A topic which has occurred previously in the conversation unrelated to the prior topic. New subtopic (ST{New}): A subtopic which has not previously occurred in the conversation but remains connected to the global topic. Reintroduced subtopic (ST{Reintroduced}): A subtopic which has previously occurred in the conversation but is unrelated to the prior global topic or subtopic.
Manner of Topic Introduction Change: The content of the new or reintroduced topic is not derived from the prior topic sequence. Shift: The topic sequence under discussion is the source for the introduction of a new topic. Non-coherent change: The (re)introduction of a topic in the absence of an established topic boundary or utterance signaling a topic transition. Tangential shift: The topic sequence under discussion is used to lead the conversation in an irrelevant or confusing direction.
Trouble-source Sequencing Variables We examined co-occurrence of trouble-source repair variables and topic variables using methods modified from Gottman (1979). For each dinner-time conversation we orthographically transcribed all utterances and placed them in sequential order. We then mapped the trouble-source repair variables and the topic variables onto the sequenced utterances and examined where they occurred in relation to each other. We coded utterances using Shewan’s (1988) definition which states that an utterance is a complete idea or thought expressed in connected words and is differentiated from other utterances on the basis of content, intonational contour, and/or pausing.
17
USING MUDICA TO ANALYZE DISCOURSE
Trouble-source at Topic Boundary
Appendix C Multi-Block Discriminant Correspondence Analysis: Formal Presentation
At topic boundary (subscript T): Trouble source occurs at topic transition. At topic boundary +1 utterance (T{+1}): Trouble source occurs one utterance after topic transition. At topic boundary +2 utterances (T{+2}): Trouble source occurs two utterances after topic transition. At topic boundary + more than 2 utterances (T{> 2}): Trouble source occurs more than two utterances after topic transition.
Trouble-source at Subtopic Boundary At subtopic boundary (subscript ST): Trouble source occurs at subtopic transition. At subtopic boundary +1 utterance (ST{+1}): Trouble source occurs one utterance after subtopic transition. At subtopic boundary +2 utterances (ST{+2}): Trouble source occurs two utterances after subtopic transition. At subtopic boundary + more than 2 utterances (ST{> 2}): Trouble source occurs more than two utterances after subtopic transition.
Trouble-source at Social Unit Boundary At social unit boundary (subscript SU): Trouble source occurs at social unit transition. At social unit boundary +1 utterance (SU{+1}): Trouble source occurs one utterance after social unit transition. At social unit boundary +2 utterances (SU{+2}): Trouble source occurs two utterances after social unit transition. At social unit boundary + more than 2 utterances (SU{> 2}): Trouble source occurs more than two utterances after social unit transition.
Multi-block discriminant correspondence analysis (MUDICA) extents discriminant correspondence analysis (DICA) to encompass multi-blocks. The first step of MUDICA is a DICA which is followed by a specific analysis which incorporates multi-blocks. The goal of DICA is to predict group membership of observations which are described by nominal variables (or by variables which represent the amount of some quantity). For multi-block discriminant analysis, the variables are also partitioned into blocks of variables, and the interest is to analyze the effect of these blocks on group membership.
Notations We have I observations each described by J variables. The values of the variables for the observations are stored in an I by J data matrix denoted X (see Abdi & Williams, in press-f, for a tutorial on matrix algebra). The observations of X are partitioned into N a-priori groups of interest with In being the number of observations of the nth group (and so N ∑ In = I). The columns of matrix X can be arranged in K a n
priori blocks (or sub-tables). The number of columns of the K ∑ kth block are denoted Jk (and so Jk = J). So, the I by J k
matrix X can decomposed into N by K blocks as
X=
1 .. . n .. . N
1 X1,1 . .. Xn,1 . . . XN,1
··· ··· .. .
k X1,k .. .
· · · Xn,k .. .. . . · · · XN,k
··· ··· .. . ··· .. . ···
K X1,K .. . Xn,K .. . XN,K
(2)
where Xn,k is an In by Jk matrix which corresponding to the nth group and the kth block. The elements of X are assumed to be positive or zeros and we assume that there are no empty rows or columns (i.e., rows or columns with only zero values).
Notations for the Groups (Rows) We denote by Y the I by N design matrix for the groups describing the rows of X: yi,n = 1 if row i belongs to group n, yi,n = 0 otherwise.
Notations for Blocks (Columns) We denote by Z the J by K design matrix for the blocks from the columns of X: z j,k = 1 if column j belongs to block k, z j,k = 0 otherwise.
18
WILLIAMS, ABDI, FRENCH & ORANGE
DICA: Discriminant Correspondence Analysis The first step of DICA is to compute the N by J matrix of the total of each group. This matrix is called S and it is computed as S = YT X . (3) The grand total of S is denoted s++ (i.e., s++ = 1T S1). From matrix S we compute a matrix of barycentric row profiles denoted R∗ and computed as R∗ = diag{S1}−1 S
(4)
where the diag operator transforms a vector into a diagonal matrix when applied to a vector and extract the vector of the diagonal elements when applied to a matrix. A row of R∗ is a profile because it is made of non-negative numbers whose sum is equal to one. When transformed into profiles, two rows can be compared independently of their overall level. The masses of the barycenters are proportional to the sum of the corresponding groups. Specifically, the N by 1 group mass vector denoted b is computed as b = S1 ×
s−1 ++
(5)
The diagonal barycenter mass matrix is obtained from the barycenter mass vector as B = diag{b} .
(6)
where ∆ is the L by L diagonal matrix of the singular values (with L being the number of non-zero singular values), and P (respectively Q) being the N by L (respectively J by L) matrix of the left (respectively right) generalized singular vectors of R (the singular vectors are also called eigenvectors and the squared singular values are also called eigenvalues, see Abdi, 2007c, for details).
Row Factor Scores The N by L matrix of factor scores for the groups is obtained as F = P∆ = RWQ . (11) The variance of the columns of F is given by the square of the corresponding singular values (i.e., the “eigenvalue” denoted λ, these are stored in the diagonal matrix Λ). This can be shown by combining Equations 10 and 11 to give: FT BF = ∆PT BP∆ = ∆2 = Λ .
Column Factor Scores (Loadings) In correspondence analysis, the roles of the row and the columns are symmetrical: They can be represented in the same map because they have the same variance. Therefore, the columns are described by factor scores which can also be interpreted as loadings. Column factor scores are used to identify the variables important for the separation between the groups. In DICA, the column factor scores are computed as (cf. Equations 10 and and 12):
The “grand barycenter,” denoted c, is the overall barycenter of matrix R∗ , it is computed as
G = WQ∆ .
c = ST 1 × s−1 ++ .
Projection of the Observations in the Discriminant Space
(7)
The weights of the columns are inversely proportional to their frequency. The weights are stored in a J by 1 vector denoted w and the corresponding J by J diagonal matrix is denoted W. Specifically, W and w are computed as: W = diag{c}−1
and
w = diag{W} .
(8)
Correspondence Analysis of the Barycenter Matrix The R∗ matrix is then analyzed using correspondence analysis. Specifically, the first step of the analysis is to center the matric R∗ in order to create a matrix of centered profiles. This matrix denoted R is computed as R = R∗ − 1c ,
(9)
(with 1 being a N by 1 vector of 1s). Then, the matrix R is analyzed with a generalized singular value decomposition under the constraints provided by the matrices B (masses for the N groups) and W (weights for the columns) as (Abdi, 2007d; Abdi & Williams, in press-e; Greenacre, 1984): R = P∆QT
with
PT BP = QT WQ = I ,
(10)
(12)
(13)
The I rows of matrix X can be projected (as “supplementary” or “illustrative” elements) onto the space defined by the factor scores of the barycenters. The first step is to transform X into a matrix of centered row profiles called L and computed as: ) ( (14) L = diag{X1}−1 X − 1c, (with 1 being an I by 1 vector of 1s). Then from Equations 10 and 11, we find that matrix WQ is a projection matrix. Therefore, the I by L matrix H of the factor scores for the rows of X can be computed as H = LWQ = LG∆−1 .
(15)
These projections are barycentric, because the weighted average of the factor scores of the rows of a group gives the factor scores of the group. Specifically, if we define M as the mass matrix for the observations as { } M = diag{m} = diag X1 × s−1 (16) ++ . Note that the factor scores of the barycenters are the barycenter of the factor scores of the projections of the observations.
19
USING MUDICA TO ANALYZE DISCOURSE
This is shown by first computing the barycenters of the row factor scores as (cf. Equation 4) as H = diag{YM1}−1 YMH ,
(17)
then plugging in Equation 15 and developing. Taking this into account, Equation 11 gives H = diag{YM1}
−1
YMXWQ = RWQ = F .
(18)
Quality of the Prediction The performance, or quality, of the prediction of a discriminant analysis is assessed by predicting the group membership of the observations and by comparing the predicted with the actual group membership. The pattern of correct and incorrect classifications can be stored in a confusion matrix in which the columns represent the actual groups and the row the predicted groups. At the intersection of a row and a column is the number of observations from the column group assigned to the row group. The performance of the model can be assessed for the observations used to compute the groups: this is the fixed effect model. In addition, the performance of the model can be estimated for new observations (i.e., observations not used to compute the model): this is the random effect model.
Fixed Effect: Old Observations The fixed effect model predicts the group assignment for the observations used to compute the barycenters of the groups. In order to assign an observation to a group, the first step is to compute the distance between this observation and all N groups. Then, the observation is assigned to the closest group. Several possible distances can be chosen, but a natural choice is the Euclidean distance computed in the factor space (Abdi, 2007b). If we denote by hi the vector of factor scores for the ith observation, and by fn the vector of factor scores for the nth group, then the squared Euclidean distance (in the factor space) between the ith observation and the nth group is computed as d2 (hi , fn ) = (hi − fn )T (hi − fn ) .
(19)
(Note that the Euclidean distance in the factor space is equivalent to the so called “chi-squared” distance in the original space). Obviously, other distances are possible (e.g., Mahalanobis distance, see Abdi, 2007b, for more), but the Euclidean distance has the advantage of being “directly read” on the map. Tolerance intervals. The quality of the group assignment of the actual observations can be displayed using tolerance intervals. A tolerance interval encompasses a given proportion of a sample or a population. When displayed in two dimensions, these intervals have the shape of an ellipse and are called tolerance ellipsoids. For DICA, a group tolerance ellipsoid is plotted on the group factor score map. This ellipsoid is obtained by fitting an ellipse which includes a given
percentage (e.g., 95%) of the observations. Tolerance ellipsoids are centered on their groups and the overlap of the tolerance ellipsoids of two groups reflects the proportion of misclassifications between these two groups.
Random Effect: New Observations The random effect model evaluates the quality of the assignment of new observations to groups. This estimation is obtained, in general, by using cross validation techniques that partition the data into a learning set (used to create the model) and a testing set (used to evaluate the model). For DICA we use a variation of this approach called the jackknife (a.k.a. “leave one out”) approach: Each observation is taken out from the data set, in turn, and then is projected onto the barycenter factor space computed from the remaining observations. This projection is then used to predict its group membership from the distances between the projected observation and the barycenters. In DICA the only pre-processing needed to project an observation consists into the transformation of this observation into a profile. This transformation does not require estimating parameters from the learning set, and this guarantees that the prediction of the left-out observation is random. The assignment of an observation to a group follows the same procedure as for a fixed effect model: the observation is projected onto the group factor scores, and the observation is assigned to the closest group. Specifically, we denote ℓi the profile vector for the ith observation, and the following matrices obtained without the ith observation are denoted (1) X−i , (2) R−i , (3) B−i and (4) W−i and refer to (1) the I − 1 by J data matrix (2) the N by J barycenter matrix, (3) the N by N mass matrix, and (4) the J by J weight matrix. All these matrices are obtained using I − 1 instead of I observations. Then the generalized eigendecomposition of R−i is obtained as (cf. Equation 10): R−i = P−i ∆−i QT−i
PT−i W−i P−i = QT−i B−i Q−i = I (20) The matrices of row and column factor scores denoted F−i and G−i are obtained as (cf. Equations 11 and 20) with
F−i = P−i ∆−i = R−i W−i Q−i
G−i = W−i Q−i ∆−i . (21) The jackknifed projection of the ith observation, denoted e hi is obtained (cf. Equation 15) as and
e hi = ℓi W−i Q−i = ℓi G−i ∆−1 −i .
(22)
Distances between the ith observation and the N groups can be computed (cf. Equation 19) with the factor scores. The observation is then assigned to the closest group. Note that the jackknife procedure assumes that there are no columns with only one non-zero entry. If there is such a columns we would create a “division by zero error” when the non-zero observation is jackknifed. Prediction intervals. In order to display the quality of the prediction for new observations we use prediction intervals.
20
WILLIAMS, ABDI, FRENCH & ORANGE
In order to compute these intervals, the first step is to project the jackknifed observations onto the original complete factor space. There are several ways to project a jackknifed observation onto the factor score space. Here we proposed a twostep procedure. First, the observation is projected onto the jackknifed space and is reconstructed from its projections. Then, the reconstituted observation is projected onto the full factor score solution. Specifically, a jackknifed observation is reconstituted from its factor scores as (cf. Equations 10 and 22): e ℓi = e hi QT−i . (23) The projection of the jackknifed observation is denoted b hi and is obtained by projecting e ℓi as a supplementary element in the original solution. Specifically, b hi is computed as: b hi = e ℓi WQ =e hi QT−i WQ = ℓi W−i Q−i QT−i WQ
(cf. Equation 11)
the sum of the squared distances of the observations to the grand barycenter (cf. Equation 19): ITotal =
I ∑
I ) ∑ ( )T ( ) ( mi hi − f hi − f . m i d 2 hi , f =
In correspondence analysis, the grand barycenter is the center of the space, and therefore f = 0 and so Equation 26 reduces to I ∑ ITotal = mi hTi hi . (27) i
The inertia of the observations relative to the barycenter of their own category is abbreviated as the “inertia within.” It is denoted IWithin and computed as IWithin =
(cf. Equation 23) (cf. Equation 22) .
(24)
Note that b hi can also be computed from the column factor scores as T −1 b hi = ℓi G−i ∆−2 . (25) −i G−i W−i G∆ The quality of the predicted group assignment of the observations as a random model can be displayed using prediction intervals. A prediction interval encompasses a given proportion of the predicted elements of a sample or a population. When displayed in two dimensions, these intervals have the shape of an ellipse and are called prediction ellipsoids. For DICA, a group prediction ellipsoid is plotted on the group factor score map. This ellipsoid is obtained by fitting an ellipse which includes a given percentage (e.g., 95%) of the predicted observations. Prediction ellipsoids are not necessarily centered on their groups, in fact the distance between the center of the ellipse and the group represents the estimation bias. Overlap of two predictions intervals directly reflects the proportion of misclassifications for the “new” observations.
Quality of the Group Separation R2 and Permutation Test In order to evaluate the quality of the discriminant model, we use a coefficient inspired by the coefficient of correlation. Because DICA is a barycentric technique, the total variance (i.e., the inertia) of the observations to the grand barycenter (i.e., the barycenter of all groups) can be decomposed into two additive quantities: (1) the inertia of the observations relative to the barycenter of their own category, and (2) the inertia of the group barycenters to the grand barycenter. Specifically, if we denote by f the vector of the coordinates of the grand barycenter (i.e., each component of this vector is the average of the corresponding components of the barycenters), the total inertia, denoted ITotal , is computed as
(26)
i
i
=
N ∑
∑
n
i in group n
I ∑
∑
n
i in group n
mi d2 (hi , fn )
(28)
mi (hi − fn )T (hi − fn ) .
The inertia of the barycenters to the grand barycenter is abbreviated as the “inertia between.” It is denoted IBetween and computed as IBetween =
I ∑
( ) bn × d2 fn , f
(29)
i
=
N ∑
( ) bn × d2 fn , f
n
=
N ∑
( )T ( ) bn × fn − f fn − f
n
=
N ∑
bn × fnT fn .
n
So the additive decomposition of the inertia can be expressed as ITotal = IWithin + IBetween . (30) This decomposition is similar to the familiar decomposition of the sum of squares in the analysis of variance. This suggest that the intensity of the discriminant model can be tested by the ratio of between inertia by the total inertia, as is done in analysis of variance and regression. This ratio is denoted R2 and it is computed as: R2 =
IBetween IBetween = . ITotal IBetween + IWithin
(31)
The R2 ratio takes values between 0 and 1, the closer to one the better the model. The significance of R2 can be assessed by permutation tests, and confidence intervals can be computed using cross-validation techniques such as the jackknife (see Abdi & Williams, in press).
21
USING MUDICA TO ANALYZE DISCOURSE
Confidence Intervals The stability of the position of the groups can be displayed using confidence intervals. A confidence interval reflects the variability of a population parameter or its estimate. In two dimensions, this interval becomes a confidence ellipsoid. The problem of estimating the variability of the position of the groups cannot, in general, be solved analytically and cross-validation techniques need to be used. Specifically, the variability of the position of the groups is estimated by generating bootstraped samples from the sample of observations. A bootstraped sample is obtained by sampling with replacement from the observations (recall that when sampling with replacement some observations may be absent and some other maybe repeated). The “bootstraped barycenters” obtained from these samples are then projected onto the discriminant factor space and, finally, an ellipse is plotted such that it comprises a given percentage (e.g., 95%) of these bootstraped barycenters. When the confidence intervals of two groups do not overlap, these two groups are “significantly different” at the corresponding alpha level (e.g., α = .05). In DICA , the bootstrap can be performed directly in the factor space by sampling the elements of matrix H and projecting their weighted means onto the factor space.
Partial Projection Each of the K blocks can be projected in the common solution. The procedure starts by rewriting Equation 10 in order to show the blocks (recall that R is the matrix of deviations to the grand barycenter, see Equation 4): R = P∆QT = P∆ [Q1 , . . . , Qk , . . . , QK ]T =
K ∑
P∆QTk ,
k
(32) where Qk is the kth block (comprising the Jk columns of Q corresponding to the Jk columns of the kth block). In addition we denote Rk the kth block of the profile matrix, Gk the kh block of the column factor scores, and Wk the diagonal matrix corresponding to the weights of the kth block. In addition, the weight of the kth block is denoted wk and defined as: trace {W} wk = . (33) trace {Wk } (where the “trace” operator gives the sum of the diagonal elements of a matrix). Then, Equation 11 is rewritten to get the projections for the k-th block as Fk = wk Rk Wk Qk = wk Rk Gk ∆−1 .
(34)
Note that we can show that F is the barycenter of the K blocks by rewriting Equations 32 and 34. Specifically we find that: K K ∑ ∑ F= Rk Wk Qk = w−1 (35) k Fk . k
k
The coordinates of a block for the observations are obtained by projecting the kth block of the observation profile matrix denoted Lk as supplementary elements. This is obtained from Equation 34 as: Hk = wk Lk Gk ∆−1
(36)
Contribution to the Inertia of a Dimension Recall from Equation 12 that, for a given dimension, the variance of the factor scores of all the N or J columns of matrix R is equal to the eigenvalue of this dimension. In order to identify the important groups, variables or blocks of variables the strategy is to compute the proportion of an element in the total (i.e., the eigenvalue). Contribution of a group or variable to a dimension. The contributions, denoted ctr, of barycenter n to factor ℓ and of column j to factor ℓ are obtained respectively as: c g2
2
bn f ctrn,ℓ = ∑ n,ℓ 2 bn fn,ℓ
=
n 2 bn fn,ℓ λℓ
j ctr j,ℓ = ∑ j,ℓ 2 c j f j,ℓ
and
j
=
ci g2j,ℓ λℓ
(37)
.
Contributions help locating the observations important for a given factor. An often used rule of thumb is to consider that the important contributions are larger than the average contribution, which is equal to the number of elements (i.e., 1I for the barycenters and 1J for the columns). A dimension is then interpreted by opposing the positive elements with large contributions to the negative elements with large contributions. Inertia and contribution to the inertia of a block. Because each block comprises a set of columns, the contribution of a block to a dimension can be expressed as the sum of this dimension squared factor scores of the columns of this block. Precisely, the inertia for the kth table and the ℓth dimension is computed as: ∑ Iℓ,k = c j g2ℓ, j . (38) j∈Jk
Note that the sum of the inertia of the blocks gives back the total inertia: ∑ λℓ = Iℓ,k . (39) k
The contribution of a block to a dimension is simply the sum of the contribution of it columns. Specifically, if we denote by ctrk,ℓ the contribution of the kth block to the ℓth dimension is computed as ∑ ctr jℓ2 (40) ctrℓ,k = j∈Jk
Note that the sum of the inertia of the blocks is equal to one.