A Tutorial on Polynomial Regression through Linear Algebra Abstract – This is a tutorial on polynomial regression. Three different methods for fitting paired data to a polynomial are presented. The first two are based on linear algebra while the last one is a graphic solution. These methods can be easily implemented with Excel, by writing a computer program, or with a programmable calculator. Keywords: polynomial regression, linear algebra, determinants, matrix inversion, cramer’s rule Published: 04-21-2018; Updated: 06-04-2018 © E. Garcia, PhD;
[email protected] m
Introduction If you are a chemist, biodesigner, or a researcher working in other fields, eventually you may need to fit a paired data set to a polynomial regression model. You could use software to do that, or build your own solution. This tutorial is aimed at those interested in the latter. Three different methods for implementing polynomial regression are described. Teachers and students might benefit from the tutorial since the calculations can be done with a spreadsheet software like Excel, by writing a computer program, or with a programmable calculator.
The Problem A paired data set of size n can be modeled with a k-degree polynomial of the form
(1)
where x is the independent variable and y the dependent variable. Frequently in a laboratory setting x is an experimental measurement, y an instrument response, and the regression analysis is aimed at making predictions or constructing calibration curves. These curves ask for unique (independent) solutions. In (1) the a’s are regression coefficients that minimize the sum of squares or residual (Weisstein, 2018)
(2)
2
Taking partial derivatives of R2 respect to the a’s and setting each derivative equal to zero leads to
(3)
or, in matrix notation
(4)
where
(5)
(6)
(7)
For k = 1 (simple linear regression), the a’s in (3) can be found by manual substitution, like this
(8)
(9)
3
As k increases, it is quite messy to find regression coefficients by manual substitution. You may want to use algorithmic methods that, when necessary, can be automated. In the next sections we describe three different methods for doing this.
The Determinants Method This method uses Cramer’s Rule. The a’s are computed, one at a time, as the ratio of two determinants
(10)
In (10),
is the matrix
with the ith column replaced by the column vector ; i.e.
(11)
(12)
(13)
Once these matrices are stated their determinants are computed and divided by the determinant of matrix . This method can be implemented by hand, preferable for low degree polynomials that ask for quadratic (k = 2) and simple (k = 1) regression. An example of this method is given at the Neutrium site (https://neutrium.net/mathematics/least-squares-fitting-of-a-polynomial/). For k > 2 working with determinants can be messy so you may want to automate the process. The MDETERM built- in function of Microsoft’s Excel can be used for this purpose. An example
4
using the NIST data from https://www.itl.nist.gov/div898/handbook/pmd/section6/pmd611.htm is available at http://www.minerazzi.com/tutorials/polynomial-regression-determinants.xlsx One advantage of Cramer’s Rule is that it can be used to tests if a system is dependent, independent, or inconsistent. Let us address this point. If the determinants of
and of each of the
’s are zero the system is dependent (multiple
solutions are possible), which contradicts the independence assumption required for the calibration curves. On the other hand, if the determinant of
is zero and at least one of the
’s
is nonzero the system is inconsistent (no solution is possible). In both cases we cannot reach a unique solution. For polynomials of higher degrees, this method of calculating regression coefficients, one at a time, is computationally expensive. Better solutions do exist. One of such solutions is given in the next section.
The Inversion Method Unlike the previous method, this one finds all of the regression coefficients at once. We first multiply (4) by
, the inverse of , like this
(14)
Since
, we are done!
(15)
This solution is suitable for automation with Excel’s MINVERSE and MMULT built- in functions. A working example using the NIST data from the previous method is given at http://www.minerazzi.com/tutorials/polynomial-regression- inversion.xlsx. If you are not familiar with these functions, we have two tools that can take care of these calculations for you:
Matrix Inverter (http://www.minerazzi.com/tools/matrix-inverter/gauss-jordan.php)
Matrix Multiplier (http://www.minerazzi.com/tools/matrix- multiplier/multiplier.php)
5
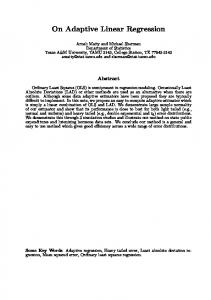
A Graphical Method Without Linear Algebra We want to end this tutorial by including a “black box” approach, for those that want a graphical solution or might not be familiar with linear algebra. Excel excellent graphical capabilities let you fit a data set to all kind of mathematical models. The following recipe, depicted in Figure 1, can be used for this purpose. (a) Open an Excel workbook, and enter your paired (x,y) data set in two different columns, with the x values at the left of the y values. Select all values and create a scatter graph. (b) Right-click on one of the points displayed in the scatter graph to display a context menu and select the Add Trendline… option. (c) Select a model. For polynomial regression, specify a degree (order) and Display Equation on chart. Customize the graph any way you want to. We left that as a homework for you.
(a)
(c)
(b)
Figure 1. Excel screenshots illustrating how to graphically fit paired data to a model.
6
Conclusion We have presented a tutorial on polynomial regression. Three different methods were discussed. The first one is based on Cramer ’s Rule while the second on matrix inversion. The third method is a graphical solution. When fitting data to a polynomial regression model, you may want to remove collinearity from the data, or at least minimize it, to avoid unusually high or spurious correlations. This can be done using orthogonal polynomial regression (Shacham & Brauner, 1997). Also, never arbitrarily fit your data to a regression model. For instance, applying the third method to the NIST data used in this tutorial returns correlation values close to 1 for different values of k. Which model is then the correct one? One way of addressing this consists in constructing a scatter plot of the residuals. The plot should be free from any pattern or trend (see https://www.itl.nist.gov/div898/handbook/pmd/section6/pmd616.htm and https://www.itl.nist.gov/div898/handbook/pmd/section6/pmd618.htm). For instance, if a paired data set is best described by quadratic regression, but one fits it to a simple linear regression model, more likely the resultant residual scatter plot will not be pattern- free, but should reveal a curvature. The bottom line is this: Never use a regression model or trust a correlation coefficient without analyzing its residual scatter plot. Also, never use a regression model that contradicts theory or experience. Why use quadratic regression if theory or experience says the calibration curve should be linear? Why use cubic regression if the theory or experience says the curve should be quadratic? (Frisbie, Mitchell, Sikora, Abualrub, & Abosalem, 2015). After publishing this tutorial, we decided to develop a tool that lets users fit a paired data set to a k-degree polynomial. Currently being tested, the tool automatically returns all the matrices utilized in the linear algebra analysis, and lets users apply other models (exponential, power, logarithmic, logit, and hyperbolic). No additional software is needed to run the tool. We hope to upload it in the near future so it will be freely accessible online.
References Frisbie, S. H., Mitchell, E. J., Sikora, K. R., Abualrub, M. S., & Abosalem, Y. (2015). Using Polynomial Regression to Objectively Test the Fit of Calibration Curves in Analytical Chemistry. International Journal of Applied Mathematics and Theoretical Physics. Vol. 1, No. 2, 2015, pp. 14-18. doi: 10.11648/j.ijamtp.20150102.11. Retrieved from http://www.betterlifelabs.org/10.11648.j.ijamtp.20150102.11.pdf
7
Shacham, M. & Brauner, N. (1997). Minimizing the Effects of Collinearity in Polynomial Regression. Ind. Eng. Chem. Res., 36 (10), pp 4405–4412. Retrieved from https://www.researchgate.net/publication/228911610_Minimizing_the_Effects_of_Collinearity_i n_Polynomial_Regression
Weisstein, E. W. (2018). Least Squares Fitting--Polynomial. MathWorld--A Wolfram Web Resource. Retrieved from http://mathworld.wolfram.com/LeastSquaresFittingPolynomial.html