A Unified Sequence-Structure Classification of Protein Sequences: Combining .... quence, classification of protein structures based on struc- ..... Cluslcr Ilo 42.
A Unified Sequence-Structure Classification of Protein Sequences: Combining Sequence and Structure in a Map of the Protein Space. G o l a n Yona* a n d Michael L e v i t t Department of Structural Bmlogy. Fairchild Bid D-109, Stanford Umverslty CA 94305, USA * Corresponding author, email:golan~gimmel.stanford.edu
Abstract We analyze all known protein sequences in search for a global map of protein space that is consistent in terms of both sequence and structure. Our goal is to define clusters of homologous protein domains, beyond those detected by sequence-based methods alone, and then to bmld a three-dimensional (3D) model for each of the sequences that are homologous to sequences of known 3D structure. This analysis uses both sequence and structure based metrics in the analysis of all protein sequences in a non-redundant (NR) database, comprising all major sequence databases. The analysis starts from the sequences of the SCOP database domains, which have known three-dimensional structures These sequences are clustered first into families based on sequence similarity alone, without incorporating any information from the SCOP classification. Each sequence-based family is represented by a profile, and th~s profile is used to search the NR database, using PSI-BLAST. Since PSI-BLAST can lead to false similarities, several different indices of validity are used to control the procedure Each of the detected sequences is marked and a profile is built for the whole cluster of similar sequences. A 3D model is then built for each sequence in the cluster using an alignment made using the profile as well as the known structures of the SCOP representatives in the cluster Clusters based on SCOP domains are called type-I clusters In all we find 1421 type-I clusters with total of 168,431 sequences (44.5% of our NR database) After all members of type-I clusters have been marked, we analyze the remaining sequences. The PSI-BLAST procedure is applied repeatedly, each time with a different query, to search what is left over from the previous ?emllssmn to make digital or hard cop~esof all or part of this work for personal or claasroomuse is granted without tee provided that cop~es are not made or d~stnbuted for profit ol comme~cmlad,,antage and that cop~esbear tins notice and the lull citation on the first page To copy otherwise, to repubh~h, to post on serversor to rechstr~bute to hsts. requues prior specd~cpcrm~ssmnand/or a tee RECOMB 2000 Tokyo Japan USA CopyrightACM 2000 1-58113-186-0/00/04. $5 00
308
run. This give type-II clusters, which may overlap. Type-I and type-II clusters are then grouped using higher level measures of similarity. Those pairs of clusters that contain the same common protein (significant overlap in membership), are marked first. The pairs of clusters are then compared using either a structure metric (when 3D structures are known) or a novel sequence profile metric, and clustered into superfamilies and "fold" families. This analysis avoids the limitation of classifications that are based just on sequence comparison, and allows us to construct a 3D model for a substantial portion of the sequences in the NR database.
1
Introduction
Smce the early days of genomic research molecular b~ologists have tried to make sense out of the accumulated information on protein sequences and structures by classifying proteins into families. The terms "family", "superfamily" and "fold" family were used during the 70's [Dayhoff 1976, Levitt & Chothia 1976], and preliminary tools were developed for the analysis of protein sequences and structures and identification of biological relatedness. During the past two decades there were many attempts to classify proteins based on either sequence analysis or structure analysis. However, the essential difference between the representation of a protein as a sequence of amino acids, and its representation as a 3D structure, dictates different methodologles, different similarity/distance measures and different comparison algorithms. Consequently, sequence based techniques were traditionally applied to a space (or subspace) of protein s e q u e n c e s , while structure based analyses were applied only to the space of known structures. As sequence analysis techniques ~mproved and became more sophisticated: better models were created for protein famlhes and domains (e.g. profiles, Hidden Markov Models), allowing subtle relationships to be det¢cted. Several large-scale analyses were carried
out, most of which focused on finding common motifs, domains and patterns of biological significance in protein sequences. This lead to the compilation of useful databases, which can be used to search for s~gnlficant pa.tterns m new sequences. Among these are P R O S I T E [Hofmann et al. 1999], Blocks [Henikoff et al. 1999], P R I N T S [Attwood et al. 1999], ProDom [Corpet et al. 1999], Pfam [Bateman et al. 1999], and Domo [Gracy & Argos 1998]. Other studies were applied to complete p~oteins. Most draw directly on pa~rwise comparison - and cluster the input database using single lmkage clustenng [Gonnet et al. 1992, Harris et al. 92, Watanabe & Otsuka 1995, Koonin et al. 1996, Barker et al. 1996, Tatusov et al. 1997, Krause & Vmgron 1998, Yona et al. 1999] P r o t o M a p [Yona et al. 1999] apply somewhat mo~e elaborate considerations. However, in many cases sequences have diverged to such an extent that t h o r common origin is untraceable by all these methods. Structure based analysis was focused on the classification of protein structures. The proteins of known 3D stIucture were first g~ouped into families based on sequence similarity, and then into structural classes and folds based on overall similar shape and architecture. Examples of such structure based classifications are SCOP [Hubbard et al 1999], CATH {Orengo et al. 1997] and FSSP [Holm & Sander 1997a]. Since structure comparison algorithms are mostly heuristic, and are usually very computat~onally intensive, expert knowledge was usually required to obtain reliable classifications. Because structure is often conserved more than sequence, classification of protein structures based on structural similaritms is extremely important. For example, structural relationships help understand function, allowing more accurate predictions of functional roles. However, for most known proteins only the sequence is available (currently, only several thousand structures have been determined, while the number of known sequences is over 300,000). Given the difficulty of determining the 3D structure of a protein, sequence based studies play a major role in genome analysis Several sequence-structure studies were carned out m the last few years. Some of these studied the correspondence of sequence-based classifications and structurebased classffications (e g. [Elofsson & Sonnhammer 1999]), whde others tried to associate structural properties with sequence patterns [Hail & Baker 1996, Rigoutsos et al. 1999] However, to the best of our knowledge, none of these studies tried to combine both structure-based metrics and sequence-based metrics to map the protein space In this paper we address the problem of bridging the gap between the sequence space and the structure space Our study a t t e m p t s to establish a consistent, reliable and unified framework for sequence and structure
309
analysis Our goal is to m a p the protein space through a scheme t h a t combines sequence ba~ed metrics with structure-based metrics and considers domains as well as entlr~ proteins. Our analysis starts from a manual classification of protein structures which is considered to be a state-ofthe-art in structure classification, namely, the SCOP database The domains in this database provide a natural definition of the basic building blocks of protein structures. Each of which is a well-defined part of a protein structure which can be assigned a structural or a functional role. However, our main use of this database Is not the classification it provides, but the actual definition of these structural units. The sequences of these domains were clustered based on their sequence similarity independent of the SCOP classification. These clusters were then used to identify as m a n y as possible homologs in the N R database. Once these structurebased clusters are defined, the yet unanalyzed areas of the protein space are subjected to sequence analysis. This analysis provides sequence-based clusters much in the same way as the structure-based clusters The act quired information about the sequence similarity between and within clusters of both types, as well as their structural similarity enabled us to develop a framework for unification of these two metrics
2
Methods
Our computational procedure starts by defining clusters of homologous sequences within the S C O P database. These clusters are then used as seed clusters in search for homologs in the space of all known sequences. The related sequences are marked and the clusters are extended accordingly. At the second stage we analyze the sequences which are not covered by these clusters, and cluster them as well. In what follows we describe this procedure in detail
2.1
Databases
The SCOP database, release 1.39, serves as the starting point for our analysis. This release contains 15,198 sequences which are classified into 7 classes, 440 folds, 640 superfamihes, 938 families and 2716 protein domains. This defines the space of protein structures. Our protein sequence space consists of all known protein" sequences. We form this non-redundant (NR) database by combining all m a j o r databases of protein sequences. Specifically, we include the S W I S S P R O T database release 37 and updates until June 10, 1999 (79,626 entries), the T r E M B L database release 9 minus d a t a integrated into S W I S S P R O T as of June 10 1999 (200,821 entries), the new preliminary TrEMBL database entries created since release 9 of TrEMBL until June 10, 1999 (42,840 entries), the P I R database
(parts 1,2.3,4) release 60.00, March 31, 1999 (108,716 entries), the GenPept database release 111, April 5, 1999 (387,685 entries) plus new entries added to GenPept until June 15, 1999 (33,485 entries), the SCOP database release 1.39 (15,198 entries), all PDB entries until April 15, 1999 (16,293 entries), the NRL_3D database release March 31, 1999 (14,791 entries), and the complete genomes of yeast, C. elegans, and 20 bacteria (A. fulgldus, A. aeolicus, B. burgdorferi, B. subtihs, C. trachomatis, C. pneumouiae, E. coli, H. influenzae, H. pyloft, M. gemtalium, M. jannaschii, M. pneumoniaem, M. thermoautotrophicum', M. tuberculosis, P. horlkoshfi, Rhizobium sp. NGR234, R prowazekii, Synechocystls PCC6803, T. palhdum and T. mantima). Our non-redundant database was created out of all these databases by removing exact duplicates and all entries shorter than 20 amino acids. This database contains a total of 378,407 sequences and 119,881,584 amino acids. It should be noted that due to mutations, errors and different sequence reports the same protein may be stored as a different sequence entry in the source databases, and consequently, will appear as multiple entries in our composite database 1. However, as will be shown below, this residual redundancy will not affect our results. 2.2
Seed clusters - the SCOP database
We begin by eliminating all redundant entries in the SCOP database and discarding all artificial sequences (sequences that are concatenation of discontinuous subsequences). The 6195 remaining sequences are compared pairwise in an all-against-all manner, using GappedBLAST [Altschul et al. 1997] with the BLOSUM 62 scoring matrix [Henikoff & Henikoff 1992]. Based on these similarities, the sequences are clustered using the ProtoMap clustering algorithm [Yona et al 1999]. This algorithm uses a graph representation of the sequence space and a hierarchical two-phase clustering algorithm to automatically cluster the protein sequences Global properties of the graph are taken into account, and the clustering process is closely monitored to prevent the transitive chaining that is observed for multi-domain proteins, as well as to eliminate false clusters due to chance similarities. The algorithm starts from a very conservative classification, based on transitive closure of highly significant similarities (expectation value below le -l°°, as measured by BLAST). Subsequently, these clusters are merged to form bigger and more diverse clusters. The procedure operates hierarchically: at each step it adds
new, weaker connections to the previously considered connections At each round of this process statistical information is gained on the connections between current clusters and used to derive the distribution of pairwine similarities between each pair of clusters. This information is then used to merge only certain clusters (given that their connection is statistically significant), thus forming the next round of larger, coarser clusters: For more details on the algorithm see [Yona et al 1999, Yona 1999]. We stop the clustering process when the BLAST evalue exceeds le -5. This gives 1421 clusters, 762 of which contain at least 2 sequences. The 10 largest clusters are given in table 1. Comparison with SCOP shows that almost all clusters correspond to SCOP families. 18 clusters contain members from different families within the same superfamily. Only 2 clusters contain members from different classes. In both cases there is significant sequence similarity suggesting a biological relatedness. For .each cluster with more than one sequence we select a seed sequence. This is the sequence whose average distance from all other members in the cluster is the minimal (or equivalently, similarity is maximal). The seed sequence is then searched against all the other sequences in its own cluster using PSI-BLAST [Altschul et al. 1997] This is an lterative version of BLAST, with a position-specific scormg matrix that is generated from significant alignments found in round i and used in round z + 1. This algorithm is able to detect weak similarities that are missed in database searches with pairwise sequence searches. At this stage, the use of PSI-BLAST is intended to create a profile which represents all sequences of known structure in the cluster. The full power of PSI-BLAST is exploited in the next stage. Cluster number
Size
Family Immunoglobuhn (variable domain) Phage T4 lysozyme Immunoglobuhn (constant domain) Giobm Trypsm(ogen), Thrombm
1
288
2
238
3 4 5 6 7 8 9 10
181 113 113 105 82 60 50 43
Table" 1: Largest
2,3
Lysozyme Calmoduhn, "Froponm C, Parvalbumm Carbomc anhydrase Concanavahn A, Lectm Mitochondr~al cytochrome c, Cytochrome c2 SCOP
clusters at confidence
] e v e ] 10 - 5
Forming the extended clusters
Each of the 1421 seed clusters of SCOP that we found in the previous stage is compared with all the sequences in our NR database. We use PSI-BLAST to search the database. This choice was made based on evaluations
l T h e T r E M B L -/- S W I S S P R O T d a t a b a s e s a l r e a d y a c c o u n t for all s e q u e n c e entries m all m a j o r d a t a b a s e s , a f t e r e h m m a t m g r e d u n d a n c y a n d false e n t r m s a n d t h e u m f i c a t l o n of s e q u e n c e v a r i a t i o n s (see release notes of t h e s e d a t a b a s e s ) I n t h e p r e s e n t s t u d y we included t h e s e v a r i a t i o n s as different entries, since p a r s i n g t h e s e v a r i a t i o n s f r o m t h e S W I S S P R O T + T r E M B L entrees as c u m b e r s o m e
310
which proved that this tool is more sensitive in searching for remote homologs [Park et al. 1998]. For all seed clusters with at least 2 members the search starts with the profile that was generated from all the sequences m the cluster. Otherwise, the search starts with a single sequence The iterative PSI-BLAST process is repeated until it converges, or until the predefined maximum number of 10 iterations is reached Out of the 1421 clusters, only 64 did not converge. 46 of these did not converge . because of noise and divergence, and were "corrected" (see next section) The other 18 did not converge because of fluctuations (15 cases), or high initial threshold (3 cases) and were "approved".
2.3.1
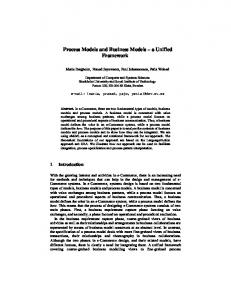
may have become more generMized to account for related sequences. If the seed sequence is not a "typical" sequence, then this may result in better score for other, "typical", sequences. We still want the seed sequence to be one of the most significant hits. Therefore, if at some point the seed sequence becomes less significant, we stop the iterative process. Specifically, we require that the seed sequence be one of the 10 most significant hits (where multiple hits with the same score count as one), and stop the process otherwise. Out of 1421 clusters, 135 scored the seed sequence below the first 10 hits at some iteration. Based on manual examination of these clusters, we observe in 105 clusters what we call "shift to center of family", meaning, the profile has diverged from the query sequence and its corresponding subfamily to better represent a family that includes this subfamily. The other 30 cases are due to low complexity sequences and coiled coil segments In all cases where the profile has diverged, we run the procedure again, ~topping the Iterations before divergence occurs (see Fig 1).
Controlling the PSI-BLAST searches
Although PSI-BLAST is a powerful tool, it can lead to false positives by diverging from the original query sequence, and in doing so, create a profile that represents unrelated sequences. To avoid this problem, we used a high significance threshold as well as several indices of validity First we set the threshold at le - l ° (PSI-BLAST evalue). Only hits that scored above this threshold were Included in the profile. When a similar analysis was performed with a threshold of le -5, it resulted in 263 clusters that did not converge after 10 iterations (as opposed to 64 with the le -1° threshold). It should be noted that although we set a high significance threshold for inclusion in a profile, many weak but genuine sequence similarities pass the threshold after a few iterations and are incorporated in the profile. Moreove~, the threshold for reporting significant hits was set at le -2. Thus the results of this procedure are generally as sensitive as simple gapped-blast searches, and in most cases (950 out of 1421) are more sensitive, detectmg many more hits than in a simple BLAST search. Several validity indices, which are based on simple statistics of clusters such as growth rate and self-score, were used to detect suspicious clusters and "correct" them. At this stage most of the analysis involves extensive manual examination of the results This enabled us to extract rules to control the iteratlve process, and in many cases we could use these rules to control the process automatically
2.3.2
CluslcrIlo42 5O 45 oo
40
= 35 o 3(1
~2s -g 2(I
l0
'i I
2
I
a
4
5
6
7
~
9
lO
ttcratmn
Figure 1. T h e r a n k i n d e x . A t t h e f o u r t h I t e r a t i o n of P S I - B L A S T t h e profile of c l u s t e r 42 ( m o s t l y 7 - a l p h a - h y d r o x y s t e r o l d d e h y d r o g e nases) d~verges f r o m t h e q u e r y s e q u e n c e ( H u m a n e s t r o g e n i c 17betah y d r o x y s t e r o l d d e h y d r o g e n a s e ) , to r e p r e s e n t a l a r g e r f a m i l y of reducrases a n d d e h y d r o g e n a s e s C o n s e q u e n t l y , t h e seed s e q u e n c e b e c o m e s less s~gmficant a n d is r a n k e d 14 a t t h e fifth I t e r a t i o n Based on thin g r a p h , P S I - B L A S T IS r e p e a t e d , this t i m e s t o p p i n g a f t e r 3 i t e r a t i o n s
2.3.3
The size index
The rank index helps to detect many cases where the PSI-BLAST process may have led to false hits. We also observe cases in which the cluster keeps growing and yet the query sequence is ranked in the top 10 hits Such growth may happen for example in cases where sequence similarity is due to convergent evolution (such as coiled coil and transmembrane domains). Most of these cases can be easily traced by checking the growth rate and the final size of clusters. Those clusters that were not detected by the rank index test and in the last iteration are more than 4 times bigger than the size of the cluster at the first round are marked. 41 such clusters were detected, 31 of which were declared suspicious These suspicious clusters were rerun, this time only for 2 iteratxons.
The rank index
A,fter each PSI-BLAST iteration, a new profile is generated based on all significant hits. In the next iteration, the database sequences are compared with this new profile, and scored accordingly Since the new profile repIesents all significant hits (above a celtain threshold), it may happen that after few iterations the query sequence is no longer the most significant hit The profile
311
was filtered to exclude low complexity segments, using the SEG program [Wootton & Federhen 1993]. Out of the 142"1 clusters, 695 (49%) are not affected by filtering, and 1211 (85%) clusters have the same size to within 10 members All clusters whose membership increased by more than 100 when the non-filtered database was searched, were manually checked. Out of 46 clusteis, 29 had al-" ready been detected using our validation criteria and corrected. An additional 5 clusters were detected but approved without correction." Another 11 clusters suffered a substantial decrease in true positives as a result of the filtering process. Only in one case (cluster 851 t h a t contains mostly G A G Polyproteins) we observed an excess of hits in the non-filtered database due to similarity with proline rich proteins. Yet, use of the high threshold prevented a collapse, and the process stopped after 2 iterations. The proline rich regions had low signfficance value (greater t h a n l e - S ) . Many biologically meaningful hits are not reported with the filtered database (as observed for the 16 clusters mentioned above), indicating t h a t masked regions contain i m p o r t a n t information which can be missed by straight-forward filtering. Since our pruning criteria revealed most of the problem cases, we chose to define our clusters using the non-filtered N R database.
At the moment both the rank index and the size test use parameters which are defined ad hoc. These choices were made to facilitate the manual examination of suspicious clusters in a reasonable amount of time. However, these tests mitiated a framework for the development of a validated version of P S I - B L A S T
2.3.4
The SCOP classification test
Though it may happen t h a t different sequences share the same fold [Murzin et al. 1993, Pearson 1997, Brenner et al. 1998], it is very uncommon t h a t similar sequences adopt different folds. Therefore, as another vahdation test we checked if sequences with different SCOP classifications were placed in the same cluster. Each cluster has a seed cluster m SCOP, and therefore is assigned a specific fold The seed clusters correspond to either families or superfamilies in the SCOP hierarchy (see section 2.2). Therefore, in each of the "clean, corrected" set of clusters we look for S C O P entries from other superfamilies, folds or classes. Such conflicting entries are detected only in 13 clusters. In 3 clusters the entries belong to different superfamllies within the same fold family In 4 clusters, the entries belong to different fold families within the same class. The remaining 6 clusters indicate s~mllarity between sequences from different classes. However, manual inspection of all 13 cases showed that in 9 cases the similarities are significant and genuine and the clusters were left as generated. In the remaining 4 cases, the questionable similarities had low significance value, and were not used in the profile building process.
2.3.5
2.4
Mapping the second part of the space - the sdquence-based clusters
After all members of type-I clusters were marked, we turn to the remaining sequences. We apply the PSIB L A S T procedure repeatedly; to cover each time what is left over from the previous search. Each time a random query is selected from the set of undetected sequences, a search is performed with t h a t query, and the set of detected s~quences is updated. The resulting clusters m a y overlap as the search is performed against the whole N R database (including members of type-I clusters). The same validation criteria as discussed above are applied to control the P S I - B L A S T process, and the clusters are refined accordingly. The resulting clusters are called type-II clusters.
The low complexity test
It is well known that low-complexity segments m a y drastically affect the results of BLAST search [Altschul et al. 1994]. Statistical estimates of significance of similarity scores in database searches assume t h a t the compositions of the compared sequences are similar to the overall composition of amino acids in the database [Karlin & Altschul 1990]. However, thin is not true for sequences with low-complexity regions, and statistical estimates overestimate the significance of matches to proteins with unusual amino acid composition. This can be avoided by excluding these segments using filtering programs such as SEG [Wootton ~z Federhen 1993]. On the other hand, m a n y relationships of biological significance can be missed if only sequences that pass the filter are to be considered. Setting the threshold for P S I - B L A S T at the evalue of le -1° eliminated most of the similantms that are due to low complexity regions. However, to test our validation procedures, and in order to detect those false clusters which escaped our pruning criteria, we repeated the whole computational process after the NR database
3 3.1
Results General information
Overall, the 1421 type-I clusters contain 168,431 sequences (34,259,323 amino acids) at significance level (evalue) of better t h a n le -2. This is 44.5% of all sequences in the NR database, and 28.5% of the amino acids in our database. 155,690 of the sequences have sequence identity of at least 20% with the seed sequence. 100,261 sequences share 20% identity with the seed sequence, along their whole sequence. The largest 20
312
type-I clusteis are g~ven in Table 2 At the time of writing, 3883 random queries had been used as search seeds for type-II clusters, giving 3249 clusters (there are 634 m singletons). Overall, type-II clusters contain 180,633 sequences and 37,791,626 amino acids. We are still in the process of generating all the type-II clusters, and the complete statistics about type-I and type-II clusters will be available soon on the B i o S p a c e website h t t p . / / b i o s p a c e stanford.edu. Size
No of amino acids
1 1296 891
17,596 15,882 5,514
1,657,530 1,823,563 1,982,581
11 51
4,845 4,123
1,251,316 1,245,273
127
4,026
523,363
146
3,640
386,697
3 13 95 88 177 85 134 453
3,583 2,725 2,658 2,407 2,194 2,037 1,887 1,854
374,549 273,938 610,565 137,968 175.560 307,682 200,024 268,378
542 42
1,780
148,894 319,017
7
1,545 1,514
31 212 116 222 5
I 486 1,460 1,369 1307 1258
218,200 84,843 454917
137 311 135 494
1127 1006 886 616
350390 296557 241207 319474
Cluster number
191,313
260874 275543
Famdy lmmunogtobuhn (varmbie doma,n)
Envelope Glycoprotem Tropomyosm, Myosin, Kmesm (coded cod segments) Protein klnase R~bulose b~sphosphate carboxylase (large chain) domain II R~bulose blsphosphate carboxy}ase (large chain) domain la R~bulose blsphosphate carboxylase (large chain) domain Ib Immunoglobuhn (constant domain) Pol polyprotem, Protease Reverse transcrlptase Homeobox MHC class II MHC class I Gag protein ADP-nbosylatlon factor, Ras-hke proteins, GTP-bindmg proteins Gag protein Hydroxysterold dehydrogenase EF band (Calmoduhn, mroponm C, Parvalbumm) Ras-hke proteins Transcription factors Cytochrome P450 Myosin light chain, Titm Trypsmogen, Thrombm, Ser,ne protease Hemagglutlmn GTP-bmdmg proteins Flbronectm, Tenascm Peptlde synthetase
Table 2: T o p 2 0 c l u s t e r s . The (prehmmary) fam,ly descr,pt,on states the feature common to most or many of the member proteins Add4tmnal clusters, whJch are among the 20 largest m terms of the number of amino nods, are given below the horizontal hne
3.2
Modeling
Since each of the type-I 1421 clusters is associated with a seed sequence that has a known 3D structure, we can build a 3D model for all other sequences in the cluster based on the similarity wi}~h the seed sequence. Using our alignments we created an all-atom 3D model for each of the 168,431 sequences (34,259,323 amino acids), u~ing SegMod [Levitt 1992] and Encad [Levitt et al 1995] The alignments as well as the models are available on the web, at the BmSpace website
3.3
Overlappingclusters
Since the P r o t o M a p clustering algorithm only merges clusters when the statist,cal evidence for a relaUonship
313
between the m e m b e r proteins is strong, it m a y happen that some of our seed type-I clusters (that contain only SCOP sequences) are related through weak but genuine sequence similarity. Consequently it m a y happen that the final extended (type-I) clusters of two seed clusters whmh share weak sequence similarity, will include the same sequence as a member. Out of all 1,008,910 type-I cluster pairs, 3559 pairs (0.35%) have at least one protein in common. However, out of these 3559 pairs, 2384 are totally disjoint at the level of the armno acid: the same protein may be classified into 2 different clusters, but each cluster includes a different p a r t (domain) of the protein. One such example is clusters 51 and 127 (see Table 2) which share 3958 proteins but zero amino acids Out of the remaining 1175 pairs (0 11% of all cluster pairs), in only 246 cases are more than 50% of the amino acids included in both clusters. In no case were the clusters totally overlapping. Moreover, though a protein domain m a y be classified to more than one cluster," the quality of the alignment m a y vary. Since a m a j o r goal of our analysis was to build reliable models for as many as possible sequences in the protein space, we left the clusters untouched. All 1175 pairs of clusters are marked as "related clusters" for further analyms. Overlapping is also observed for type-II clusters. Out of all 7,536,903 t y p e - I I cluster pairs, 17,508 pairs (0.23%) have at least one protein in common but only 11,426 share ope amino acid or more. 501 cluster pairs were more than 50% overlapped, and of these, 18 cluster pairs were identical. This overlapping reflects the fact that a P S I - B L A S T run with a random representative of a protein family m a y not detect all family members, and several runs with several different queries may be needed to cover all family members A wise selection of the seed sequence can minimize the number of such querms and limit the redundancy (for example, by picking the-"center" sequence, as was done for type-I clusters). Databases such as P f a m and P r o t o M a p which provide pre-defined groups of related sequences can help to reveal these center sequences, and we plan to use of these databases in the future. Among all possible pairs of type-I type-II clusters (5,517,743), 10,043 cluster pairs share at least one sequence. Surprisingly, 3822 of them share more than one amino acid. While most of these pmrs were disjoint, fSr 297 pairs more than 50% of the a m m o acids were overlapped. In no case the clusters were totally identical, but several type-I clusters were completely or almost completely contained within type-II clusters. Again, this indicates that P S I - B L A S T searches should be treated with care, and more t h a n one run m a y be required to insure that all possible sequences that could have been detected with P S I - B L A S T were indeed detected.
4
Combiningsequence-based metric with structurebased metric
Sequence based metrics have limited success when it comes to detecting weak similarities between sequences that have diverged greatly. Moreover, m m a n y cases proteins may have the same fold and close biological functmn, though significant sequence similarity is not observed [Murzin 1993, Pearson 1997, Brenner et al 1998]. Therefore, using structural information where available to deduce relationship between proteins can greatly increase the accuracy of predictions and functional analysis Incorporating such information in our map can help to detect higher level regularities within the protein space. Structural information is currently available for only a small fraction of the protein space. Therefore, to achieve m a x i m u m sensitivity and benefit from both structures and sequences, we need to combine these two metrics. However, since these measures are based on different considerations it is not clear how one should judge scores that are assigned by either metric. The same problem exists, for example, when one wants to give the distance between two cities either in land travel distance or in air travel distance. Without knowing the relation between the two metrics it is hard to develop a notion of "close" and "far" which is consistent with both metrics. Moreover, it is not clear how statistical measures that are based on different protein features can be combined and transformed to a single scale. Fortunately, the statistical esUmates that we use are based on the same statistical framework as will be clarified below, and, with proper normalization by search space size, are correlated fairly well. To correct biases and shifts, which are due to different random background distmbutions, one can use the similarities observed t h a t are mgmficant both in sequence and structure to calibrate the scores.
ter than le -3. Note that this number of pairs (2695) is more than 2.5 times bigger t h a n the number of overlapping clusters (1175). Moreover, only 407 pairs of the 1175 overlapping pairs are detected as structurally similar. An additional 6341 pmrs were found with structural similarity evalue better than l e - 2 ; only 155 of these are overlapping clusters. Hence, overlap does not entail structural similarity and the contrary does no~ hold either. I e., most structural similarities cannot be explained as a result of overlap. The structural alignments used here will be made.available on the BioSpace website (and their detailed analysis will appear elsewhere).
4.2
Comparing profiles
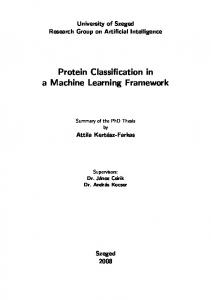
Our ultimate goal is to m a p the whole protein space. Currently, our protein space consists of 1421 type-I clusters and 3883 t y p e - I I clusters. It is reasonable to assume t h a t some of type-II clusters are related to the structure-based type-I clusters, since very weak sequence similarities might have been missed by PSI-BLAST. If we had a 3D structure for a representative sequence m type-II clusters, this relationship could have been detected However, m the absence of structural information for these clusters we must rely on sequence informaUon. Although we already used the most powerful tools available for database searches, we have not yet used the profiles obtained for our clusters. These profiles can provide a new, potentially powerful measure of similarity between clusters. Moreover, by comparing profiles, and using the same statistical framework as for structural similarities to assess their significance, we are able to obtmn a complete protein m a p t h a t is consistent in t e r m of b o t h structure and sequence comparison. A detailed description of our novel procedure for profile comparison is given in appendix A. Dlslnbmton of profile '~um|anty t;corc~
4.1
01)25
Structural comparisons
Sllnllanty st.orcs - -
cxtrcme vaiuc approxlmallon ......... 002
Our procedure starts by calculating structural similarities between all seed proteins of SCOP clusters. These matches were calculated using s t r u c t a l [Gerstein & Levitt 1998, Levitt & Gerstein 1998]. This program uses iterative dynamic programming to find the optimal global alignment. A similarity matrix S~ is created at each round based on the inter-atomm distances between each atom ~ in the first structure and each atom j in the second structure An important advantage of this program is that it gives statisUcal estimates similar to the statistical estimates of BLAST, i.e., the output gives the probability that the observed structural similarity could have been obtain by chance. Out of the 1,008,910 type-I cluster pairs, 2695 pairs share significant structural similarity w,th evalue bet-
0015 o ol 0 (X)5
511
10(1
1511
2('10
25(1
score
Figure 2:
Distribution
of
profile
similarity
scores
In Fig. 2 we show the distribution of profile similarity scores for pairs of unrelated type-I clusters. Pairs of clusters in this subset are selected following three criteria: (1) they do not overlap, (2) they do not share significant structural similarity and (3) they belong to differ314
ent SCOP classes. Effectively, this distribution reflects the d~strlbut~on of simflarxty scores of "random" profiles An extreme-value distribution [Gumbel 1958] was fitted to thin d~stribution, so as to estimate the statmtmal significance (e-value) for each raw similarity score. Note that the theoretical fit deviates from the empirical dxstribution for low slmflarxty scores Matches along secondary structure elements can explain this, and we a~e currently testing this hypothesis. This deviatmn does not affect our probability calculaUons as it ~s confined to the region of the plot where score are not slgmficant To evaluate the sens~tiwty and selectivity of our new approach for profile-profile comparison we are currently testing ~t on profiles of type-I clusters that are associated with the same SCOP family, superfamily, fold or class 4.3
The unified map - detection of super-clusters
The pairw~se cluster similarity scores (based either on the structural slmflaritms or the profile similarities) are used to cluster the clusters to superfamihes and "fold" families, using the P r o t o M a p clustering algorithm that 1s described m section 2.2. Based on our preliminary data, the 5,304 clusters form 3,790 superclusters of which 333 contain more than one cluster. Many relations are observed between superclusters but are currently rejected by the P r o t o M a p clustering algorithm because of insufficmnt statistical evidence for a relationship. Free tuning of the algorithm may lead to further aggregation of clusters, but these relationships already provide us with local maps of the protein space (as described in [Yona et al. 1999]) Apphcation of a multidlmensmnal scahng procedure currently underway 1s expected to lead to the first global map of the protein space that combines both sequence and structure. SCOP sequences (or type-I clusters) are scattered among 584 superclusters. This number lies between the number of folds (440) and the number of superfamilies (640) in the SCOP database. Only 15 superclusters contam SCOP entries from different classes. These cases will be studied carefully, and oui parameters and algorithms will be refined accordingly. Within superclusters that contain at least one ty'pe-I cluster we find 677 typeII clusters. Hence we believe that this m a p can extend predictions of structural and functional sunilantms bey'ond that obtainable with exmtmg methods. 5
Discussion
One of the most important problems in genomic is the clustering of related proteins in the protein space. Usually p~oteins are grouped based on either sequence slm315
ilarity or structure similarity (when structural information is available). Here we have trmd to combine both measures of similarity in order to build a m a p of the protein space t h a t is consistent with both sequence similarity and structure similarity. So far we have clustered the protein space into typeI clusters (clusters with structural representatives) and type-II clusters (clusters with no structural representative) Higher level measures of similarity were used to group these clusters into superclusters. Specifically, we made use of efficient and sensitive structural comparison algorithm, and developed a novel method for profile-profile comparison. Taken together, these tools enable us to establish a consistent and unified framework for sequence and structure analysis. By combining sequence information and structure information (when available) it is believed t h a t a better, more accurate m a p can be created. The work described here is the first stage in a multistage ar~alysls t h a t aims to organize the protein space into domains as well as into protein families, to create a umform framework for sequence and structure analysis, and to build a 3D model for a substantial part of the protein space. 6
Acknowledgments
We thank Steven Brenner for help and advice regardmg the" SCOP database. Golan Yona is supported by a Burroughs-Welcome Fellowship from the P r o g r a m in Mathematics and Molecular Biology (PMMB). This work was supported by D O E award DE-FG03-95ER62135 to Michael Levitt Appendix A - Profile comparison
The profile comparison is performed using the classic dynamic programming algorithm, and the alignment is assigned a score t h a t accounts for matches, insertions and deletions. Unlike sequence-sequence comparison, where a match means identity, a profile-profile comparison is more subtle. The core of our new procedure is the definition of profile similarity scores, and the parameters used to quantify this measure of similarity. This was done to obtain maximal sensitivity, as well as to be comparable with standard scoring schemes of sequencesequence comparison as will be clarified below. Given two profiles P = PlP2Pa.--Pn and Q = q l q 2 q 3 • q~,, where n and m are the lengths of the profiles (the number of positions or columns) and Pi, qj are probability distributions over the 20 letter alphabet of amino acids, the score of a "match" between two columns Pl and qj is based on their statistical similarity. A possible measure of statistical similarity between two (eniplrical) probability distributions Pl (x) and qj (x),
is the Kullback-Leibler (KL) divergence [Kullback 1959] wtuch is defined as
Score(p,q) DgL[pillqj]
=
:1(1 - D)(1 + S)
=
1(1 _ DgS[p[lq])(1 + 2
= ~"~ p,k log2 -k
q~k
This measure has a few disadvantages, being asymmet11c and unbounded. A better measure of statistical similarity is the Jensen-Shannon (JS) divergence between probability distributions [Lin 1991]. This measure is also known as "divergence to the mean" Given two (empirical) probabihty distributions p and q, for every 0 < A < 1, their A-JS divergence is defined
Thus, the score for two similar distributions (i.e. D -DJS[pllq ] -+ 0) whose common source is far from th4 background distribution (i.e. S = DgS[rllPo] ~ 1), approaches 1, while the score for two dissimilar distributions whose most likely cofnmon distribution resembles the background dmtribution approaches zero This scoring scheme also distmguishes two distributions that resemble the background distribution from two distributions t h a t are far apart, but whose common source resembles the background dmtrlbution (assigning a higher score in the first case) For local alignments, a general scoring scheme Score(a, b) should satisfy two requirements: (i) E( Score(a, b) ) < 0 and (~i) s* = max{s(a,b)} > 0 The first requirement implies that the average score of a r a n d o m match will be negative (otherwise, an extension of a r a n d o m match would tend to increase its score, and this contradicts the idea of local similarity). The second condition implies t h a t a m a t c h with a positive score is possible (otherwise a m a t c h would always consist of a single pair of residues). It is necessary that the profile similarity scores be adjusted so as to meet these requirements. A simple transformation would be to subtract a constant from all similarity scores. We applied a more elaborated transformation. The distribution of similarity scores for 1,000,000 profile distributions was derived, together with the distribution of similarity scores in the BLOSUM62 matrix. The distribution of profile similarity scores is then m a p p e d onto the distribution of BLOSUM62" matrix so as to preserve the "mass" along the BLOSUM62 distribution. There are clear advantages of applying this kind of transformation It allows us to use the same gap penalties that were obtained from exhaustive optimization of parameters for sequence comparison [Henikoff & Henikoff 1993, Pearson 1995] Moreover, it allows the augmentation of sequence-sequence comparison with profile-profile comparison and profilesequenCe comparison on the same sequence, at the same time. This is useful, for example, when profiles are available only for p a r t of the sequence. A detailed description of the profile comparison procedure and the transformation procedure will be described elsewhere.
as
D~S[pl[q] = ADKL[plIr] + (1 --
DJS[rllPo])
A)DKL[qlIr ]
wheIe r= Ap+(1-A)q
can be conmdered as the most likely common source of both p and q, with A as a prior Without apriori information, a natural choice is A = 1/2. We denote the corresponding measure by D ds. This measure is symmetric and ranges between 0 and 1, where the score for identmal distributions is 0. It is proportional to the minus logarathm of the probability that the two empirical distributions represent samples from the same ("common") source [E1-Yanlv et al. 1997]. While a statistical measure estimating the probabihty that two distributions represent the same source d:stnbution seems appropriate for the comparison of profiles, a m a j o r ingredient is ignored, the apriori probability of the source distribution This information can help to assess the significance of a "match". Say t h a t the two given empirical distributions resembles the overall distribut:on of amino acids in the database (i.e the distribution of the common source is similar to the backglound &stribution) Should they be conmdered mgnfflcantly s~m:lar in that case? Obviously not, as the distribution of the common source is observed for random profiles Therefore this "match" is not as mgnificant as a "match" of two probabihty distributions which both resembles a unique distribution (i.e. a d l s t n b u t m n which is d~stinct from the overall distribution of amino acids in the database). In other words, the similarity of two random distributions is not as significant as the similarity of two unique distributions. To assess the mgnificance S of a match D we measure the JS divergence of the (common) source from the base (background) distribution Po (defined as the amino acid distribution m our NR database). This score refleets the probability that this distribution could have been obtained by chance. Then, the score of a match between p and q is defined as
References [Altschul et al 1994] Altschul, S F , Boguskl, M S , Glsh, W G & W o o t t o n , J C (1994) Issues m s e a r c h i n g m o l e c u l a r s e q u e n c e d a t a b a s e s N a t u r e G e n e t i c s 6, 119-129 [Altschul et al 1997] Altschul, S F , M a d d e n , T L , Schaffer, A A , Z h a n g , J , Z h a n g , Z , Miller, W & L l p m a n , D J (1997) G a p p e d B L A S T a n d P S I - B L A S T a n e w g e n e r a t i o n of p r o t e i n d a t a b a s e search p r o g r a m s N u c l A c z d s R e s 25, 3389-3402
316
[Attwood et al 1999] A t t w o o d , T K , Flower, D R , Lewis, A P , Mabey, J E , Morgan, S R , Scordls, P , Selley, J gz Wmght, W (1999) P R I N T S p r e p a r e s for the new m d l e n n l n m N u c l Aczds Re~ 27", 220-225
[Koonm et al 1996] Koonin, E. V., T a t u s o v , R L & R u d d , K E (1996). P r o t e i n s e q u e n c e c o m p a r i s o n a t g e n o m e scale M e t h o d s E n z y m o l 266, 295-321. [Krause 8z V m g r o n 1998] Krause, A. 8~ Vingron, M (1998) A sett h e o r e t i c a p p r o a c h to d a t a b a s e s e a r c h i n g a n d c l u s t e r i n g Bzo~nf o r m a t z c s 14:5, 430-438.
[Barker et al 1996] Barker, W C , Pfelffer, F ¢~ George, D G (1996) S u p e r f a l n l l y classificatmn m P I R - l n t e r n a t l o n a l protein sequeuce d a t a b a s e M e t h o d s E n z y m o l 266, 59-71
[Kullback 1959] K u l l b a c k , S (1959). " I n f o r m a t i o n t h e o r y and statmtics" J o h n W i l e y a n d Sons, New York
[Batelnan et al 1999] B a t e m a n , A , Blrney, E , D u r b m , R , Eddy, S R , Finn R D , &: Sonnhalnrner E L (1999) P f a m 3 1 1313 m u l t i p l e a h g n m e n t s and profile HMMs m a t c h the m a j o r i t y of proteins N u c l Ac*ds R e s 27, 260-262
[Levitt 1992] L e v i t t , M (1992) A c c u r a t e m o d e l h n g of protein conf o r m a t i o n by a u t o m a t i c s e g m e n t m a t c h i n g J M o l Bzol 226, 507-533
[Brenner et al 1998] Brenner, S E , C h o t h l a , C & H u b b a r d , T J P (1998) Assessing sequence c o m p a r i s o n m e t h o d s w i t h reliable s t r u c t u r a l l y identified d i s t a n t e v o l u t i o n a r y r e l a t i o n s h i p s Proc Natl A c a d Scz U S A 95, 6073-6078
[Levitt &: C h o t h i a 1976] L e v i t t , M K: C h o t h l a , C (1976) S t r u c t u r a l P a t t e r n s In G l o b u l a r P r o t e i n s . N a t u r e 2 6 1 , 552-558 [Levitt gz G e r s t e m 1998] L e v i t t , M ~ G e r s t e m , M (1998) A Unified S t a t i s t i c a l F r a m e w o r k for Sequence C o m p a m s o n and S t r u c t u r e C o m p a r i s o n P r o e . N a t l . A c a d . Scz U S A 95, 5913-5920
[Corpet et al 1999] C o r p e t , F , Gouzy, J , 8c K a h n , D (1999) Recent maprovements of the P r o D o m d a t a b a s e of p r o t e i n d o m a i n famdms N u c l A c i d s R e s 27, 263-267
[Levitt et al 1995] L e v i t t , M., Hirshberg, M , Sharon, R & D a g g e t t , V (1995) P o t e n t i a l e n e r g y f u n c t i o n a n d p a r a m e t e r s for simulations of the m o l e c u l a r d y n a m i c s of p r o t e i n s a n d nucleic acids ul solution Comp Phys. Comm. 91,215-231
[Dayhoff 1976] Dayhoff, M O (1976) T h e origin and evolution of protein s u p e r f a m d i e s Fed Proc 35, 2132-2138 [Elofsson & S o n n h a m I n e r 1999] Elofsson, A gc S o n n h a m m e r , E L (1999) A comparmon of sequence and s t r u c t u r e p r o t e i n d o m a i n fainihes as a basis for s t r u c t u r a l genomlcs B z o z n f o r m a t z c s 15:6, 480-500 [EI-Yanlv et al 1997] EI-Yaniv, R , Fine, S &: Tlshby, N (1997) AgIiOStlC classification of m a r k o v l a n sequences A d v a n c e s ~n N e u r a l I n f o r m a t i o n Processzng S y s t e m s 10, 465-471
[Lin 1991] Lm, J (1991) Divergence m e a s u r e s based on the S h a n n o n e n t r o p y I E E E T r a n s Info. T h e o r y 37:1, 145-151 [Murzin 1993] Murzin, A G (1993) O B ( o l i g o n u e l e o t i d e / o l i g o s a c c h a r i d e b m d m g ) - f o l d c o m m o n s t r u c t u r a l and f u n c t i o n a l solution for non-homologous sequences E M B O J. 12:3, 861-867
[Gerstem & L e v i t t 1998] Gersteln, M & Levitt, M (1998) Comprehensive a s s e s s m e n t of a u t o m a t i c s t r u c t u r a l a h g n m e u t a g a i n s t a m a n u a l s t a n d a r d , the S C O P classification of proteins P r o t e t n Sez 7, 445-456
[Orengo et al 1997] Orengo, C. A., Mlchm, A D , Jones, S , Jones, D T , Swmdells, M. B & T h o r n t o n , J M (1997) C A T H - a hierarchac c l a s s i f i c a t m n of p r o t e i n d o m a i n s t r u c t u r e s S t r u c t u r e 5, 1093-1108
[Gonnet et al 1992] Gonnet, G H , Cohen, M A 8z Benner, S A (1992) E x h a u s t i v e m a t c h i n g of the entire p r o t e i n sequence d a t a b a s e S c i e n c e 256, 1443-1445
[Park et al 1998] P a r k , J , K a r p l u s , K , B a r r e t t , C , Hughey, R , Haussler, D , H u b b a r d , T. gz C h o t h l a , C (1998) Sequence comparisons using m u l t i p l e sequences d e t e c t t h r e e t i m e s as m a n y rem o t e h o m o l o g u e s as pairwise m e t h o d s . J M o l B~ol 284, 12011210
[Gracy g~ Argos 1998] Gracy, J & Argos, P (1998) A u t o m a t e d protern sequence d a t a b a s e classification 1 I n t e g r a t i o n of coposltional s i m i l a r i t y search, local s i m i l a r i t y search and m u l t i p l e sequence a l i g n m e n t II D e l i n e a t i o n of d o m a i n b o u n d r i e s from sequence s i m i l a r i t y Bzoznformat*es 14:2, 164-187 [Gumbel 1958] G u m b e l , E J (1958) " S t a t m t l c s C o l m n b I a U m v e r s l t y Press. New York
[Pearson 1995] P e a r s o n , W. R. (1995). C o m p a r i s o n of m e t h o d s for searching p r o t e i n sequence d a t a b a s e s P r o t e z n ~'c~ 4, 1145-1160 [Pearson 1997] P e a r s o n , W R (1997) I d e n t i f y i n g d i s t a n t l y related p r o t e i n sequences C o m p A p p Bzoscz 13:4, 325-332
of e x t r e m e s "
[Han & Baker 1996] Han, K F & Baker, D (1996) Global propertins of the m a p p i n g between local a m i n o acid sequence and local s t r u c t u r e in proteins Proc N a t l A c a d Scz U S A 93, 5814-5818
[Rigoutsos et at 1999] Rigoutsos, I Gao, Y., Floratos, A gz P a r i d a , L (1999) B u d d i n g d l c t i o n a r m s of 1D and 3D motifs by m m m g the u n a h g n e d 1D sequences of 17 archaeal and b a c t e r i a l genomes In the proceedzngs o f I S M B 99, 223-233
[Harris et al 1992] Harris, N L , Hunter, L & States, D.J (1992) Mega-classificatmn Discovering motifs in massive d a t a s t r e a m s In Proe of the lOth n a t i o n a l c o n f on A I , 837-842, A A A I p r e s s / T h e MIT Press, Menlo p a r k / C a m b r i d g e
[ T a t u s o v ~ t al 1997] T a t u s o v , R. L., ]Eugene, V K gz David, J L (1997) A genorrdc p e r s p e c t i v e on protein families Sezence 27"8, 631-637
[Hemkoff & Henlkoff 1992] Hemkoff, S 8c Henikoff, J G (1992) A m i n o acid s u b s t l t u t m n m a t r i c e s from protein blocks P r o c N a t l A c a d Sez U S A 89, 10915-10919
[ W a t a n a b e & O t s u k a 1995] W a t a n a b e , H. & O t s u k a , J (1995) A c o m p r e h e n s i v e r e p r e s e n t a t i o n of e x t e n s i v e s i m i l a r i t y linkage betweenlargenumbersofproteins C o m p A p p Bzoscz 11:2, 159166
[Henlkoff &: Hemkoff 1993] Hemkoff S 8c Henikoff, J G (1993) Performance e v a l u a t i o n of a m i n o acid s u b s t i t u t i o n m a t r i c e s P r o tezns 17, 49-61
[Wootton & Federhen 1993] W o o t t o n , J C & Federhen, S (1993) S t a t i s t i c s of local c o m p l e x i t y in a m i n o acid sequences and sequence d a t a b a s e s . C o m p C h e m . 17, 149-163
[HeInkoff et al 1999] Henikoff, J G , Henikoff, S 8c P m t r o k o v s k i , S (1999) New features of the Blocks D a t a b a s e servers N u c l A c z d s R e s 27,, 226-228
[Yona et al 1999] Yona, G., L m l a l , N ~ L m m l , M (1999) Prot o M a p A u t o m a t i c classlfieataon of p r o t e i n sequences, a hmrarch¥ of protein families, a n d local m a p s of the protein space Protezns, 37, 360-378.
[HofInann et al 1999] Hofmann, K , Bucher, P , F&lquet, L & Bairoch, A (1999) T h e P R O S I T E d a t a b a s e , its s t a t u s in 1999 N u c l A c i d s Res 27,, 215-219
[Yona 1999] Yona, G (1999). " M e t h o d s for global o r g a n i z a t m n of the protein sequence space" P h D Thes~s, T h e Hebrew Umversity, J e r u s a l e m , Israel
1
[Hohn & S a n d e r 1997a] Holm, L & Sander, C (1997) D a h / F S S P classification of t h r e e - d i m e n s m n a l protein folds N u e l A e z d s R e s 25, 231-234 [I~ubbard et al 1999] H u b b a r d , T J , Ailey, B , Brenner, S E , Murzln, A G &: C h o t h i a , C (1999) S C O P a S t r u c t u r a l Classification of P r o t e i n s d a t a b a s e N u c l Aczds R e s 27, 254-256 [Hughey g~ Krogh 1998] Hughey, R ¢~ Krogh, A (1998) " S A M Sequence a h g n m e n t and i n o d e l i n g software s y s t e m " T e c h m c a l R e p o r t UCSC-CRL-96-22, U m v e r s i t y of California, S a n t a Cruz, CA, J u l y 1998 [Karhn gz Altschul 1990] K a r h n , S ~ Altschul, S F (1990) Methods for &ssesslng the s t a t i s t i c a l significance of m o l e c u l a r sequence features by using general scoring schemes Proc N a t l A c a d Scz USA 87", 2264-2268
317