JUNE 2000
FOX-RABINOVITZ ET AL.
1883
A Uniform- and Variable-Resolution Stretched-Grid GCM Dynamical Core with Realistic Orography MICHAEL S. FOX-RABINOVITZ Department of Meteorology/ESSIC, University of Maryland at College Park, College Park, Maryland, and Data Assimilation Office, NASA Goddard Space Flight Center, Greenbelt, Maryland
GEORGIY L. STENCHIKOV Department of Environmental Sciences, Rutgers–The State University of New Jersey, New Brunswick, New Jersey
MAX J. SUAREZ Laboratory for Atmospheres, NASA Goddard Space Flight Center, Greenbelt, Maryland
LAWRENCE L. TAKACS*
AND
RAVI C. GOVINDARAJU*
Data Assimilation Office, NASA Goddard Space Flight Center, Greenbelt, Maryland (Manuscript received 22 February 1999, in final form 23 August 1999) ABSTRACT The impact of introducing a realistic orographic forcing into a uniform- and variable-resolution stretched-grid GCM dynamical core is investigated by performing long-term and medium-range integrations. Comparisons are made between various stretched-grid simulations and a control that consists of a uniform grid integration at high resolution. These comparisons include those where the orography has and has not been filtered to eliminate small-scale noise. Results from the region of interest with highest resolution show that 1) the stretched-grid GCM provides an efficient downscaling over the area of interest, that is, it properly simulates not only largescale but also mesoscale features; and 2) the introduction of orography has a greater impact than the effect of stretching. Results presented here suggest that dynamical core integrations with both uniform and stretched grids should consider orographic forcing as an integral part of the model dynamics.
1. Introduction Severe computational problems for finite-difference approximations may occur when irregular spacing is used. These problems affect the accuracy of approximation, computational stability, computational dispersion, and other properties of finite-difference schemes and have been discussed since the 1970s in computational fluid dynamics (e.g., Roache 1976; Vichnevetsky 1987; Oliger and Sundstrom 1978; Fletcher 1988) involving the advection equations. For atmospheric models, additional numerical problems arise from the cou-
* Additional affiliation: General Sciences Corporation, Beltsville, Maryland. Corresponding author address: Dr. Michael S. Fox-Rabinovitz, Department of Meteorology, University of Maryland at College Park, College Park, MD 20742. E-mail:
[email protected]
q 2000 American Meteorological Society
pling of variables between the governing equations and may affect, for example, propagating gravity waves (e.g., Staniforth 1995, 1997; Cote 1997; Fox-Rabinovitz 1988). A general solution for these problems is to introduce diffusion-type filters and uniform ‘‘conservative’’ stretching, with constant local stretching factors that typically deviate no more than 5%–10% from unity. These are the current tools used to control different kinds of computational noise (e.g., Vichnevetsky 1987; Fox-Rabinovitz 1988). For a gridpoint model with variable resolution, the stretched-grid approach where one model is used over the entire globe seems an attractive approach because it is free of ill-posed boundary conditions that arise with nested grids (e.g., Oliger and Sundstrom 1978). The additional computational cost due to stretching versus nesting is not overwhelming because a significant part or even a majority of global grid points may be located inside the area of interest (e.g., Cote 1997). The stretched-grid approach adopted in this study was
1884
MONTHLY WEATHER REVIEW
originally introduced by Dr. A. Staniforth for a finiteelement model (Staniforth and Mitchell 1978). Stretched-grid models have been successfully used operationally for years by two major meteorological centers: the Canadian Meteorological Center with the Regional Finite Element model (e.g., Staniforth and Daley 1979) from the 1980s and by Me´te´o-France with a spectral model since the early 1990s (e.g., Courtier and Geleyn 1988; Yessad and Benard 1996). Encouraging results involving the latter model for regional climate modeling are discussed in Deque and Piedelievre (1995). Other variable-resolution models were developed by Paegle (1989) and the Krishnamurti group (Hardiker 1997). The goal of this paper is not to compare different variable-resolution approaches but rather to study potential downscaling for a finite-difference dynamical core with orography. This study continues the variable-resolution GCM dynamical core experiments started in Fox-Rabinovitz et al. (1997), with the emphasis here on the impact of the realistic orographic forcing. The previous authors’ results have shown that a stretched-grid approach is a credible candidate for regional modeling not only for short-term but also for medium-range and, most importantly, for long-term climatic regional integrations. The global stretched-grid approach must be explored as an alternative methodology to the current widely used nested-grid approach that represented a pioneering first step toward reliable regional climate simulations (e.g., Dickinson et al. 1989; Pielke et al. 1992; Giorgi 1990, 1995). The global variable-resolution approach allows continuous multiyear integrations to be autonomously performed without the need for a driving GCM to provide a continuous or periodic updating of conditions at the region’s boundaries and, for early regional climate models, periodic reinitialization of conditions throughout the region of interest. It also avoids the application of damping techniques within a computational buffer region. Both the updating and noise damping are required in nested-grid models to control severe computational noise arising from the application of lateral boundary condittions. A further advantage of variable-resolution stretched-grid models is that they provide self-consistent interactions between global and regional scales of motion and their associated phenomena. The approach is to be thoroughly investigated for medium-range and especially long-term integrations in terms of efficient downscaling. The authors have recently developed and thoroughly tested the stretched-grid dynamical core of the Goddard Earth Observing System (GEOS) GCM (Fox-Rabinovitz et al. 1997). The dynamical core has finite-difference dynamics identical to that of the GEOS GCM (Suarez and Takacs 1995; Takacs and Suarez 1996) and a Newtonian-type physics (Held and Suarez 1994). The finite-difference dynamics has been adjusted to a variable-resolution stretched grid, and the computational
VOLUME 128
problems related to variable resolution have been successfully resolved. The medium-range and long-term integrations performed with the stretched-grid dynamical core show that over the area of interest (the continental United States) and its vicinity, the regional patterns and characteristics produced by a stretched-grid model are close to those of the control experiment obtained with a global uniform fine-resolution model. The goal of the experiments is to verify to what degree the regional characteristics are affected by the incoming lower-resolution flow, and how the better-resolved part of the flow over the area of interest can provide the desired realistic downscaling to the regional scale. Variable-resolution stretched-grid modeling provides a practical and scientifically attractive way of performing cost-effective regional/subregional integrations with finer resolution over an area of interest than are likely to be possible in the foreseeable future with fine uniform global grid models (Cote 1997; Fox-Rabinovitz et al. 1997). One possible source of difficulty with a variable-resolution GCM involves what vertical resolution should be used. Lindzen and Fox-Rabinovitz (1989) have shown that the consistency of horizontal and vertical resolution should be preserved. Therefore, an increase of horizontal resolution has to be accompanied by the corresponding increase of vertical resolution. Although it is not done in this study we relied upon rather fine vertical resolution (70 layers) used for the dynamical core experiments. There are two major goals of this study. First we verify whether dynamical core integrations with both uniform and stretched grids can or probably should be routinely performed in many cases with orographic forcing included as an integral part of model dynamics. Using the dynamical core framework with realistic orography for the variable resolution study eliminates many of the scale-dependent complications associated with details of moist and other physics parameterizations in GCMs. In this sense, experimenting with a model dynamical core provides an ultimate test of the computational properties of a model’s numerical scheme and its dependence on variable resolution. Second we check whether using a variable resolution dynamical core with a realistic orographic forcing gives a significant downscaling over the area of interest (and its vicinity). We also investigate the impact of orography filtering. These are the important steps toward developing a full diabatic stretched-grid GCM. Section 2 contains a brief introduction to the stretched-grid dynamical core with a realistic orography. The results of the benchmark longterm integrations are presented in section 3, and those of the medium-range integrations with a large total global stretching factor are discussed in section 4. The impact of orography filtering is considered in section 5, and the concluding remarks are given in section 6.
JUNE 2000
FOX-RABINOVITZ ET AL.
2. A brief description of the stretched grid dynamical core with a real orography The GEOS GCM dynamical core has been developed by Suarez and Takacs (1995) following the approach proposed by Held and Suarez (1994). It employs finite differences for the model dynamics that are identical to those of the GEOS GCM (Takacs et al. 1994). A variable-resolution stretched-grid version of this dynamical core without orographic forcing was developed, tested, and experimented with by Fox-Rabinovitz et al. (1997). The numerics of the GEOS GCM, with its desirable conservation of potential enstrophy and other properties, remain unchanged in the stretched-grid version. A filtering procedure was developed to control noise arising due to grid irregularity. The model horizontal filtering techniques are applied to stretched-grid fields. This filtering approach allows us to use large local and total stretching factors or ratios of maximal to minimal grid intervals defined as follows: Local stretching rates are defined by the ratio r j 5 Ds j /Ds j21 ,
(1)
where Ds j and Ds j21 are adjacent grid intervals in the latitudinal or longitudinal direction and j is the horizontal index. Correspondingly, the total global stretching factor is defined as R 5 Dsmax /Dsmin ,
(2)
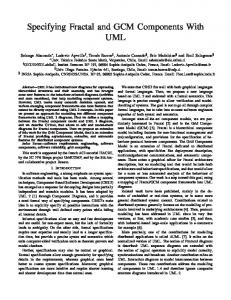
where Dsmax and Dsmin are the maximal and minimal grid intervals in the latitudinal or longitudinal direction, relatively. This flexible, portable global stretched-grid design allows us to specify the area of interest with uniform fine horizontal (latitude 3 longitude) resolution over any part of the globe, such as the United States, used for the GEOS dynamical core experiments. Outside the region, grid intervals increase, or stretch, uniformly with latitude and longitude, with r j 5 constant for all j’s on either side of the area of interest. As a result, the local stretching factor is piecewise constant (Fox-Rabinovitz et al. 1997). Two more important constraints are imposed. First, a uniform stretching is used with ‘‘conservative’’ local stretching rates r j close to unity in both longitudinal and latitudinal directions. Second, maximal grid intervals on the sphere, Dsmax , are limited to several degrees so that the overall global accuracy of approximation is kept close to that of the global uniform grid models. Finally, some undesired computational problems arising from the grid irregularity are controlled by using a uniformly stretched grid (Vichnevetsky 1987; Fox-Rabinovitz 1988; Fox-Rabinovitz et al. 1997). The global variable-resolution stretched grid used in this study is presented in Fig. 1. The area of interest for the grid consists of a rectangular region over the United States (from 258 to 508N and 758 to 1258W). Over this region the grid has uniform fine resolution of 28 3 2.58, 18 3 1.258, or 0.58 3 0.6258. Outside of this area, grid
1885
intervals are stretching and eventually increase to 48 3 58 or 88 3 108. Therefore, the dynamical core experiments are conducted with total stretching factors ranging from 4 to 16. The orography is calculated directly on the stretched grid by averaging, within a grid box, the U.S. Navy’s 1 ⁄68 3 1⁄68 surface elevation dataset available from the National Center for Atmospheric Research (NCAR). The experimental results presented in sections 3 and 4 are obtained without orography filtering. The impact of orography filtering is presented in section 5. For those experiments, the grid-box-averaged orography is passed through a Lanczos (1966) filter in both dimensions, which removes the smallest scales while inhibiting Gibbs phenomena. According to Takacs et al. (1994), the strength of the Lanczos filter is close to that of the second- to eighth-order Shapiro filter (Shapiro 1970). An example of the differences introduced by the Lanczos orography filtering is presented in Fig. 1b. The choice of total stretching factors and local stretching rates depends on the particular model’s use, design, configuration, requirements, and modes of integration. It also depends on a model’s numerical scheme. Usually local stretching rates should not deviate from unity by more than about 5%–10%. This allows very fine mesoscale resolution over the area of interest (e.g., Cote et al. 1993, 1998; Cote 1997) while keeping the resolution elsewhere to be no larger than a few degrees, the typical resolution of uniformly spaced GCMs. A significant percentage (up to 50%) of the total number of grid points is then located within the area of interest. The effect of the stretching is to reduce the number of calculations over the rest of the globe compared to that of uniformly spaced GCMs. Because the number of calculations for a stretched-grid model compared to a global uniform fine-resolution model or control model at typical regional mesoscale resolution is reduced an order of magnitude or more under the computational restrictions outlined above, a stretched-grid model should require at least an order of magnitude less computer memory. Furthermore, the use of semi-implicit time integration schemes rather than explicit schemes is definitely preferable for stretched-grid models because it avoids the time step reduction arising from computational stability requirements. The spherical grid may also be rotated so that the area of interest is located away from the poles (Takacs et al. 1994). For the United States as an area of interest, such a rotation is not necessary but makes sense for the regions located in the close proximity to the poles. The accuracy of stretched-grid integrations with a dynamical core are validated against a corresponding control run with a global uniform resolution equal to the finest resolution of the stretched grid within the area of interest. This is an advantage of the dynamical core framework where no complicating model physics is included. The control run can be used as an ‘‘exact’’ solution that has to be reproduced as closely as possible
1886
MONTHLY WEATHER REVIEW
VOLUME 128
FIG. 1. (a) A global stretched grid with the area of interest over the United States, and (b) an example of a difference field for a stretched grid, between the nonfiltered (NFOROG) and filtered (FOROG) orography. The difference field ranges from 21000 to 2400 m; the contour interval is 100 m.
over the area of interest by the stretched grid run. It allows us to calculate mean and rms errors as deviations from the corresponding control runs. 3. Benchmark long-term integrations In the section, we present the results of both uniform and stretched-grid integrations with a realistic orographic forcing. The results of the medium uniform-grid integrations (with the number of grid points approximately equal to that of a stretched grid) are also included. The grid-box-averaged orography is not filtered in the ex-
periments presented in the sections 3 and 4, whereas the experiments discussed in section 5 are run with a Lanczos filtered orography. Along with the analysis of the time-averaged fields, the corresponding variances, which are more sensitive to resolution and orographic forcing, are included. All of the benchmark integrations were run for 1200 days. The first 120 days of the simulations are not included into our analysis to account for the initial model spinup. The remaining 1080 days of the simulations are divided into three periods, each 360 days long. We call these periods ‘‘years’’ for brevity although within the
JUNE 2000
FOX-RABINOVITZ ET AL.
1887
dynamical core framework with the simplified Held– Suarez diabatic forcing, this term does not correspond to its usual meaning. Due to similarity of the results for all thee years, only the third year mean fields are presented. The July mean fields from the GEOS GCM 10-yr Atmospheric Model Intercomparison Project (AMIP) run are used as initial conditions for all of the experiments described below. After the 120 day spin-up period, there was no impact from initial conditions. a. Global fields The zonally averaged zonal winds for our integrations are presented in Fig. 2. Although a hemispherically symmetric diabatic forcing (Held and Suarez 1994) was used, the hemispheric patterns are not symmetric as they would be in integrations without orography (Fox-Rabinovitz et al. 1997). With orography, the Southern Hemispheric jet is stronger than that in the Northern Hemisphere. The Southern Hemispheric jet for the stretched and medium uniform grid integrations (Figs. 2a and 2c) are closer to each other in terms of the core strength, shape, and gradients. An equatorward shift of the jet was noted in coarser-resolution experiments with a uniform grid (Takacs and Suarez 1996) and a stretched grid (Fox-Rabinovitz et al. 1997). The shift is larger for the stretched-grid integration (Figs. 2a and 2c) than for the control run (Fig. 2b). This is consistent with the fact that the resolution of the stretched grid in the Southern Hemisphere is coarser than that of the medium uniform grid. This coarser resolution for the stretched grid is also responsible for producing large deviations from the control run in the upper levels over the South Pole. For the Northern Hemisphere, with its more mountainous areas than the Southern Hemisphere, the jet core strength is weaker for all runs. The magnitude of this difference is reasonably small and consistent with the Held–Suarez framework. Furthermore, there is a ‘‘kink’’ at 358N in the stretched-grid run (Fig. 2a) that appears to be due to the mountainous region of the Himalayas. (Note that this kink disappears when the time averaging is done over a longer period, 1.5 yr instead of 1 yr, as will be shown in section 5.) Except for that feature, the Northern Hemispheric jet is quite similar in all runs. The zonal-mean meridional winds for the same runs are shown in Fig. 3. The stretched-grid meridional winds near the model tropopause (s 5 0.2–0.3) are better represented in the stretched-grid run (Fig. 3a) than in the medium uniform-grid run (Fig. 3c), when compared to the control (Fig. 3b). The stretched-grid and control runs have similar Hadley cells in the Northern Hemisphere, whereas the medium uniform-grid run has much weaker meridional winds and Hadley cells. The eddy variances for the zonal-mean meridional winds are presented in Fig. 4. The variances for the stretched-grid run (Fig. 4a) are roughly twice as small as those from the control run (Fig. 4b). Similar reduc-
FIG. 2. The annual (for year 3 or days 841–1200 of integration) and zonally averaged zonal winds for the simulations with (a) a stretched grid (SG 28 3 2.58 to 88 3 108), (b) a fine-resolution uniform grid (UG 28 3 2.58) (the control experiment), and (c) a mediumresolution uniform grid (UG 48 3 58). The contour interval is 5 m s21 .
1888
MONTHLY WEATHER REVIEW
FIG. 3. Same as Fig. 2 but for the meridional winds. The contour interval is 0.5 m s21 .
tions in the variance hold for the zonal winds and temperatures. Similar results were found for the experiments with the dynamical core without orographic forcing (Fox-Rabinovitz et al. 1997). Therefore, this reduction of variance is the result of using a stretched grid.
VOLUME 128
The variance patterns for the stretched-grid and control runs are quite similar in many respects. Both Northern Hemispheric distributions are similar as well as the location of the extrema in the vertical for both hemispheres (Figs. 4a and 4b). There is an equatorward shift by ;108 of the variance distribution in the Southern Hemisphere for the stretched-grid run (Fig. 4a) compared to the control run (Fig. 4b). This is due to coarser resolution there with the stretched grid. Still, the distributions are quite symmetric for both hemispheres for the stretched-grid run and even more symmetric for the control run. These distributions should not be completely symmetric for runs with orography whereas symmetry does occur in earlier experiments without orographic forcing (Fox-Rabinovitz et al. 1997) due to the hemispheric symmetry of the Held–Suarez diabatic forcing. The impact of orographic forcing given in terms of variance differences between runs with and without orography for both the stretched-grid and control runs are presented in Figs. 4c and 4d. Orography affects the variance in a similar manner for both runs. The major minima are negative in both hemispheres, indicating that the variances decrease with orographic forcing. The differences in the Northern Hemisphere are larger in the control run because the high uniform resolution control produces a potentially larger variability in the prognostic fields. There is a rather small equatorward shift of ;58–78 in the variance differences in both hemispheres for the stretched-grid run compared to the control run. It is noteworthy that the impact of orographic forcing is global and quite strong, especially over mountainous areas and their vicinity. Let us now consider the horizontal zonal wind fields at s 5 1 and 0.5 levels (Figs. 5 and 6). These fields are free of any computational noise, including over mountainous areas. This is also true for the instantaneous fields. Therefore, the model filtering procedure provides a reliable noise control in the presence of orographic forcing for both uniform- and stretched-grid integrations. In the Northern Hemisphere, the stretched-grid winds (Figs. 5a and 6a) are closer than the medium uniformgrid winds (Figs. 5c and 6c) to those of the control run (Figs. 5b and 6b), especially over the area of interest. In the Southern Hemisphere, the stretched-grid winds are essentially similar to those for the control run. However, they are shifted further equatorward compared to those of the medium uniform grid. Again we see the effect of the coarser grid over the Southern Hemisphere in the stretched-grid run. b. Regional fields It is not enough that our model reproduces the largescale flow. It must also produce realistic smaller-scale regional features. To that end we show the surface wind components for all three runs in Figs. 7 and 8. There
JUNE 2000
FOX-RABINOVITZ ET AL.
1889
FIG. 4. The annual (year 3) and zonally averaged meridional wind variances ([V9]2) for simulations (a) with a stretched grid and (b) with a fine-resolution global grid (the control experiment) and the difference between the experiments with and without (w/ 2 w/o) orography showing the impact of orography for (c) a stretched grid run and (d) the control run. The contour interval is 50 m 2 s 2 .
is a striking similarity between the the stretched-grid and control run winds (Figs. 7a,b and Figs. 8a,b), especially over the Rocky Mountains. The winds for the medium uniform-grid run have the gross features of the control run but fail to reproduce the smaller-scale features. Similar conclusions hold for the other two modeldependent variables, the surface pressure and potential temperature. This confirms that the orographic forcing plays a major role in forming the model’s surface and lower-tropospheric fields. To a great extent, this is also true for higher model levels. The wind components for all three runs at the s 5 0.5 level are presented in Figs. 9 and 10. The maximum zonal winds are located in the eastern part of the United States in both the stretched- and fine uniform(control) grid runs (Figs. 9a and 9b), whereas for the medium uniform-grid run the maxima is much more diffuse, extending toward the central part of the United States (Fig. 9c). Furthermore, over the Rocky Mountains
the similarity between the stretched-grid and control runs (Figs. 9a and 9b) appears stronger than that of the medium uniform-grid run (Figs. 9b and 9c). The general pattern and both the magnitude and location of the two major maxima for the meridional winds are reproduced better by the stretched-grid run (Fig. 10a) than by the medium uniform-grid run (Fig. 10c) when compared to the control run (Fig. 10b). One of the advantages of the dynamical core framework is the possibility for validation by computing errors as deviations from the control run. The mean errors, or biases, over the area of interest are small in both the stretched- and medium uniform-grid runs, with the former being smaller for all model variables in the troposphere and lower stratosphere. The zonal and meridional wind biases range correspondingly from 20.25 to 0.25 m s21 and 20.6 to 0.2 m s21 for the stretched-grid run, and from 21.5 to 20.25 m s21 and 20.2 to 0.6 m s21 for the medium uniform-grid run, respectively. The
1890
MONTHLY WEATHER REVIEW
F IG . 5. The annual (year 3) mean zonal winds at the s 5 1 level for the same simulations as in Fig. 2. The contour interval is 5 m s 21.
potential temperature biases range from 20.6 to 0.8 K for the stretched grid and from 20.6 to 2.5 K for the medium uniform grid, respectively. The regional rms errors for meridional winds, potential temperatures, and other forecast variables are essentially twice as small for the stretched-grid run as for the medium uniform-grid run. Smaller improvement, within 20%–40%, occurs over the entire well-resolved northwestern quadrant. On the other hand, the zonal
VOLUME 128
FIG. 6. Same as Fig. 5 but for the s 5 0.5 level. The contour interval is 5 m s21 .
wind regional rms errors are close for both runs and range from 2.0 to 3.1 m s21 . We conclude our presentation of the benchmark integration with a discussion of prognostic variable variances. The horizontal distribution at the s 5 0.5 level of the zonal wind variances over the area of interest and its vicinity are presented in Fig. 11. The variance distributions are similar over the area of interest for both the stretched grid and global uniform fine grid or control experiments (Figs. 11a and 11b). The variances are larger over the mountainous areas. Over the entire northwestern global quadrant, which
JUNE 2000
FOX-RABINOVITZ ET AL.
1891
FIG. 8. Same as Fig. 7 but for meridional winds. FIG. 7. The regional annual (year 3) mean zonal surface winds (at s 5 1 level) for the same simulations as in Fig. 2. The contour interval is 2 m s21 .
includes our area of interest and is best resolved, the variance errors (biases) or the deviations of the stretched-grid run from the control run (not shown) are small compared to those of other global quadrants. They are of different sign and have magnitudes less than 20 m 2 s22 except for a relatively small area over the north-
eastern states where they reach 240 m 2 s22 . For the remainder of the global quadrants, the variance errors are 2–4 times larger and reach a maximum of 120 m 2 s22 in magnitude. The biases are predominantly positive over the Andes, Himalayas, North and South Africa, and some other mountainous areas. They are negative elsewhere. These errors (biases) for similar experiments without orographic forcing (Fox-Rabinovitz et al. 1997) are 1.5–2.0 times larger in the northwestern quadrant
1892
MONTHLY WEATHER REVIEW
VOLUME 128
FIG. 10. Same as Fig. 9 but for meridional winds. FIG. 9. Same as Fig. 7 but for the s 5 0.5 level.
and reach a maximum of 140 m 2 s22 in magnitude. They are negative essentially everywhere else. These errors (biases) represent the impact of using stretched grids. The efficient downscaling in terms of variances occurs over the area of interest as well as the entire northwestern quadrant. Downscaling is more profound for the stretched-grid experiments with orographic forcing. The impact of orography on variance differences be-
tween the runs with and without orography for the stretched-grid and control runs are shown in Figs. 11c and 11d. The difference patterns are similar for both runs over the area of interest. Strong differences occur over the Rockies and Appalachians. This shows the dominate role of orography on variance distributions. It is noteworthy that the impact of orography on variances over the area of interest (Figs. 11c and 11d) is significantly stronger than the impact of stretching. Our results carry over to other prognostric variable variances.
JUNE 2000
FOX-RABINOVITZ ET AL.
1893
FIG. 11. The annual (year 3) mean zonal wind variances ([U9]2) for the s 5 0.5 level for simulations with orography (a) with a stretched grid and (b) with a fine-resolution global grid (the control experiment) and the errors (bias) or the differences between the experiments with and without (w/ 2 w/o) orography showing the impact of orography for (c) a stretched grid run and (d) the control run. The contour interval is 20 m 2 s22 for (a) and (b) and 10 m 2 s22 for (c) and (d), respectively.
4. Medium-range integrations In this section we consider 10-day integrations using the stretched grid with a fine resolution of 0.58 3 0.6258 over the area of interest and stretching to 88 3 108, which yields a total global stretching factor of 16. The results from the 10-day integrations for this stretched grid and corresponding control run with global uniform fine resolution of 0.58 3 0.6258 are presented in Fig. 12. The vorticity fields over the United States are shown at two s levels. There is a striking similarity between the stretched-grid and control fields. Similar results are found for all of the forecast fields over the entire 10day period for the area of interest and adjacent regions. The forecast fields deviate gradually from the control only after a longer period of integration. Fox-Rabinovitz et al. (1997) showed similar results for zonal winds (Fig.
12 of their paper) for dynamical core integrations without orography (with a flat surface). The July climatological fields were used as initial conditions for all of our runs as well as the simplified dynamical core diabatic forcing. We anticipate that the similarity between the stretched grid and control runs decrease to only a few days when the winter season is simulated with a diabatic model. 5. The impact of orography filtering Fine-resolution orography datasets must be constructed with caution. A model’s orographic forcing should not produce scales in the prognostic variables that are much shorter than those observed when orography is not present. Otherwise, noise can be generated during
1894
MONTHLY WEATHER REVIEW
VOLUME 128
FIG. 12. The regional vorticity fields for the 10th day of integration with (a) a stretched grid (for surface level s 5 1); (b) same as (a) but with a fine-resolution, uniform grid (the control experiment);
model integrations, especially in such sensitive fields as divergence or vertical velocity. To achieve such a consistency, some orography filtering techniques must be introduced and tested. The results presented in sections 3 and 4 were obtained using orography that was grid-box averaged but not filtered. In this section, long-term experiments using filtered orography are discussed and compared with earlier experiments using unfiltered orography. Further, longer (1.5 yr instead of 1 yr) time averaging is introduced to eliminate the impact of insufficient sampling. The results of long-term integrations performed with unfiltered orography (NFOROG) and filtered orography
(FOROG) are shown in Fig. 13. The zonally averaged zonal wind component for the NFOROG run (Fig. 13b) is obtained from the same stretched-grid run as that in Fig. 2a but with the longer (540 days) time averaging. The vertical distributions are quite similar but the small kink noted earlier around 358N (Fig. 2a) is not present in Fig. 13b due to the longer time averaging. Using this longer period seems to be more appropriate statistically for intercomparisons of dynamical core integrations. The hemispheric jets for the stretched-grid NFOROG run (Fig. 13b) are more asymmetric than those of the stretched-grid FOROG run (Fig. 13a). Figures 13c and 13d show the errors for the stretched-grid runs. Again,
JUNE 2000
FOX-RABINOVITZ ET AL.
1895
FIG. 12. (Continued ) (c) same as (a) but for the s 5 0.5 level; and (d) same as (b) but for the s 5 0.5 level. Contour interval 5 2 3 1025 s21 .
the errors are defined as the deviations between a given run and its corresponding control, which uses a uniform fine global resolution. These errors are small for the Northern Hemisphere for both stretched-grid runs although they are somewhat smaller for the NFOROG run. For the Southern Hemisphere, the jet core strength is slightly overestimated for the stretched-grid NFOROG run (Fig. 13d) compared to that of the stretchedgrid FOROG run (Fig. 13c). The zonally averaged meridional winds for the stretched-grid runs (not shown) are also characterized by slightly larger errors for the NFOROG run. The horizontal distributions of the 500-hPa zonal winds are presented in Fig. 14. The FOROG control
(Fig. 14a), the stretched-grid NFOROG (Fig. 6a), and FOROG (not shown) fields are very similar to each other over the Northern Hemisphere, especially the United States, our area of interest. The errors for the stretchedgrid FOROG and NFOROG runs (Figs. 14b and 14d), again calculated against their corresponding uniform fine global resolution control runs, are smaller for the FOROG run over the Himalayas and Andes. For comparison, Fig. 14c shows the errors for a run without orographic forcing (Fox-Rabinovitz et al. 1997) calculated against its control run. We see that orographic forcing in the dynamical core did not result in introducing significantly larger errors, especially in the FOROG run. The relatively smaller errors over the area of
1896
MONTHLY WEATHER REVIEW
VOLUME 128
FIG. 13. The zonally and temporally (for the last 540 days of dycore integration) averaged vertical distributions of zonal winds for (a) the stretched-grid run with the filtered orography (FOROG), (b) the stretched-grid run with the nonfiltered orography (NFOROG), (c) the errors or deviations between the run shown in (a) and the corresponding FOROG control run, and (d) the errors or deviations between the run shown in (b) and the corresponding NFOROG control run. Contour intervals are 5 m s 21 for (a) and (b) and 2 m s21 for (c) and (d), respectively.
interest, as well as over most of the northwestern quadrant of the globe, indicate that a definite downscaling takes place in all of our experiments. Our results, as well as those of other forecast fields, show that the stretched-grid FOROG run produces smaller errors than those of the stretched-grid NFOROG run. Therefore, orography filtering appears to be beneficial for our dynamical core experiments. Our results also show that there is significant sensitivity to the orography filtering within a model dynamical core. Consequently, this suggests the importance of developing and testing specific orography filtering techniques for GCMs with increased resolution. 6. Conclusions The following conclusions were obtained in this study. 1) Realistic orography has been successfully included
into a uniform and stretched grid version of a finitedifference GCM dynamical core. The filtering technique developed by Fox-Rabinovitz et al. (1997) was used for the dynamical core integrations. 2) A benchmark long-term integration with the stretched-grid dynamical core was quite similar to the control’s global annual-mean fields and was striking similar to the regional annual-mean fields. The control consisted of numerical experiments performed with the same dynamical core but employing a uniform grid with a resolution equal to the finest resolution of the stretched grid. Furthermore, the stretched-grid simulation is closer to the control than one using a medium-resolution, uniform grid (with the same number of grid points as the stretched grid). 3) A 10-day integration with the stretched grid with the large total global stretching factor of 16 shows a striking similarity to regional forecast fields given by the control experiment.
JUNE 2000
FOX-RABINOVITZ ET AL.
1897
FIG. 14. The 500-hPa time-averaged (for the last 540 days of dycore integrations) zonal winds for (a) the global uniform fine-resolution control run with the filtered orography (FOROG), (b) the errors or deviations between the stretched-grid and control FOROG runs, (c) same as (b) but for the runs without orography, and (d) same as (b) but for the nonfiltered orography (NFOROG) runs. Contour intervals are 5 m s21 for (a) and 2 m s21 for (b), (c) and (d), respectively.
4) The impact of orography filtering was assessed and found predominantly positive. There is significant sensitivity to the manner in which orography is included. This suggests that specific orography filtering techniques should be developed and tested for GCMs with increased resolution. 5) Our results show that dynamical core integrations with both uniform and stretched grids could and probably should be run with orography included as an integral part of the model dynamics. 6) Our results constitute an important step toward development of the full diabatic stretched-grid GCM. Acknowledgments. The authors would like to thank the editor, Dr. D. Duffy, for his careful editing of the paper and Ms. Monique Hall for typing the manuscript. The study has been supported by NASA Grant 578-4111-20. We would like to thank Dr. Kenneth Bergman, the NASA program manager, for his support of the study. REFERENCES Cote, J., 1997: Variable resolution techniques for weather prediction. Meteor. Atmos. Phys., 63, 31–38.
, M. Roch, A. Staniforth, and L. Fillion, 1993: A variable-resolution semi-Lagrangian finite-element global model of the shallow-water equations. Mon. Wea. Rev., 121, 231–243. , S. Gravel, A. Metot, A. Patoine, M. Roch, and A. Staniforth, 1998: The operational CMC/MRB Global Environmental Multiscale (GEM) model. Part I: Design considerations and formulation. Mon. Wea. Rev., 126, 1373–1395. Courtier, P., and J.-F. Geleyn, 1988: A global numerical weather prediction model with variable resolution: Application to the shallow-water equations. Quart. J. Roy. Meteor. Soc., 114, 1321– 1346. Deque, M., and J. P. Piodelievre, 1995: High resolution climate stimulation over Europe. Climate Dyn., 11, 321–339. Dickinson, R. E., R. M. Errico, F. Giorgi, and G. T. Bates, 1989: A regional climate model for the western United States. Climatic Change, 15, 383–422. Fletcher, C. A. J., 1988: Computational Techniques for Fluid Dynamics. Vol. 2. Springer-Verlag, 541 pp. Fox-Rabinovitz, M. S., 1988: Dispersion properties of some regular and irregular grids used in atmospheric models. Preprints, Eighth Conf. on Numerical Weather Prediction, Baltimore, MD, Amer. Meteor. Soc., 784–789. , L. V. Stenchikov, M. J. Suarez, and L. L. Takacs, 1997: A finite-difference GCM dynamical core with a variable resolution stretched grid. Mon. Wea. Rev., 125, 2943–2968. Giorgi, F., 1990: Simulation of regional climate using a limited area model nested in a GCM. J. Climate, 3, 941–963. , 1995: Perspectives for regional earth system modeling. Global Planet. Change, 10, 23–42.
1898
MONTHLY WEATHER REVIEW
Hardiker, V., 1997: A global numerical weather prediction model with variable resolution. Mon. Wea. Rev., 125, 349–360. Held, I. M., and M. J. Suarez, 1994: A benchmark calculation for the dry dynamical cores of atmospheric general circulation models. Bull. Amer. Meteor. Soc., 75, 1825–1830. Lanczos, C., 1966: Discourse on Fourier Series. Hafner Publishing, 255 pp. Lindzen, R. S., and M. S. Fox-Rabinovitz, 1989: Consistent vertical and horizontal resolution. Mon. Wea. Rev., 117, 2575–2583. Oliger, J., and A. Sundstrom, 1978: Theoretical and practical aspects of some initial boundary value problems in fluid dynamics. SIAM J. Appl. Math., 35, 419–446. Paegle, J., 1989: A variable resolution global model based upon Fourier and finite-element representation. Mon. Wea. Rev., 117, 583– 606. Pielke, R. A., and Coauthors, 1992: A comprehensive meteorological modeling system—RAMS. Meteor. Atmos. Phys., 49, 69–91. Roache, P. J., 1976: Computational Fluid Dynamics. Hermosa Publishers, 446 pp. Shapiro, R., 1970: Smoothing, filtering and boundary effects. Rev. Geophys. Space Phys., 8, 359–387. Staniforth, A., 1995: Regional modeling: Theoretical discussion. WMO PWPR Rep. Series, No. 7, WMO/TD-No. 699, 61 pp. , 1997: Regional modeling: A theoretical discussion. Meteor. Atmos. Phys., 63, 15–29. , and H. Mitchell, 1978: A variable resolution finite element
VOLUME 128
technique for regional forecasting with primitive equations. Mon. Wea. Rev., 106, 439–447. , and R. Daley, 1979: A baroclinic finite element model for regional forecasting with the primitive equations. Mon. Wea. Rev., 107, 107–121. Suarez, M. J., and L. L. Takacs, 1995: Documentation of the Aries/ GEOS dynamical core, version 2. NASA Tech. Memo. 104606, NASA Goddard Space Flight Center, Greenbelt, MD, 103 pp. [Available from Data Assimilation Office, Laboratory of Atmospheres, NASA Goddard Space Flight Center, Greenbelt, MD 20771]. Takacs, L. L., and M. J. Suarez, 1996: Dynamical aspects of climate simulations using the GEOS GCM, version 10. NASA Tech. Memo. 104606, 56 pp. [Available from Data Assimilation Office, Laboratory of Atmospheres, NASA Goddard Space Flight Center, Greenbelt, MD 20771]. , A. Molod, and T. Wang, 1994: Goddard Earth Observing System (GEOS) General Circulation Model (GCM), version 1. NASA Tech. Memo. 104606, NASA Goddard Space Flight Center, Greenbelt, MD, 97 pp. [Available from Data Assimilation Office, Laboratory of Atmospheres, NASA Goddard Space Flight Center, Greenbelt, MD 20771]. Vichnevetsky, R., 1987: Wave propagation and reflection in irregular grids for hyperbolic equations. Appl. Numer. Math., 2, 133–166. Yessad, K., and P. Benard, 1996: Introduction of local mapping factor in the spectral part of the Meteo-France global variable mesh numerical forecast model. Quart. J. Roy. Meteor. Soc., 122, 1701–1719.