10.4
NUDA: A Non-Uniform Debugging Architecture and Non-Intrusive Race Detection for Many-Core Chi-Neng Wen1, Shu-Hsuan Chou1, Tien-Fu Chen1 and Alan Peisheng Su2 1
National Chung-Cheng University, Taiwan 1 {wcn93, csh93, chen}@cs.ccu.edu.tw 2 Global Unichip, Taiwan 2
[email protected] tional methodologies because subsequent executions with identical inputs are not guaranteed to result in the same behavior. Using a software instrument or debugger to insert probe code into the target program can help to identify potential problems, but may cause a probe effect [1]. Since large-scale many-core systems [2] often feature concurrent execution, concurrent code bases no longer execute in the artificial context of switch-based multi-threading.
ABSTRACT Traditional debug methodologies are limited in their ability to provide debugging support for many-core parallel programming. Synchronization problems or bugs due to race conditions are particularly difficult to detect with software debugging tools. Most traditional debugging approaches rely on globally synchronized signals, but these pose problems in terms of scalability. The first contribution of this paper is to propose a novel nonuniform debug architecture (NUDA) based on a ring interconnection schema. Our approach makes debugging both feasible and scalable for many-core processing scenarios. The key idea is to distribute the debugging support structures across a set of hierarchical clusters while avoiding address overlap. This allows the address space to be monitored using non-uniform protocols. Our second contribution is a non-intrusive approach to race detection supported by the NUDA. A non-uniform page-based monitoring cache in each NUDA node is used to watch the access footprints. The union of all the caches can serve as a race detection probe. Using the proposed approach, we show that parallel race bugs can be precisely captured, and that most falsepositive alerts can be efficiently eliminated at an average slowdown cost of only 1.4%~3.6%. The net hardware cost is relatively low, so that the NUDA can readily scale increasingly complex many-core systems.
Many-core debugging poses several challenges. First, the debugging or monitoring cannot disturb the sequential consistency of the target program. This kind of disturbance is called a “probe effect,” and will tend to mask certain synchronization errors after an unknown delay. In fact, it is very easy to cause a probe effect if one fails to adequately separate the debugging data path from the standard data path [3, 4]. To address this issue, OCP-IP [3] recently announced an independent debugging bus for industry many-core debugging. Second, in the context of parallel sequencing, on-chip trace modules are usually employed to record program execution or memory/register state changes and to allow for reliable offline re-execution using this information. This requires a large on-chip trace buffer, and also needs a global timestamp to correlate traces across different cores. Contemporary embedded processor paradigms such as ARM CoreSight [12] and MIPS On-Chip Instrumentation [3] feature nonintrusive trace modules embedded within the processors. Third, bugs due to unsynchronized access to shared memory in parallel programs (or so-called race conditions) are even harder to detect using traditional debuggers; even the on-chip trace modules are supported. A lengthy trace may be needed in order to observe a race condition that results from multiple concurrent accesses. Rather than fully tracing the entire execution, we advocate detecting data races, and alerting the debugger/monitor to record traces for debugging replay.
Categories and Subject Descriptors B.8.1 [PERFORMANCE AND RELIABILITY]: Reliability, Testing, and Fault-Tolerance, C.1.3 [Other Architecture Styles]: Heterogeneous (hybrid) systems
General Terms Design, Performance
Keywords
Software solutions such as Eraser [6] use intrusive software instruments to probe all of the lock/unlock operations and memory access events, in order to detect data races swiftly. However, intrusive instrumentation changes the execution sequence and also contributes to the probe effect. Hence, false positives may be reported. However, such phenomena can be eliminated if a happen-before relation is considered for shared access events [7]. Consequently, such tools [8] need to strike a balance between an impractically long trace and an unacceptably imprecise result. FDR [9] and Rerun [10] are hardware approaches that use a lowoverhead hardware recorder in the context of caches or cores, to essentially log the minimum thread ordering information that is necessary to faithfully play back multiprocessor execution after the event. The other hardware approach is HARD [11], which employs additional fields (such as a Bloom filter vector) in the cache and detects the race condition using this Bloom filter.
Many-core, Debugging, Architecture, Race detection
1. INTRODUCTION Multitasking concurrency in the context of parallel programs is essential to the future development of MPSOC. However, nondeterministic parallel programs are hard to debug with tradiPermission all of Permission to to make make digital digital or or hard hard copies copies of of part all ororpart of this this work work for for personal personal or or classroom classroom use use is is granted granted without without fee fee provided provided that that copies copies are are not distributed for for profit or commercial advantage and thatand copies notmade madeoror distributed profit or commercial advantage that bear thisbear notice the full the firstonpage. To copy copies thisand notice andcitation the fullon citation the first page.otherwise, To copy to republish,ortorepublish, post on servers to servers redistribute lists, requires otherwise, to postoron or toto redistribute to prior lists, specific and/or a fee. and/or a fee. requirespermission prior specific permission DAC’09, DAC’09,July July26-31, 26-31,2009, 2009,San SanFrancisco, Francisco,California, California, USA USA Copyright Copyright 2009 2009ACM ACM978-1-60558-497-3/09/07....10.00 978-1-60558-497-3/09/07.....5.00
148 Authorized licensed use limited to: National Sun Yat Sen University. Downloaded on October 30, 2009 at 01:39 from IEEE Xplore. Restrictions apply.
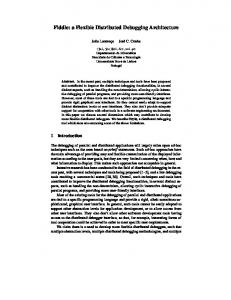
Figure 1. The NUDA system architecture. However, the Bloom filter may cause false positives and the cache flush may empty the BFvector thereby interfering with the filter. Furthermore, it can be challenging to remove locks from the BFvector during unlock operations. The concept of nonuniform cache architecture (NUCA) is commonly used for L2 cache sharing in many-core system [5], because it represents a distributed sharing mechanism with non-uniform memory access latency. The NUCA takes advantages of high data locality to shorten access latency and low cache-miss rates, and without cache-coherency overhead.
for use in lock-based programs. A non-uniform page-based monitoring cache in each NUDA node is used to watch the access footprints, and the union of all the caches can serve as a large data-race detection probe. This work also proposes a programmable debugging methodology, by which users specify anchors and execution sequences to ensure that interactions between parallel programs are executed in the correct sequence. The performance slowdown associated with the NUDA is almost negligible because intra-cluster debugging event checks are more frequent than inter-cluster interactions. We demonstrate that the target system can remain non-intrusive when being debugged and probed for synchronization problems using the proposed NUDA mechanism.
Most debugging functions are based on watching instruction and data addresses generated by the processors. The debug engine must constantly check with either breakpoint or watchpoint registers. A many-core system makes the debugging even more complicated. Most traditional debugging facilities rely on globally synchronized signals and are not scalable to many-core systems. Synchronization problems or bugs due to race conditions are particularly difficult to detect. In addition to address comparisons using breakpoints and watchpoints, data race detection involves extra requirements to watch many more lock/unlock and shared addresses at the same time. Hence, this paper proposes a "Non-Uniform Debugging Architecture" (NUDA) to solve the scalability problem in the context of manycore debugging.
This paper is organized as follows. Section 2 details the proposed NUDA for debugging parallel programs in many-core systems. Section 3 presents an example of the use of NUDA for non-intrusive race detection. Section 4 details the proposed software assist and debug methodologies. Section 5 presents our experience of using the proposed solution to analyze a parallel benchmark (SPLAH-2). Finally, Section 6 offers our conclusions.
2. A NON-UNIFORM DEBUGGING ARCHITECTURE Most of today’s many-core debugging is trace-based and relies on off-line verifying of history or execution sequencing. The drawback of this methodology is an unacceptably large storage requirement and slow operating cycles.
The key idea of the NUDA is that we distribute the monitoring data and instruction addresses in a hierarchical manner using a non-uniform address space, caching frequent addresses with distributed CAM tables, and thereby avoiding the need for centralized address comparisons. Once any alert event is detected, the NUDA employs a synchronization-token mechanism to globally notify all of the processor cores to stop or to restart, without relying on a global synchronized signal. With NUDA’s distributed notification abilities, we can implement various debugging facilities to watch, detect, or even capture the execution trace in order to help develop parallel programs in many-core systems.
2.1 The NUDA for Scalability and Flexibility Non-Uniform Debugging Architecture (NUDA) is a technique that has been proposed for sequentially consistent parallel programs that must be debugged on many-core system. It has a flexible and configurable infrastructure to handle growing numbers of cores in the future. Figure 1(a) shows a 64-core system with NUDA, which contains a flexible ring interconnection that can be extended as the system grows. The reason for using the ring interconnection is not only to reduce costs but also to take advantage of the ring broadcast mechanism for the synchroniza-
Another contribution of this paper is to develop a nonintrusive race detection methodology supported by the NUDA
149 Authorized licensed use limited to: National Sun Yat Sen University. Downloaded on October 30, 2009 at 01:39 from IEEE Xplore. Restrictions apply.
tion of cores. Figure 1(b) shows a NUDA cluster that features eight neighboring cores and allows communication with the related NUDA node via an independent debugging bus. The NUDA cluster connects to the ring and shared non-uniform memory structure. Eventually, as shown in figure 1(c), the NUDA node will support run-time debugging requirements, such as race detection, thanks to a well-organized and configurable HW structure. In addition, the NUDA node can handle intra-cluster race detection efficiently while still being able to reach the entire system’s access record using non-uniform memory structures. There are two kinds of event that occur in the proposed NUDA. One is the transfer of data to a certain NUDAnode as shown in Figure 1(a), and the other involves broadcasting updates or token synchronization to each NUDA-node. There are three challenges for NUDA. First is the management of distributed sharing pages in figure 1(c), which record the shared memory accesses footprints. This requires reducing the overhead of shared pages access between clusters, when accessing certain remote pages frequently. As with NUCA [4, 5], NUDA’s shared pages can be migrated in order to reduce the debugging processing latency in the context of intra-cluster event-checking. Next, to ensure non-intrusive debugging, there are several situations under which all cores should be stopped for proper operation. Therefore, the NUDA needs a synchronized mechanism for starting/stopping all the cores - we call this the "Sync-Token" approach. Finally, the cost is dominated by the memory usage of each NUDA node and the bandwidth of the ring interconnection. Compared to current several MB memory-bit usages, the NUDA only uses a few KB in each cluster. Compared to the bandwidth of current network-on-chip systems (128-bitХ), the bandwidth of the ring interconnection for debugging only uses 16- or 8-bit operations in the context of infrequent inter-cluster events. The design strategy of CAM involves a page-based fully-associative structure for keeping the monitored shared page index in a shared access table until it is no longer required. Furthermore, the page-based strategy allows for distributed sharing using the non-uniform SRAM associated with every NUDA node.
Figure 2. Example of "Sync-Token" for non-intrusive control. synchronously and to use a fixed latency to maintain nonintrusive operation. Non-intrusive control plays a role as follows: -
"Start/Stop all cores" Ш break/watch points, DCP bufferfull, shared access table page-migration, race detected, assertion, etc.
-
"Update all cores" Ш events for checking user-defined assertions (update the SEQ_map as shown in Figure 1(c)).
In this work, we propose a "Sync-Token" mechanism for synchronous debug-control. The key idea behind our “SyncToken" is to pass a specific and related countdown number to each NUDA node. This countdown number decreases incrementally with time. When the token passes though all of the NUDA nodes, the countdown numbers across the nodes are allowed to reach zero, whereupon they can be synchronized for start/stop/update operations. Figure 2(a) shows an example of how the sync-token works. Assume Sync-event A happens in NUDA node N3 and is associated with token number 4. One cycle later, Token A broadcasts to NUDA node N2 and NUDA node N4 and transmits token number 3. At the same time, the token number at NUDA node N3 itself decreases to 3. Therefore, NUDA nodes N2, N3, N4 are synchronized as shown in Figure 2(b). However, there is another Sync-event B that is being concurrently processed by NUDA node N7. The tokens broadcast contention, as shown in Figure 2(c). NUDA nodes N1, N2, N3, N4, and N5 are synchroLockset
In Figure 1(b), the NUDA cluster features a NUDA node connecting a group of cores with a local debugging bus (Dbus). The NUDA node is responsible for run-time debugging, core debugging control, race detection, and communication with other clusters. Debugging events, such as memory accesses, lock/unlock requests, thread activations, check points etc. are all filtered and transmitted by a debugging co-processor (DCP) on each core. Each DCP contains a small number of buffers to ensure robustness to any delays that may be caused by a stream of successive transmissions from the cores to the Dbus. The NUDA-node can perform flexible and versatile functions, and the NUDA-cluster is scalable and compatible with a wide range of many-core architectures.
8 cores
2.2 Sync-Tokens for Non-uniform Control
M
The latency associated with debugging control propagation is challenging. Such latency may interfere with the original execution ordering in a run-time debug scenario. It is essential for programmers to fully understand actual multithreading execution ordering in a system. For example, when a breakpoint is reached by a certain core, all the other cores may stop at different times if no synchronized mechanism exists to bring them to a halt simultaneously. This can lead to a programmer misidentifying an actual break point. Our solution is to stop all the cores
Figure 3. Block diagram of Race Detection.
150 Authorized licensed use limited to: National Sun Yat Sen University. Downloaded on October 30, 2009 at 01:39 from IEEE Xplore. Restrictions apply.
nized by token number 2 and NUDA nodes N0, N6, N7 are synchronized by token number 3. Under our mechanism, lowernumbered tokens can inherit larger numbers, so that Sync-event B will hold and wait to be re-sent at NUDA node N7. While all the tokens across the NUDA nodes count down to zero, all the NUDA nodes can be synchronized for non-intrusive control.
3. NUDA EXAMPLE: NON-INTRUSIVE RUN-TIME RACE DETECTION Figure 3 shows the block diagram for our proposed real time race detection methodology. The basic idea unites software and hardware approaches to detect races in real time. We use an Eraser-like [6] algorithm to detect races, but we can also address more complicated locking protocols. We insert certain cocoprocessor instructions into the thread library. As the software meets certain conditions, these instructions will invoke the DCP to transmit related events to the NUDA node in the cluster. The hardware consists of a monitor and bookkeeping module, a lockkey table, a core-status table, a shared access table and data race detection logic. The non-uniform property of NUDA allows for both inter-cluster table referral and private use within the cluster.
Figure 5. The workflow of NUDA debugging. Otherwise, the CAM will reveal the start index of the access record table, indexed according to the memory page address. Each NUDA node features both content-addressable memory (CAM) and SRAM. The monitored capacity is related to the granularity of the smallest monitoring unit for monitoring. The NUDA protocol can scale the granularity between 32 words and 4KB. The selected granularity will influence the number of false positives. For example, a coarse grain resolution means monitoring a larger shared memory scope. Every access event under this scope will be treated as suspect, and this may lead to false identification of race conditions. The shared access table shown in Figure 3 is stored in non-uniform SRAM, which records the footprint of shared memory access events. To more quickly locate the entry in this table, we use a page CAM to address the relationship between shared page addresses and block numbers in the context of a shared access table. The entries (M) of the SRAM are partitioned by the entries (N) of the page CAM, and the block size (B bytes) of the shared access table is consequently the smallest monitoring unit for monitoring. Therefore, the monitored capacity of the shared access table is M *B bytes and the page CAM entries require (M *B)/4K (assuming 1 page = 4KB, N = 8). However, as shown in Figure 2, the physical memory-bit usage is only M *8 bytes.
In order to maintain global sequencing, the “Sequence Identify” (SqID) parameter will be dispatched and incremented with each event. The SqID resets when threads exit. When a thread is created, the DCP sends a new thread packet, which consists of a core identifier (CoreID) and a thread identifier (TID). Once the monitor and bookkeeping module receive this packet, the entry in the core-status table with index CoreID can be initialized and updated. Following the success of a lock/unlock event, the DCP sends the CoreID, TID and lock key address to the NUDA node. Figure 4 shows a nested write locks example in the context of Thread B. The monitor and bookkeeping module receive this packet. Then, if this is a brand new lock event, the bookkeeping module will rename this event under a new lock set entry and will update this entry index to the corresponding Core-Status table entry’s Lock-Set field. We use (LockSet, Level) to represent each unique key. In this example, the lock set 0 will be created as write lock S1 is acquired with key (0, 0). In contrast, if a nested lock/unlock event occurs, the bookkeeping module first accesses the Core-Status table to determine the current lock set and update the level bitmap. In this example, the level bitvector of LockSet0 would be updated from 16‘b1 to 16’b11 as the write lock S2 gets acquired with key(0, 1). Our methodology supports a lock renaming mechanism, which allows the process of unlocking to be efficiently conducted for various related variables. This in turn greatly reduces race-detection complexity.
4. SOFTWARE ASSISTANCE NUDA handles generic debugging tasks through ICE. We propose a debugging programming model that can help the user to configure NUDA. The key idea behind our proposed debugging directives is to place several logic checkpoints in order to ensure that events occur as programmers expect.
4.1 Placing debugging directives in program Figure 5 illustrates the NUDA debug workflow. We use the #pragma directives in C to command the compiler to appropriately handle NUDA debugging information. The compiler converts the appropriate data to co-processor instructions, which is defined in the DCP. The NUDA-compiler then generates binaries that include both a configuration part and an assertion part. These configurations are then sent to the DCP and NUDA nodes, before the target application execute.
In terms of memory access, DCP allows the access address to filter through the entire range of shared addresses. As above, the monitor and bookkeeping modules receive the memory access packet from the DCP, and they check the page CAM to determine whether this address is within the scope of this cluster monitor. If not, the NUDA node will forward this packet to the destination NUDA node by referencing the directory in the ICE.
Figure 6 shows some simple sample code for the NUDA de-
Figure 4. Lock renaming (Lockset & Bitmap) for nested locks.
Figure 6. Sample code for NUDA debugging.
151 Authorized licensed use limited to: National Sun Yat Sen University. Downloaded on October 30, 2009 at 01:39 from IEEE Xplore. Restrictions apply.
Table I. Target System Parameters.
bugging programming. First, a set of generic configuration compounds allow the user to configure debugging commands. The NUDA node can be set to monitor particular shared spaces, validate threading sequences and insert customized watchpoints. Second, anchor point directives can be inserted into any part of the program or into event libraries. These anchors are ultimately translated into co-processor instructions, which in turn are used to notify the DCP that the core is passing a particular anchor. The DCP buffers this information and then transfers it to the appropriate NUDA controller.
simulator #core
Simulator parameters mcore ISA 64 CPU family NUDA parameters
#cores in cluster parallel processing ability in NUDA-node bit-width of ring interconnection (bit) latency of ring interconnection (cycle) DCP buffer size (word) NUDA-node monitor block size (words) Shared access table size CAM mapped page size
We propose a set of primitives to help the programmer better debug multithreaded programs on many-core systems. The diFOCUS_ON(&key), DONT_CARE(&key), and rectives: MONITOR(&memory, size) help the programmer identify any suspect code that requires further analysis. The SEQ syntax allows the developer to identify certain execution sequences. Using this protocol, the system can compare any token’s identity with the current SEQ map field in the NUDA configurable logic. The NUDA controller can immediately stop execution if the sequence does not follow the given assertion rules. The cost of implementing the SEQ map is low. Because of the NUDA can handle at most eight steps and only needs an 8x8 SEQ bitmap.
x86 Intel® Atom™
4, 8 single, bi-direction 8, 16 1, 2 4,8 8, 16, 32 16~256KB 0.5~4KB
race detection. We found the overhead to be inversely proportional to buffer size; more DCP buffers can tolerate more concurrent memory access events. Figure 7 shows slowdown effects with respect to buffer size that the average overhead for 4-word to 8-word buffers is small. In addition, the stall caused by shared access table migration is also low. This is because most of the benchmarks use the shared spaces separately. In contrast, we note that benchmarks ocean, mp3d, and water-nsquared all have high density spaces and higher migration stall rates. The page usage column in Table II shows the maximum usage of the shared access table pages across the whole system. Lower page usage rates can reduce inter-cluster traffic and improve performance. Also, the inter-/intra- cluster ratio represents the events relation between inter-cluster and intra-cluster. More intercluster events means more chances to do NUDA migration and effects performance.
We use Ai to identify anchors and three different symbols to represent the ordering of execution. The statement SEQ{A2,(A3,A1),A0,(A7|A5|A4),A6} denotes that A2 happens at least once. (A3, A1) denotes that A3 should happen after A1 and that this sequence happens at least once and (A7|A5|A4) indicates that each of A7, A5, A4 occur randomly. Hence, the white and black boxes represent the duration of the execution event, and the black box represents a violated sequence caught by NUDA.
4.2 Exception handling (error control) In many-core systems, especially real time ones, NUDA can serve as a system safety monitor. Certain alternative approaches [12] have attempted to analyze trace records using trace data. However, the number of emergent events can rapidly exceed the available storage capacity. NUDA can throw exceptions when bugs are caught or other situations occur. Exception handlers are used to prevent system crashes or to notify a backend debugger.
Figure 7. Slowdown effects. Table III shows the comparison results with other approaches for race detection. The hardware approach, [11], offers fewer false positives than Valgrind and operates as fast as run-time (0.1~2.6%Ц). However, it depends on the cache and cache coherence mechanisms. We believe that this implicit cost of cache coherence is too high and infeasible in most many-core environments. Our proposed NUDA features non-intrusive truly race detection without false positives. The system offers negligible slowdown (0.51~3.06%Ц), and supports user defined assertions. Table III also shows the related hardware cost estimates for several popular many-core processors, interconnection units, and memory by CACTI 5.3 [15]. We assume that a many-core environment is composed of 64 Intel Atom processors, with 16KB I/D cache for each core, and 16MB L2-NUCA for sharing. The
5. EXPERIMENTS The NUDA has been evaluated by a parallel simulator mcore [13] in the context of the SPLASH2 benchmarks [14], as shown in Table I. We used seven race-free SPLASH2 benchmarks to evaluate NUDA. Those benchmarks work with lock-based multi-threading programming model. Basically race detection by NUDA is real-time and nonintrusive to the original execution. However, in case that the monitoring buffer is full, the whole system has to be stopped. Table II illustrates NUDA overhead in SPLASH-2 for runtime
Table II. Benchmarks’ statistics, resource requirements, debugging event rate, and performance.
152 Authorized licensed use limited to: National Sun Yat Sen University. Downloaded on October 30, 2009 at 01:39 from IEEE Xplore. Restrictions apply.
Table III. Comparisons of race detection methods (64-core).
References [1]
[2]
[3] [4]
[5]
total estimated area is 564 mm2 using 65nm technology. Comparing HARD and NUDA, the main factors in our estimates were memory-usage and interconnections. Other elements (logic, FSM, etc.) do not impact chip area. In HARD, the BFvector (2B/per line) in the L1 cache is estimated from SRAM usage, while the BFvector (2B/per line) in the L2 cache is estimated from DRAM usage. There are 8 NUDA nodes in our proposed system. In addition, the width of the ring interconnection that links all 9 nodes (include the many-core ICE) is 1B, and we also include the ring routers. As shown in Table III, the HARD has 0.98% (5.53/564) of the area cost compared with the proposed many-core system, and this work has 0.37% (2.08/564) overhead.
[6]
[7]
[8]
Table V. Race detection by renaming locks. [9]
[10] Table V compares the race detection results. We modified the SPLASH2 macro to create delta locks, which involve assigning different locks every time a lock is acquired. The software, [8], produced too many false positives and the execution speed is slower. This work do not compare with HARD duo to can’t precise to model HARD in 64 cores system, but according to the paper of HARD, that reports false positive and false negatives on account of Bloom filter and L1 cache misses. In addition, we emphasize that NUDA is not only a race detector but is also a debugging platform.
[11]
[12] [13]
6. CONCLUSION In this paper, we have presented a novel, configurable and efficient non-uniform architecture for many-core debugging. A maximum of four cores can connect with a simple local debugging bus; the debugging bus in turn connects to the NUDA node. Each such node can connect to a maximum of two debugging buses. Each node can handle race detection and user specific tasks, such as event tracing, execution sequential verification, and so on. Our results show that the average overhead of NUDA on a 64-core system is 3.6% when detecting races.
[14]
[15]
McDowell, C. E. and Helmbold, D. P. 1989. Debugging concurrent programs. ACM Comput. Surv. vol. 21, no. 4, 593-622. (Dec. 1989), Borkar, S. 2007. Thousand core chips: a technology perspective. In Proceedings of the 44th Annual Conference on Design Automation (San Diego, California, June 04 - 08, 2007). Standard Debug Interface Socket Requirements For OCPCompliant SoC. http://www.ocpip.org/ Tang, S. and Xu, Q. 2008. In-band cross-trigger event transmission for transaction-based debug. In Proceedings of the Conference on Design, Automation and Test in Europe (Munich, Germany, March 10 - 14, 2008). Huh, J., Kim, C., Shafi, H., Zhang, L., Burger, D., and Keckler, S. W. 2005. A NUCA substrate for flexible CMP cache sharing. In Proceedings of the 19th Annual international Conference on Supercomputing (Cambridge, Massachusetts, June 20 - 22, 2005). Savage, S., Burrows, M., Nelson, G., Sobalvarro, P., and Anderson, T. 1997. Eraser: a dynamic data race detector for multi-threaded programs. In Proceedings of the Sixteenth ACM Symposium on Operating Systems Principles (Saint Malo, France, October 05 - 08, 1997). Ronsse, M. and De Bosschere, K. 1999. RecPlay: a fully integrated practical record/replay system. ACM Trans. Comput. Syst. vol.17, no. 2, 133-152, (May. 1999). Nethercote, N. and Seward, J. 2007. Valgrind: a framework for heavyweight dynamic binary instrumentation. In Proceedings of the 2007 ACM SIGPLAN Conference on Programming Language Design and Implementation (San Diego, California, USA, June 10 - 13, 2007). Xu, M., Bodik, R., and Hill, M. D. 2003. A "flight data recorder" for enabling full-system multiprocessor deterministic replay. In Proceedings of the 30th Annual international Symposium on Computer Architecture (San Diego, California, June 09 - 11, 2003). Hower, D. R. and Hill, M. D. 2008. Rerun: Exploiting Episodes for Lightweight Memory Race Recording. In Proceedings of the 35th international Symposium on Computer Architecture (June 21 - 25, 2008). Zhou, P., Teodorescu, R., and Zhou, Y. 2007. HARD: Hardware-Assisted Lockset-based Race Detection, In Proceedings of the International Symposium on High Performance Computer Architecture (HPCA), 121-132, 2007. ARM CoreSight On-chip Debug and Real-time Trace http://www.arm.com/ Nguyen, A.-T., Michael, M., Sharma, A., and Torrellas, J. 1996. The Augmint multiprocessor simulation toolkit for Intel x86 architectures. In proceedings of Computer Design: VLSI in Computers and Processors, (Oct 7-9, 1996) Woo, S. C., Ohara, M., Torrie, E., Singh, J. P., and Gupta, A. 1995. The SPLASH-2 programs: characterization and methodological considerations. In Proceedings of the 22nd Annual international Symposium on Computer Architecture (S. Margherita Ligure, Italy, June 22 - 24, 1995). CACTI: An Integrated Cache Timing, Power, and Area Model http://www.ece.ubc.ca/~stevew/cacti/
153 Authorized licensed use limited to: National Sun Yat Sen University. Downloaded on October 30, 2009 at 01:39 from IEEE Xplore. Restrictions apply.