Published in Attention and Performance in Computational Vision (In: Lecture Notes in Computer Science) 3368, 183-195, 2005 which should be used for any reference to this work
1
A Visual Attention-based Approach for Automatic Landmark Selection and Recognition Nabil Ouerhani1 , Heinz H¨ ugli1 , Gabriel Gruener2 , and Alain Codourey2 1
2
Institute of Microtechnology University of Neuchˆ atel Rue A.-L. Breguet 2 CH-2000 Neuchˆ atel, Switzerland
[email protected] Centre Suisse d’Electronique et Microtechnique CSEM, Microrobotics Division Untere Gr¨ undlistrasse 1 CH-6055 Alpnach Dorf, Switzerland
[email protected]
Abstract. Visual attention refers to the ability of a vision system to rapidly detect visually salient locations in a given scene. On the other hand, the selection of robust visual landmarks of an environment represents a cornerstone of reliable vision-based robot navigation systems. Indeed, can salient scene locations provided by visual attention be useful for robot navigation? This work investigates the potential and effectiveness of the visual attention mechanism to provide pre-attentive scene information to a robot navigation system. The basic idea is to detect and track the salient locations, or spots of attention by building trajectories that memorize the spatial and temporal evolution of these spots. Then, a persistency test, which is based on the examination of the lengths of built trajectories, allows the selection of good environment landmarks. The selected landmarks can be used for feature-based localization and mapping systems which helps mobile robot to accomplish navigation tasks.
1
Introduction
Visual attention is the natural ability of the human visual system to quickly select within a given scene specific parts deemed important or salient by the observer. In computer vision, a similar visual attention mechanism designates the first low-level processing step that allows to quickly selecting in a scene the points of interest to be analyzed more specifically and in-depth in a second processing step. The computational modeling of visual attention has been a key issue in artificial vision during the last two decades [1–3]. First reported in 1985 [4], the saliency-based model of visual attention is largely accepted today [5] and gave rise to numerous soft and hardware implementations [5, 6]. In addition, this model has been used in several computer vision applications including image compression [7] and color image segmentation [8].
2
Visual attention algorithms
In visual robot navigation, the detection, tracking, and selection of robust visual landmarks represent the most challenging issues in building reliable navigation systems [9, 10]. Numerous previous works have pointed to the visual attention paradigm in solving various issues in active vision in general [11, 12] and visual robot navigation in particular [13]. This work proposes a visual attention-based approach for visual landmark selection. The proposed approach relies on an extended version of Itti’s et al. model of visual attention [5] in order to detect the most visually salient scene locations; the spots of attention. More specifically, these spots of attention are deduced from a saliency map computed from multiple visual cues including corner features. Then, the spots of attention are characterized using a feature vector that represents the contribution of each considered feature to the final saliency of the spot. Once characterized, the spots of attention are easily tracked over time using a simple tracking method that is based on feature matching. The tracking results reveal the persistency and thus the robustness of the spots, leading to a reliable criterium for the selection of the landmarks.
Spot detection
Spot characterization
Spot tracking
Persistency test
Learning phase
Visual servoing
Landmark matching
Visual landmarks
Navigation phase Spot detection
Spot characterization
Fig. 1. Overview of the attention-based landmark selection approach.
The navigation phase, which has not been fully tested yet consists in using the selected environment landmarks for feature-based Simultaneous Localization and Mapping (SLAM) on a mobile robot [14]. A schematic overview of the landmark selection approach as well as its integration into a general visual robot navigation system are given in Figure 1. The remainder of this paper is organized as follows. Section 2 describes the saliency-based model of visual attention. Section 3 presents the characterization and tracking of spots of attention. The persistency test procedure that allows the selection and the representation of the landmarks is exposed in Section 4. In Section 5, a landmark recognition method is described. Section 6 reports some
3
experiments carried out on real robot navigation image sequences in order to assess the approach proposed in this paper. Finally, the conclusions and some perspectives are stated in Section 7.
2 2.1
Attention-based landmark detection Saliency-based model of visual attention
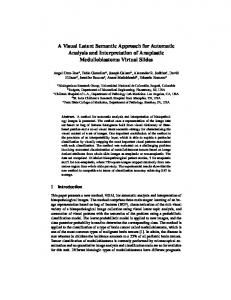
The saliency-based model of visual attention, which selects the most salient parts of a scene, is composed of four main steps [4, 5]. 1) First, a number of features are extracted from the scene by computing the so called feature maps Fj . The features most used in previous works are intensity, color, and orientation. The use of these features is motivated by psychophysical studies on primate visual systems. In particular, the authors of the model used two chromatic features that are inspired from human vision, namely the two opponent colors red/green (RG) and blue/yellow (BY ). 2) In a second step, each feature map Fj is transformed in its conspicuity map Cj . Each conspicuity map highlights the parts of the scene that strongly differ, according to a specific feature, from its surrounding. This is usually achieved by using a center-surround-mechanism which can be implemented with multiscale difference-of-Gaussian-filters. It is noteworthy that this kind of filters have been used by D. Lowe for extracting robust and scale-invariant features (SIFT) from grey-scale images for object recognition, stereo matching but also for robot navigation [10, 15]. 3) In the third stage of the attention model, the conspicuity maps are integrated together, in a competitive way, into a saliency map S in accordance with equation 1. J X S= N (Cj ) (1) j=1
where N () is a normalization operator that promotes conspicuity maps in which a small number of strong peaks of activity are present and demotes maps that contain numerous comparable peak responses [5]. 4) Finally the most salient parts of the scene are derived from the saliency map by selecting the most active locations of that map. A Winner-Take-All network (WTA) is often used to implement this step [4]. 2.2
Extension of the model to corner features
In the context of vision-based robot navigation, corner features are considered as highly significant landmark candidates in the navigation environment [9, 16]. This section aims at extending the basic model of visual attention to consider also corner features. To do so, a corner map Cc which highlights the corner points in the scene, is first computed. Then, this corner map is combined together with the color and intensity-based conspicuity maps into the final saliency map.
4
(a) Original image
(b) Intensity conspicuity map
(c) RG conspicuity map
(d) BY conspicuity map
(e) Corner conspicuity map
(f) Saliency map
(g) Spots of attention
Fig. 2. Example of the Conspicuity maps, the saliency map and the corresponding spots of attention computed with the corner-extended model of visual attention.
5
Multi-scale Harris corner detector [17, 18]. Practically, the proposed multiscale method computes a corner pyramid Pc . Each level of the corner pyramid detects corner points at a different scale. Formally, Pc is defined according to Equation 2. Pc (i) = Harris(Pg (i)) (2) where Harris(.) is the Harris corner detector as defined in [17] and Pg is a gaussian pyramid defined as follows [19]: Pg (0) =¶³ I Pg (i) = ↓ 2 (Pg (i − 1) ∗ G) (3) µ´ ¶³ where I is a grey-scale version of the input image, G is a gaussian filter and ↓ 2 refers to the down-sampling (by 2) operator. µ´ Corner conspicuity map Cc . Given the corner pyramid Pc , Cc is computed in accordance with Equation 4. Cc =
sX max
Pc (s)
(4)
s=1
Note that the summation of the multiscale corner maps Pc (s) is achieved at the coarsest resolution. Maps of finer resolutions are lowpass filtered and downsampled to the required resolution. In our implementation smax is set to 4, in order to get a corner conspicuity map Cc that has the same resolution as the color- and intensity-related conspicuity maps. Integration of corner feature into the model. The final saliency map S of the extended model is computed in accordance with Equation 5. S=
J+1 X
N (Cj )
(5)
j=1
where CJ+1 = Cc
(6)
Selection of the spots of attention. The maxima of the saliency map represent the most salient spots of attention. Once a spot is selected, a region around its location is inhibited in order to allow the next most salient spot to be selected. The total number of spots of attention can be either set interactively or automatically determined by the activity of the saliency map. For simplicity, the number of spots is set to five in our implementation. Figure 2 shows an example of the four conspicuity maps, saliency map and the spots of attention computed by the corner-extended model of visual attention.
3 3.1
Spot Characterization and Tracking Spot characterization
The spots of attention computed by means of the extended model of visual attention locate the scene features to be tracked. In addition to location, each
6
I
RG
BY
Corner
(a) Feature representation
(b) Original image
(c) Saliency map
(d) Characterized spots of attention
Fig. 3. Characterization of spots of attention. The five most salient spots of attention are detected and characterized using four visual features, namely intensity (I), redgreen (RG) and blue-yellow (BY ) color components, and corners.
spot x is also characterized by a feature vector f : f1 f = .. fJ
(7)
where J is the number of the considered features in the attention model and fj refers to the contribution of the feature j to the detection of the spot x. Formally, fj is computed as follows: N (Cj (x)) fj = (8) S(x) PJ Note that j=1 (fj ) = 1. Let N be the number of frames of a sequence and M the number of spots detected per frame, the spots of attention can be formally described as Pm,n = (xm,n , fm,n ), where m ∈ [1..M ], n ∈ [1..N ], xm,n is the spatial location of the spot, and fm,n its characteristic feature vector. Figure 3 illustrates an example of the characterization of spots of attention. 3.2
Spot tracking
The basic idea behind the proposed algorithm is to build a trajectory for each tracked spot of attention. Each point of the trajectory memorizes the spatial and the feature-based information of the tracked spot at a given time. Specifically, given the M spots of attention computed from the first frame, the tracking algorithm starts with creating M initial trajectories, each of which contains one of the M initial spots. The initial spots represent also the head
7
elements of the initial trajectories. A new detected spot Pm,n is either appended to an existing trajectory (and becomes the head of that trajectory) or gives rise to a new trajectory, depending on its similarity with the head elements P h of already existing trajectories as described in Algorithm 1. Note that a spot of attention is assigned to exactly one trajectory (see the parameter marked[] in Algorithm 1) and a trajectory can contain at most one spot from the same frame. In a simple implementation, the condition that a spot Pm,n must fulfil in order to be appended to a trajectory T with a head element P h = (xh , fh ) is given by: Pm,n ∈ T if kxm,n − xh k < ²x & kfm,n − fh k < ²f
(9)
where ²x and ²f can be either determined empirically or learned from a set of image sequences. In the absence of ground-truth data, the evaluation of the tracking algorithm can be achieved interactively. Indeed, a human observer can visually judge the correctness of the trajectories, i.e. if they track the same physical scene constituents. Figure 4 gives some examples of trajectories built from a set of spots of attention using the tracking algorithm described above. In a more advanced version of the tracking algorithm, Kalman filter is expected to enhance the tracking performance. Indeed, in the presence of different sources of information such as images and odometry, Kalman filter becomes an intuitive framework for tracking. In addition, the predictive nature of the filter decreases the probability of feature loss during tracking.
(a) frame 14
(b) frame 33
(c) frame 72
Fig. 4. Examples of trajectories built from a set of spots of attention.
4
Landmark selection and representation
This step of the approach is part of the learning phase and aims at selecting, among all detected spots of attention, the most robust as visual landmarks of the environment. The basic idea is to examine the trajectories built while tracking spots of attention. Specifically, the length of the trajectories reveals the robustness of the detected spots of attention. Thus, during the learning phase
8
the cardinality (Card(T )) of a trajectory directly determines whether the corresponding spots of attention are good landmarks. Thus, a landmark L is created for each trajectory TL that satisfies the described robustness criterium. In addition, the cardinality of the trajectories can be used as measure to compare the performance of different interest points detectors, as stated in Section 6, but also of different tracking approaches.
Algorithm 1 Attention-based object tracking Image sequence I(n) (1..n..N ) Number of detected spots of attention per frame: M Boolean appended Boolean marked[ ] Trajectory set {T } = ∅ for n = 1 .. N do Detect & characterize the M spots of attention Pm,n = (xm,n , fm,n ) for k = 1 .. card({T }) do marked[k] = 0 end for for m = 1 .. M do appended = 0 for k = 1 .. card({T }) do if (marked[k] == 0) then if d(Pm,n , Pkh ) < ε ∗ then append(Pm,n , Tk ) appended = 1 marked[k] = 1 break end if end if end for if (appended == 0) then newT raject(Tcard({T })+1 ) append(Pm,n , Tcard({T })+1 ) {T } = {T } ∪ {Tcard({T })+1 } end if end for end for ∗ d() is given by Equation 9
Once selected, the landmarks should be then represented in an appropriate manner in order to best describe the navigation environment. In this work, two attributes are assigned to each landmark L: spatial attribute and feature-based attribute. Regarding the spatial attribute, the height of the scene constituents is constant since the robot is navigating on flat ground and the camera is fixed on the robot. Thus, the y-coordinate of the selected landmarks is independent of
9
the robot orientation and varies only slightly. Therefore, the y-coordinates yL as well as its maximum variation ∆yL are considered as landmark attributes. For the feature-based attributes, the mean feature vector µL of all spots belonging to the landmark-related trajectory as well as its standard deviation σL are the two attributes assigned to a landmark L. µL and σL are defined in accordance with Equation 10.
X 1 (fm,n ) Card(TL ) m,n|Pm,n ∈TL v u X 1 u σL = t (fm,n − µL )2 Card(TL )
µL =
(10)
m,n|Pm,n ∈TL
To summarize, a landmark L is described by a four component vector (yL , ∆yL , µL , σL )T . Figure 6 shows the landmarks that have been automatically selected and represented from a lab navigation environment.
(a) L1..5
(b) L6..7
(c) L8..9
(d) L10..12
(e) L13..17
(f) L18..20
Fig. 5. The selected landmarks and their attributes computed from sequence 1. The red arrow indicates the increasing index of the landmarks Li .
10
5
Landmark recognition
During navigation, a robot has to detect and identify previously learned landmarks in order to localize itself in the environment. In this work, we propose a landmark recognition method that relies on characterized spot matching similar to the one described in Section 3. Specifically, given a set of landmarks Li (yLi , ∆yL , µLi , σLi )) learned during the exploration phase and a detected spot of attention Pm,n (xm,n , fm,n ) (with xm,n = (xm,n , ym,n )), then the landmarks that correspond to this spot are those Li that satisfy the following criteria: |yLi − ym,n | ≤ k · ∆yL kµLi − fm,n k ≤ k · σLi
&&
(11)
where k is a control parameter for the tolerance/strictness of the matching. Setting k ∈ [1.5 .. 2] leads to satisfying results. Note that our recognition method uses a soft matching scheme, e.i. a spot of attention can be matched to more than one landmark. In future work, we are intending to exploit the spatial relationships between single spots but also between landmarks, in order to remove false matchings. For instance, the spatial order constraints of landmarks presented in [20] is a possible solution for this problem.
6
Results
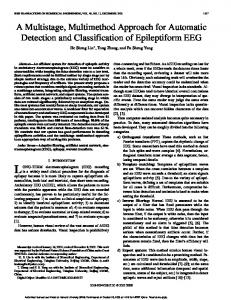
This section presents some experiments that aim at assessing the presented landmark selection approach. The tests have been carried out with four sequences acquired by a camera mounted on a robot that navigates in an indoor environment over a distance of about 10 meters (see Figure 3). The length of the sequences varies between 60 and 83 frames. Two groups of results are presented here. Qualitative results regarding the robustness of the detection and tracking algorithms and quantitative results that point to the superiority of the cornerextended model of attention over the classic one. Regarding the first group of results, Figure 6 illustrates the trajectories built from each sequence. The trajectories are plotted in 3D (x, y, t) in order to better visualize their temporal extent. In the first sequence (Figure 6(a)), the most robustly detected and tracked landmark is the entrance of the differently illuminated room toward which the robot is moving. The trajectory built around this landmark has a length of 83, which means that the spot has been detected in each frame of the sequence. In addition, the red-colored door frames (especially their corners) and a fire extinguisher have been tracked over a large number of frames. Ceiling lights figure also between the detected and tracked features. Like the first example, the three others ((b) light switched off, (c) front door closed, and (d) other corridor) tend to show, qualitatively, the ability of the proposed approach to robustly detect and track certain visual features of the
11
navigation environment over a large period of time and under different conditions. For instance, the door frames and the fire extinguisher figure among those features that can be considered as environment landmarks. A more quantitative and in-depth evaluation of the robustness of the proposed approach towards view angle changes and changing in lighting conditions is required, in order to definitely validate our landmark selection method. Table 1, which resumes the second group of results, shows the advantage of the corner-extended model over the basic model regarding the stability of the detected spots of attention over time. For each of the four image sequences the total number of trajectories, their minimum, maximum, and mean cardinality (length) are represented. It can be seen that the integration of the corner features has leaded to more consistent trajectories.
7
Conclusions and future work
This work presents an attention-based approach for selecting visual landmarks in a robot navigation environment. An extended version of the saliency-based model of visual attention that considers also corners has been used to extract spatial and feature-based information about the most visually salient locations of a scene. These locations are then tracked over time. Finally, the most robustly tracked locations are selected as environment landmarks. One of the advantages of this approach is the use of a multi-featured visual input, which allows to cope with navigation environments of different natures, while preserving, thanks to the feature competition, a discriminative characterization of the potential landmarks. Qualitative results show the ability of the method to select good environment landmarks, whereas the quantitative results confirm the superiority of the corner-extended model of attention over the classic one, regarding the consistency of the detected spots of attention over time. In future work, the rather simple tracking algorithm will be improved, essentially by introducing predictive filters such as Kalman and particle filters [21]. A quantitative evaluation of the landmark recognition method is one of the next steps to be done. In addition, we are planning to apply the proposed approach to solve some problems related to Simultaneous Localization and Map building (SLAM) in real robot navigation tasks.
References 1. B. Julesz and J. Bergen. Textons, the fundamental elements in preattentive vision and perception of textures. Bell System Technical Journal, Vol. 62, No. 6, pp. 1619-1645, 1983. 2. J.M. Wolfe. Guided search 2.0: A revised model of visual search. Psychonomic Bulletin & Review, Vol. 1, pp. 202-238, 1994. 3. J.K. Tsotsos, S.M. Culhane, W.Y.K. Wai, Y.H. Lai, N. Davis, and F. Nuflo. Modeling visual attention via selective tuning. Artificial Intelligence, Vol. 78, pp. 507545, 1995.
12
Seq1 Seq2 Seq3 Seq4
number of spots number of trajectories Min / Max(Card(T )) Mean(Card(T )) no Harris Harris no Harris Harris no Harris Harris 415 88 58 1 / 68 1 / 83 4.7 7.1 320 136 80 1 / 19 1 / 56 2.3 4.0 385 130 61 1 / 22 1 / 48 2.9 6.5 280 123 56 1 / 22 1 / 31 2.2 5.0
Table 1. Impact of the integration of Harris corner features on the tracking algorithm. The total number of trajectories, the minimum, maximum, and mean cardinality of trajectories are computed for the classical (without Harris) and the corner-extended (with Harris) models.
y
y
0 100 200 300 400 500
0 100 200 300 400 500 600 500 400 0 10 300 20 30 x 200 40 50 100 60 70 frames 80 90 0
(a) Trajectories of sequence 1
600 500 400 0 10 300 20 30 x 200 40 50 100 60 70 frames 80 90 0
(b) Trajectories of sequence 2 (light switched off)
y 0 100 200 300 400 500
y 0 100 200 300 400 500
600 500 400 0 10 300 20 30 x 200 40 50 100 60 70 frames 80 90 0
(c) Trajectories of sequence 3 (opposite door closed)
600 500 400 0 10 300 20 30 x 200 40 50 100 60 70 frames 80 90 0
(d) Trajectories of sequence 4 (other corridor)
Fig. 6. Trajectories of the tracked spots of attention from four different sequences ((a)..(d)). Note that only trajectories with Card(T ) > 3 are represented here.
13
4. Ch. Koch and S. Ullman. Shifts in selective visual attention: Towards the underlying neural circuitry. Human Neurobiology, Vol. 4, pp. 219-227, 1985. 5. L. Itti, Ch. Koch, and E. Niebur. A model of saliency-based visual attention for rapid scene analysis. IEEE Transactions on Pattern Analysis and Machine Intelligence (PAMI), Vol. 20, No. 11, pp. 1254-1259, 1998. 6. N. Ouerhani and H. Hugli. Real-time visual attention on a massively parallel SIMD architecture. International Journal of Real Time Imaging, Vol. 9, No. 3, pp. 189-196, 2003. 7. N. Ouerhani, J. Bracamonte, H. Hugli, M. Ansorge, and F. Pellandini. Adaptive color image compression based on visual attention. International Conference on Image Analysis and Processing (ICIAP’01), IEEE Computer Society Press, pp. 416-421, 2001. 8. N. Ouerhani and H. Hugli. Maps: Multiscale attention-based presegmentation of color images. 4th International Conference on Scale-Space theories in Computer Vision, Springer Verlag, Lecture Notes in Computer Science (LNCS), Vol. 2695, pp. 537-549, 2003. 9. A.J. Davison. Mobile Robot Navigation Using Active Vision. PhD thesis, University of Oxford, UK, 1999. 10. S. Se, D. Lowe, and J. Little. Global localization using distinctive visual features. International Conference on Intelligent Robots and Systems, IROS, pp. 226-231, 2002. 11. J.J. Clark and N.J. Ferrier. Control of visual attention in mobile robots. IEEE Conference on Robotics and Automation, pp. 826-831, 1989. 12. K. Brunnstrom, J.O. Eklundh, and T. Uhlin. Active fixation for scene exploration. International Journal of Computer Vision, Vol. 17, pp. 137-162, 1994. 13. L. Itti. Toward highly capable neuromorphic autonomous robots: beobots. SPIE 47 Annual International Symposium on Optical Science and Technology, Vol. 4787, pp. 37-45, 2002. 14. M.W.M. Dissanayakeand Gamini, P. Newman, S. Clark, H.F. Durrant-Whyte, and M. Csorba. A solution to the simultaneous localization and map building (slam) problem. IEEE Transactions on Robotics and Automation, Vol. 17, pp. 229-241, 2001. 15. D. Lowe. Distinctive image features from scale-invariant keypoints. International Journal of Computer Vision, Vol. 60 (2), pp. 91-110, 2004. 16. A.A. Argyros, C. Bekris, and S. Orphanoudakis. Robot homing based on corner tracking in a sequence of panoramic images. Computer Vision and Pattern Recognition Conference (CVPR), pp. 11-13, 2001. 17. C.G. Harris and M. Stephens. A combined corner and edge detector. Fourth Alvey Vision Conference, pp. 147-151, 1988. 18. K. Mikolajczyk and C. Schmid. An affine invariant interest point detector. European Conference on Computer Vision (ECCV), Vol.1, pp. 128-142, 2002. 19. P.J. Burt and E.H. Adelson. The laplacian pyramid as a compact image code. IEEE Transactions on Communication Vol. 31 (4) pp. 532-540, 1983. 20. A. Tapus, N. Tomatis, and R. Siegwart. Topological global localization and mapping with fingerprint and uncertainty. International Symposium on Experimental Robotics, 2004. 21. D. Fox, S. Thrun, F. Dellaert, and W. Burgard. Particle filters for mobile robot localization. In A. Doucet, N. de Freitas, and N. Gordon, editors, Sequential Monte-Carlo Methods in Practice. Springer-Verlag, New York, 2000.