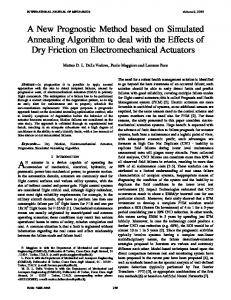
IOP Conference Series: Materials Science and Engineering
PAPER • OPEN ACCESS
A weighted method based on Lars algorithm To cite this article: Lin Chen et al 2017 IOP Conf. Ser.: Mater. Sci. Eng. 242 012110
View the article online for updates and enhancements.
This content was downloaded from IP address 191.101.95.15 on 28/09/2017 at 13:35
ICAMMT 2017 IOP Publishing IOP Conf. Series: Materials Science and Engineering 242 (2017) 012110 doi:10.1088/1757-899X/242/1/012110 1234567890
A weighted method based on Lars algorithm Lin Chen1, a), Shanxiong Chen2, b), Chunrong Chen3, c) and Yuchen Zhu3, c) 1,2,3
College of Computer & Information Science in Southwest University, Chongqing, China. a)
[email protected] b)Corresponding author:
[email protected] c)
[email protected] and
[email protected]
Abstract: LASSO (Least Absolute Shrinkage and Selection Operator) is mainly used to realize variable selection, simultaneously its algorithm and some improved algorithm have gotten wide attention in many fields. To improve the accuracy of LASSO problem in calculating regression coefficients, this paper proposes a new algorithm based on LASR (Least Angle Regression) algorithm to change its approximation direction, which uses two weighted method (coefficient of variation method or entropy weight method) to calculate the weight of linear relationship between the independent and the dependent variables, so we can calculate a regression coefficients set of linear regression model. Compared with LARS algorithm, it can be proved that the improved algorithm mentioned in this paper has a more precise ability for prediction.
1 Introduction Linear model plays a significant role in modern statistics and has been wildly used in various fields [1]. The values of variable selection and regression parameter are helpful to get a precise prediction. To decrease the deviation, we often choose plenty of independent variables into the model but a number of them exhibits little correlation or even no correlation with dependent variables, which decreases the precision of prediction [2]. Hence, it’s indispensable to search out the set of independent variables related closely to dependent ones. Robert Tibshirani proposed a method used to describe series of constrained optimization problems, called LASSO, which can make regression coefficients towards the minimum [3]. LASSO problem can improve the rationality of the model and realize variable selection simultaneously. Efron[6] proposed ‘Least Angle Regression’ to resolve LASSO problem, making use of correlation coefficient of current residuals and current variables to determine a new algorithm path. We propose an improved method based on LARS algorithm in this paper. The key point of the algorithm is that using weighted algorithm to change the approximation direction and to improve the precision. Moreover, the experimental result indicates which method gets more precise performance: The effects on dependent variables change from sample to sample. Therefore, according to the different importance of each independent variable, we propose improved method based on LARS to change the approximation angle to direct the independent one with higher weight coefficient instead of angular bisector; By the experiments compared with original LARS algorithm, the weighted LARS algorithm was proved with more precise regression coefficient estimation as well as the results prediction. Content from this work may be used under the terms of the Creative Commons Attribution 3.0 licence. Any further distribution of this work must maintain attribution to the author(s) and the title of the work, journal citation and DOI. Published under licence by IOP Publishing Ltd 1
ICAMMT 2017 IOP Publishing IOP Conf. Series: Materials Science and Engineering 242 (2017) 012110 doi:10.1088/1757-899X/242/1/012110 1234567890
2 Lasso and lars algorithm 2.1 The LASSO Problem n Suppose that we have data xi R , i 1, 2, , m , y Rn who are considered to be the predictor variables and responses corresponding for the i th observation. As the linear regression problem set up: ( 错误!文档中没有指定样 式的文字。-1 )
y X
Where y is an observation vector of n*1, and X is a n p full column rank matrix. Through the linear regression model, the constraint which is less than threshold t is applied to the norm 1 of regression coefficient , the Lasso estimate is defined as [5]: 2 ( y i j xij ) , s.t . j ˆ , ˆ arg min i i j
where ˆ1 , , ˆ p
T
t
( 错误!文档中 没有指定样式 的文字。-2 )
, and t controls the amount of regression coefficients to the minimum. With the
limit of Jj 1 ˆ j t , the regression coefficient shrinkage towards 0 or even to be exactly equal to 0. Insight about the coefficients of the shrinkage can be gleaned from the orthonormal design case. X is a n p design matrix with X T X I (unit matrix). Hence the solutions to the LASSO can be shown to be: 0
0
ˆ j sign( ˆ j )(| ˆ j | )
( 错误!文档中没有指定样 式的文字。-3 )
where is determined by the condition ˆ j t . 2.2 LARS Algorithm All coefficients start as 0, and find the predictor xj1 who has largest correlation with the response. Then take the largest step in the direction of selected predictor until the next predictor xj2 has same correlation with the current residual. At this point LARS proceeds in equiangular direction of xj1 and xj2 , repeat this step until the residual y y y is equal to 0 or the predictors is xjk
[4]
.
[6]
After k steps, there are k predictor variables selected, the set can be defined as : A j1 , , jk 1, 2,, m
( 错误!文档中没有指定样 式的文字。-4 )
As well as obtaining the k-1 th regression variable, define the matrix: ( 错误!文档中没有指定样 n k X A s j1 x j1 , , s jk x jk R 式的文字。-5 ) where the S j sign((Y k 1 )' X j ) is described as the set of approximation direction, so the
2
ICAMMT 2017 IOP Publishing IOP Conf. Series: Materials Science and Engineering 242 (2017) 012110 doi:10.1088/1757-899X/242/1/012110 1234567890
equiangular direction of next step can be defined as: 1
wA AAGA 1A , uA X AwA
which defines GA X TA X A
1
AA (1A GA 1A ) T
12
( 错误!文档中没有指定样 式的文字。-6 )
. 1 is a column vector of k-dimension and all of its A
elements are 1. Suppose that uA is the vector of current correlations between selected predictors and selecting predictor to update the next step. The LASSO can make up the deficiency on variables selection, and LARS algorithm can get more precise variable section and resolve LASSO problem. However, owning to singleness of approximation angle, there may be a bigger error than expected. 3 A weighted method on the basis of Lars 3.1 The Basic Concepts of Improved Method We’ve explained that LARS algorithm proceeds in a direction equiangular. However, each predictor reflects the different importance in the data set. For this main point, we can propose a new algorithm to make the approximation direction to slant the predictor variable who has higher weighted coefficient. The approximation direction of LARS algorithm mentioned by Efron[7] is: 1 if x jl , y 0 ( 错误!文档中没有指定样 s jl 0 if x jl , y 0 式的文字。-7 ) 1 if x , y 0 jl
xj, y
is considered as the correlation coefficient of predictor variables and responses. s jl can
change vector approximation direction according to the value of x j , y . To change the approximation direction based on weighted method, we define:
r (if x jl , y 0) S jl 0 (if x jl , y 0) r (if x jl , y 0)
( 错误!文档中没有指定样 式的文字。-8 )
where r j is the weight coefficient of each predictor variable in the data set. LARS selects those independent variables just with sufficiently large value and proceeds in a direction equiangular. On the basis of LARS, with the different weight coefficient of each independent variable in the data set X A , we can multiply corresponding weight coefficient to make approximation vector change. Through computation of weighting, we can obtain the index vector set of the data set X [ w j s jk x jk ] , and calculate the corresponding vector approximation length according to weight coefficients, finally, we can resolve LASSO. The example of independent variables x1 , x2 is served for illustrating in Fig.3.1. Assume that the weight coefficients of two independent variables are 1 、 2 , the x1 , y is bigger than zero, and x2 , y is smaller than zero. is approximation direction of LARS algorithm, while 1 is the new approximation direction of weighted method. The direction of vector
3
y is
required to be targeted.
ICAMMT 2017 IOP Publishing IOP Conf. Series: Materials Science and Engineering 242 (2017) 012110 doi:10.1088/1757-899X/242/1/012110 1234567890
Figure 3.1 Geometric Graph of Weighted Method In a word, the central part of proposed method is to calculate the weight of each independent variable related to dependent variable, also called weight coefficient. 3.2 Weighted Calculation 3.2.1 Coefficient of Variation Method. Calculate the mean and sample standard deviation of the data set, then calculate coefficient of variation, says CV here [8]; after that we can obtain the weight of each predictor variable by normalization processing. s ( 错误!文档中没有指定样 CV t xt 式的文字。-9 ) 3.2.2 Entropy Weight Method. 1)Calculate the information entropy Suppose that the system may be in K different indicators and the probability of each one to appear is Pi ( 1, 2, , m ) ; when pi 1/ m(i 1, 2, m) , namely when the probability of each one to appear is equal, the entropy of the system E and the maximum entropy emax are [9]: m ( 错误!文档中没有指定样 E pi ln pi , emax ln m i 1 式的文字。-10 ) If there are m items waited for evaluation and n evaluation indicators, the original evaluation matrix is R (rij )mn and the information entropy of indicators is m m ( 错误!文档中没有指定样 e j pij ln pij ,where pij rij / rij i 1 i 1 式的文字。-11 ) 2) Obtain the entropy of each indicator Calculate the information entropy of each indicators ( E1 , E2 , , Ek ), and the formula is defined: 1 Ei ( 错误!文档中没有指定样 Wi (i 1, 2, , k ) k Ei 式的文字。-12 ) 3.3 Algorithm Flows Input: the set of predictors X,the set of responses Y; Output: regression coefficientsβ; I.
data processing: X and Y normalization;
II. initialization:
A
, the amount of looping k 0 ,
III. approximation direction A 0 , residual yˆ y ;
4
ICAMMT 2017 IOP Publishing IOP Conf. Series: Materials Science and Engineering 242 (2017) 012110 doi:10.1088/1757-899X/242/1/012110 1234567890
IV. calculating the weight coefficient: w j V.
st x
( j A) or w j
1 Ej k Ej
( j A) ;
X [ w j s jk x jk ] ,where j A and s j sign cˆ j ;
VI. a X T uA C c j C c j , VII. ˆ min jA AA a j AA a j
VIII.
k k 1 ,add with a new predictor,repeat the process steps 3~7;
IX. Obtain the regression coefficients β;
4 Experimental analysis 4.1 Experiment Data Processing All requisite experiments in this paper are implemented in MATLAB. The experimental data [10] can be derived from the research which German credit classifies people as good or bad credit risks. The dataset contains 20 attribute information which can proof of his financial ability. The last column predictive classifications can be in two states, 0 or 1, namely reliable or unreliable customer. The half of dataset is used to calculate regression coefficients, the rest of dataset is used to judge if this algorithm can get precise prediction based on obtained regression coefficients. For the four prediction possibilities we can analyze them with ROC curves [11]: True positive (TP): the prediction is reliable customer, yet the fact is also reliable; False positive (FP): the prediction is unreliable customer, while the fact is reliable; True negative (TN): the prediction is unreliable customer, yet the fact is also unreliable; False negative (FN): the prediction is reliable customer, while the fact is reliable. 4.2 The Comparison between LARS Algorithm and Improved Algorithm Use MATLAB to run LARS algorithm and then add improved algorithm on the basis of LARS. Each measure of two algorithms are as follows:
Figure 4.1 NPV and TPR of LARS Algorithm
Figure 4.2 NPV and TPR of Coefficient of Variation Method
5
ICAMMT 2017 IOP Publishing IOP Conf. Series: Materials Science and Engineering 242 (2017) 012110 doi:10.1088/1757-899X/242/1/012110 1234567890
Figure 4.4 FPR and PPV of Entropy Weight Method ( A C C ( T P T N ) / ( P N )) . In our experiment, Along with illustrations, accuracy rate is defined as the higher ACC is, the greater the ability of predicted positive condition is; True positive rate ( TPR TP / TP FN ), in our experiment, it indicates the ratio of the number of true positive to all conditions positive. The higher value means the reliable positive condition detection. Negative predictive value ( NPV TN / (TN FN )) and Positive predictive value ( PPV TP / (TP FP )) , the higher value indicates the greater result of negative/ positive condition detection; and False positive rate ( FPR FP / ( FP TN )) The lower FPR means the less the misjudged condition . It is illustrated that these indexes of the improved algorithm have improved based on LARS algorithm. It is concluded from the comparison of figure 4.1 and figure 4.2 that compared with LARS algorithm, the improved algorithm based on coefficient of variation method improves several indexes. The true positive rate was increased by 10% and negative predictive value 2.8%; while comparing from figure 4.3 and figure 4.4, the false positive rate of improved algorithm based on entropy weight method was lowered by 4% and the positive predictive value was increased by 6.4%. As for the experimental data, it is worse to predict false positive than to predict false negative. So the change of these indexes corresponds with what we have expected. Furthermore, the ability of prediction is improved by two improved algorithm. Figure 4.3 FPR and PPV of LARS Algorithm
5 Conclusion LASSO is a method for variables selection in linear models. LARS algorithm resolves LASSO problem by proceeding in a direction equiangular of selected independent variables. The weighted method is introduced into LARS algorithm to change the approximation direction. The key to achieve this objective lies in that each independent variable has various effect on the dependent variables in linear model. We distinguish the impact of various predictors on responses by the design of algorithm weighting for the basis of LARS algorithm, which means the more precise prediction. Compared LARS algorithm with improved algorithm, the experimental verification shows that it is more effective to combine the weighted method and LARS algorithm. However, the false negative rate has no significant effect during experimental process. So the precision of variables selection and the calculation of regression coefficients are worthy to explore in the further study. References [1] Liu Liu, Dacheng Tao. Review on Recent Method of Solving Lasso Problem[J]. Journal of Data Acquisition and Processing. 2015(1). [2] Wei Yang, The component selection of functional regression model[D]. Northeast Normal University, 2009. [3] Ke Zhenlin. The optimal property of Lasso and other related methods on multiple linear regression
6
ICAMMT 2017 IOP Publishing IOP Conf. Series: Materials Science and Engineering 242 (2017) 012110 doi:10.1088/1757-899X/242/1/012110 1234567890
model[D]. Master 2011. [4] Efron B,Hastie T,Johnstone I,et a1.Least angle regression[J].Journal of the Institute of Mathematical Statistics,2004,32(2):407—499. [5] Robert Tibshirani. (1996), Regression Shrinkage and Selection via the Lasso. Journal of the Royal Statistical Society. Series B, Vol.58, No.1.267-288. [6] Liu GuoTian, Feng Lin, Ding Xiang. A feature selection algorithm based on LARS[C]. 2012. [7] ZHOU Yanzhou, QIAO Hui.WU Xiao-ping. Research of Software Complexity Metric Attributes Feature Selection Based on LASSO-LARS[J]. Computer Science. 2013(11). [8] Kai Sun, Xiaofeng Ju, Yuhua Li. Performance Evaluation of Enterprise Incubators Based on Variation Coefficient Method [J]. JOURNAL HARBIN UNIV. SCI. & TECH.2007,12(3):165-167. [9] XIE Chi, ZHONG Zan. Entropy Method and Its Application in Comprehensive Evaluation of Bank’s Performance[D]. China Soft Science.2002(9). [10] Professor Dr. Hans Hofmann Institut f"ur Statistik und "Okonometrie Universit"at Hamburg FB Wirtschaftswissenschaften Von-Melle-Park 5 2000 Hamburg 13. [11] https://en.wikipedia.org/wiki/Receiver_operating_characteristic
7