Robust saliency detection algorithms can benefit nu- ..... mall. Therefore, the weight (penalty) Ïi for saliency detec- tion should be inversely ..... Centre for Explo-.
A Weighted Sparse Coding Framework for Saliency Detection
Nianyi Li
Bilin Sun
Jingyi Yu
University of Delaware, Newark, DE, USA. {nianyi,sunbilin,yu}@eecis.udel.edu
Abstract There is an emerging interest on using high-dimensional datasets beyond 2D images in saliency detection. Examples include 3D data based on stereo matching and Kinect sensors and more recently 4D light field data. However, these techniques adopt very different solution frameworks, in both type of features and procedures on using them. In this paper, we present an unified saliency detection framework for handling heterogenous types of input data. Our approach builds dictionaries using data-specific features. Specifically, we first select a group of potential foreground superpixels to build a primitive saliency dictionary. We then prune the outliers in the dictionary and test on the remaining superpixels to iteratively refine the dictionary. Comprehensive experiments show that our approach universally outperforms the state-of-the-art solution on all 2D, 3D and 4D data.
Image(stack)
Ground Truth
DSR
Ours
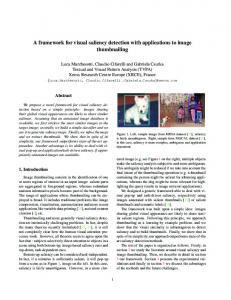
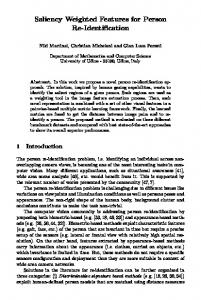
Figure 1. Our method vs. the latest feature-matrix-based DSR algorithm [17] on different data inputs. From top to bottom: we show results on 2D images, 3D stereo data, and 4D light field data.
all-focus image as has been used in traditional approaches. Second, human uses two eyes to infer scene depth, e.g., via stereo, for more reliable saliency detection whereas most existing approaches assume that the depth information is largely unknown. Recently there has been an emerging interest on emulating these the properties of human eyes. For example, light field saliency uses the Lytro camera as the acquisition apparatus and then synthesize a focal stack via light field rendering [15]. The focusness cues are then extracted from the focal stack and integrated with color, location, and contrast cues. Preliminary results seem promising although the image resolution is generally low due to tradeoff between spatial-angular sampling. Several schemes have been proposed to incorporate stereo vision. Niu et al.[20] employed the disparity maps to better extract better foreground/background separations. Lang et al.[14] used the Kinect sensor to acquire scene depth and integrate the results with regular 2D saliency via a Gaussian mixture model. Despite their effectiveness, saliency detection algorithms based on 2D, 3D and 4D data have adopted completely different frameworks. In particular, the features used for distinguishing saliency candidates and more importantly the
1. Introduction Human visual system can rapidly identify salient objects that mostly attract attention in a 3D scene. In computer vision, the similar task of visual saliency aims to detect salient regions from 2D, 3D, and most recently 4D imagery data. Robust saliency detection algorithms can benefit numerous vision and graphics tasks, ranging from automatic image cropping[26], to image thumbnailing[27], and to image/video compressing[4] and retargeting[25]. At the core of the problem is to develop an effective feature contrast measure to separate salient objects from the background and tremendous efforts have been focused on extract color, texture, depth, and focusness cues from 2D images. Existing 2D saliency algorithms, however, are inherently different from how human visual system detects saliency. Human eyes have two unique properties that are largely missing in existing 2D saliency solutions. First, human eye can conduct dynamic refocusing that enables rapid sweeping over different depth layers. Hence, for humans, the input is a focal stack instead of a single, fixed-focus or 1
reference image 2D color texture focusness 3D depth 4D focusmap stack
saliency map by reconstrucion
superpxiel
[
[
[
[
[
[
[
[
[
FA feature extraction
feature matrix
FH
[
saliency map
saliency dictionary
iteratively weighted sparse coding
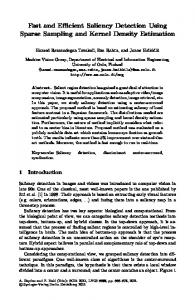
Figure 2. Processing pipeline of our dictionary-based saliency detection algorithm.
procedures for utilizing them differ significantly. In this paper, we present a universal saliency detection framework for handling heterogenous types of input data. We set out to build saliency/non-saliency dictionaries using data-specific features. Specifically, we first select a group of potential foreground superpixels to build the saliency dictionary. We then prune the outliers and test on the remaining super-pixels to iteratively refine the dictionaries. A major advantage of our technique is that it provides a universal framework for all different types. The only variation to the algorithm is input features: for 2D images, we use color, texture and focusness characteristics; for stereo data, we add depth/disparity cues; and for the 4D light field data, we add focusness cues on focus stack. Comprehensive experiments on a broad range of datasets (MSRA-1000 [18] and SOD [19] for 2D, SSB [20] for 3D, and the light field saliency dataset[16] for 4D) show that our technique outperforms state-of-the-art solutions.
2. Related Work The literature of saliency detection is huge and we only discuss the most relevant ones. For a comprehensive survey state-of-the-art algorithms, we refer the readers to [3]. 2D saliency. Human vision system is particularly sensitive to high-contrast stimulus [9, 21, 24] and traditional approaches have focused on applying this model to 2D images. Most contrast-based methods measure saliency by feature (color, texture,gradient, shape, etc.) difference between pixels/superpixels. The performance of 2D imagebased techniques depend highly on the choice of feature descriptors. For example, if the color difference between foreground and background is small, methods based on color feature descriptors can lead to poor performance. To address this issue, recent algorithms incorporate high-level reasoning into the solution framework. For example, additional cues that emulate human vision systems such as focusness, objectness, location of specific types of object (e.g., faces) [11, 22, 29] have been added onto the feature descriptor.
3D saliency. More recent approaches acknowledge that 2D images do not completely represent how human eyes perceive the world [20, 14]. In particular, depth perception provided by two eyes has been largely ignored in saliency detection. Therefore, several new approaches have been proposed to incorporate 3D depth information into saliency detection. In [20] work, a disparity map is first inferred from a stereo pair and later used to enhance saliency detection. The results are promising. For example, the depth map can help distinguish foreground from background even if they have similar appearance. One major challenge in those approaches is how to effectively combine traditional features with depth features without modifying the solution framework. 4D saliency. There is also emerging interest on using datasets beyond 3D such as the light field towards the scene [16]. A unique feature of light field is that it enables dynamic refocusing through light field rendering. In [16], the focal stack is used to infer focusness and objectness of superpixels for more reliably selecting the background candidates and foreground saliency candidates. It then integrates other cues based on color and texture contrast. This 4D saliency method eliminates the need of 3D depth maps and shows impressive results on challenging scenarios including similar foreground and background, clustered background, complex occlusions, etc. Nevertheless, the solution framework is significantly different from previous 2D and 3D solutions.
3. Feature Selection Our approach is based on building saliency/non-saliency dictionaries and our approach is generic to 2D, 3D and 4D datasets. The dictionaries are built for superpixels. Regarding different segmentation schemes, we use the widely adopted simple linear iterative clustering (SLIC) algorithm [1] for its high efficiency, compared with other schemes, e.g., mean-shift. We use SLIC to segment the reference image I into a set of small non-overlapping regions/superpixel R = {r1 , r2 , ...rN }. For stereo pair data, the reference image refers to the one used for generate the disparity map. For light field data, the reference is the all-focus image. We use p to index pixel and r to superpixel. The ultimate goal is to assignment each superpixel r a saliency value Sal(r).
3.1. Feature Extraction For each pixel, we set out to associate with a feature vector. A good feature descriptor should exhibit high contrast between saliency objects and background. 2D feature. Color is the most intuitive feature to distinguish two regions. As shown in[2], coupling RGB and Lab color spaces improves the accuracy of saliency maps. Here, we choose both RGB and Lab color spaces as color descriptors. For texture, Gabor filters have been shown as an
Image
RGB-Lab
Color Histogram Combined Features
GT
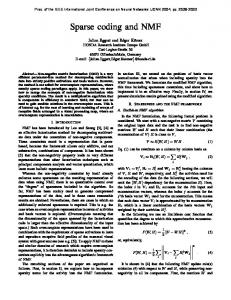
Figure 3. Saliency detection results using our approach on individual and combined feature matrices.
effective measure [6]. When using Gabor filters as orientation and scale tunable edge detectors, we can characterize the intrinsic texture information using the statistics of microfeatures within the superpixel. We use the Gabor filter responses with 12 orientations and 3 scales as texture descriptors. For focusness, we utilize the mean distance to its 8neighbors in the RGB space: σf (p) =
8 1 X δm (p, pm ) 8 m=1
(1)
2 rgb is the color vecwhere δ(p, pm ) = kprgb − prgb m k2 and p tor of p in RGB color space.
3D feature. 3D data further provides depth/disparity information for each points in the scene. In [20], disparity is used as a unique feature to distinguish objects from background. When disparity/depth is available, we directly append it to the features vector. 4D feature. For 4D light field, we can further synthesize a focal stack. We use the in-focus measure at each focal slice to derive an additional light field feature descriptor. For instance, if a focus stack has L different focus slices, we calculate L focusness values σfl (p), l = 1, 2...L by applying Eqn. 1 on each slice. After appending them to the feature vector, we get the stacked vector fp = [σ1 σ2 ...σC ]T of p.
3.2. Feature Matrix From the feature vectors of all pixels, we generate two feature matrices for all super-pixels. Averaging. The simplest approach to convert per-pixel feature vector to per-superpixel feature vector is through averaging [29, 17]. We use the C × N matix F A to represent the result feature matrix. Notice that F A is expected to perform well if the scene is composed of objects with simple color and textures but will be less robust if the foreground and background contain highly complex textures, as shown in Fig. 3. This is because that averaging over all pixels loses information that characterizes color variations within each superpixel.
Color Histogram. To handle textures, our second scheme computes the histogram over three color channels. Specifically, we treat color in terms of ratios G B R , R+G+B , R+G+B } and compute the histogram { R+G+B of the two channels (the third is dependent of the other two). Specifically, we use the R and G channel and we discretize the two channels into 32 × 32 bins for computing the histogram. Consequently the color components of the feature ri vector for a superpixel becomes {σ1ri , σ2ri ...σ1024 }. The other feature components such as focusness and depth remain the same as the averaging scheme. We use the C 0 × N matix F H to represent the resulting feature matrix. Notice that F H is suitable for handling scenarios where the scene contains highly textured objects. However, it is fragile for the textureless cases, which is because that color histogram will introduce inner-region noises when images consist of smooth foreground and background, as shown in Fig. 3. Notice that the two schemes are complementary to each other and we can apply our saliency detection scheme (Section 4) on each matrix and combine the results. Fig. 4 (a) shows some sample results using individual matrices and their combined result.
4. Dictionary Based Saliency Detection From F A and F H , we develop a sparse coding framework: saliency superpixels correspond to the ones that yield to low/high reconstruction error from the saliency/nonsaliency dictionary. Our solution is based on recent studies that show non-saliency regions can be represented by a sparsely coded dictionary [17, 31]. We use the error measure to refine the foreground superpixels and to identify foreground saliency ones. In classical (unweighted) sparse coding scheme [17], the goal is set to find a sparse code αi that can achieve the maximum/minimum reconstruction error. The coefficients should encode the saliency value, if the template D denotes the set of K potential non-saliency/saliency regions respectively: αi = arg minαi kfi − Dαi k22 + λkαi k1
(2)
For saliency detection, we adopt the weighted sparse coding scheme [8]: αi = arg min kfi − Dαi k22 + λkdiag(ωi ) · αi k1 (3) α i
where the jth value of ωi is the penalty for using the jth member in template D to encode fi and we set λ=0.01 in our implementations. Notice that large ωi will suppress nonzero entries αi and force the solution α to concentrate on indices where ωi is small. Therefore, the weight (penalty) ωi for saliency detection should be inversely proportional to the similarity between the feature vector fi and template members D. In
other words, if the fi is similar to some template in D, the penalty ωi should be small and vice versa. Fig. 4(b) shows that, by adding this penalty weight ω into the framework, the performance of saliency detection is significantly improved.
4.1. Weighted Sparse Coding Saliency Fig. 2 shows our framework. Given a set of superpixels S = {r1 , r2 ...rK }, which consists of indices of a certain subset of superpixels, we use their corresponding feature vectors (of superpixels) A = {FrA1 , FrA2 ...FrAK } and H = {FrH1 , FrH2 ...FrHK } to construct two dictionaries. We use ωrAi and ωrHi to represent the weight/penalty for superpixel ri . Here, the template symbol D can be either A or H, i.e., D ∈ {A, H}. ωrDi is a vector that computes the similarity between superpixel ri (in feature matrix F D ) to all the members in template D: ωrDi = [g(ri , D1 ), g(ri , D2 )...g(ri , DK )]T where g(ri , Dj ) computes the similarity between the superpixel ri and the jth member of template D: D
g(ri , Dj ) = ekFri −Dj k
(4)
Next, we use (A, ωrAi ) and (H, ωrHi ) as input to Eqn. 3 to generate to sparsely coded dictionary αrAi and αrHi respecH tively. We then compute the reconstruction error �A ri and �ri for each ri : �D ri
=
kFrDi
−
DαrDi k22
(6)
where SalL (ri ) is the object-bias center prior defined in [17]. Sal∗ (�D ri ) is the saliency function related to the dictionary’s type (saliency or non-saliency). For non-saliency dictionary, it will assign high values to superpixels of a high ∗ D �D ri value. Similarly, for saliency dictionary, Sal (�ri ) will D assign high value to superpixels with low �ri . We define the saliency function for non-saliency dictionary: D Sal∗ (�D (7) ri ) = � ri For saliency dictionary: D
β·�r i Sal∗ (�D ri ) = e
Non-saliency Dictionary. Non-saliency dictionary is the set of superpixels which are tagged as the non-saliency regions. To obtain it, we first extract two sets of superpixel sets B1 , B2 where B1 is the set of superpixels on the reference image boundaries and B2 is the set of superpixels locate in the out-of-focus regions. For 2D, B2 correspond to the ones whose focusness response is lower than the average. For 3D data, B2 correspond to the ones lying far away, i.e., with a small disparity value. For 4D data, we select B2 by detecting the in-focus regions of the farthest away focal slice in the focal stack. Finally, we combine B1 and B2 as the non-saliency set B = {B1 , B2 }. To avoid redundancy, we adopt the recently proposed background measure scheme [32]. In [13], similar superpixels are merged into some larger regions Am = {r1m , r2m , ...rSm }. A boundary connectivity score, which measures the extent of region Am connecting to the boundary, is also assigned to each Am . Con ωA =p m
K Area(Am )
(10)
In our implement, instead of choosing the image boundary to measure the connectivity, we use B to compute the Con connectivity score ωA . Superpixels from the merged rem gion have the same connectivity score, namely ωrCon = j Con ωA , r ∈ A . Superpixels whose connectivity scores are j m m non-zero are selected to form non-saliency dictionary. Saliency Dictionary. After we obtain the non-saliency dictionary, we use the weighted sparse framework described in Section 4.1 to compute a saliency map. For each superpixel ri , we define the parameter weight g(ri , Dj ) as: D
g(ri , Dj ) = ekFri −Dj k + ωrCon i
(11)
We choose superpixels whose saliency values are higher than the mean to construct the initial saliency dictionary S 0 .
4.3. Iterative Refinement (8)
where we set β = −5 in our implementation. Finally, we combine SalA (ri ) and SalH (ri ) to get the saliency value for ri : Sal(ri ) = SalA (ri ) + SalH (ri )
We define saliency dictionary as a set of superpixels S = {rs1 , rs2 , ...rsk } which are regarded as the potential saliency regions and will be refined through our framework. To get the initial saliency dictionary, we use a non-saliency dictionary to reconstruct the reference image, and patches with high reconstruction error are selected saliency dictionary.
(5)
Two saliency value SalA (ri ) and SalH (ri ) are also computed for ri : L SalD (ri ) = Sal∗ (�D ri ) · Sal (ri )
4.2. Dictionary Construction
(9)
We start with using S 0 as input to the weighted sparse framework. At each iteration, we will refine the saliency dictionary using the estimated saliency map. The algorithm terminates when there is no change to the saliency dictionary. The parameter weight g(ri , Dj ) can be computed using Eqn. 4 and the saliency function is computed as Eqn. 8.
1 0.95
0.9
0.9
0.85
0.85
0.8
0.8
0.85
0.9 0.8
0.8
0.7
0.7 0.65
0.55 0.5
0
0.1
0.2
0.3
0.7 0.65
Average+ Histogram (LFSD) Average (LFSD) Histogram (LFSD) Average (SOD) Average+Histogram (SOD) Histogram (SOD)
0.6
0.75
0.6
0.4
Recall (a)
0.5
0.6
0.7
0.7
0.65
0.4
0.45
0.5
0.55
0.5
0.3
0.6
Unweighted (LFSD) Weighted (SOD) Unweighted (SOD)
0.6
0.4
Weighted ) (LFSD)
0.55 0.5 0.35
Precisio
0.75
Precision
0.75
Precision
Precision
1 0.95
0.2
0.6
0.65
0.7
0.75
Recall (b)
0.8
0.85
0.55
0
10
20
30
Number of iterations (c)
40
50
0.2
color (SOD) color + texture (SOD) color + texture + focusness (SOD) color + texture + focusness (SSB) color + texture + focusness + depth (SSB) color + texture (LFSD) color + texture + focus stack (LFSD) 0.3
0.4
0.5
0.6
0.7
0.8
0.9
Recall (d)
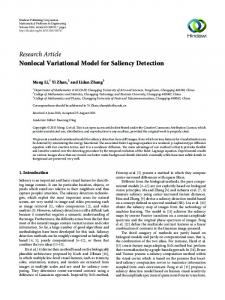
Figure 4. (a) PRC comparisons using our weighted approach with individual and combined feature matrices on the SOD and LFSD datasets; (b) PRC comparisons using weighted and unweighted dictionary frameworks on the SOD and LFSD datasets; (c) Precision improvement with more iterations; (d) PRC comparison using different features.
We use superscript to denote iteration number. At the kth iteration, we first classify each superpixels using the saliency dictionary S k and two template Ak and H k according to their reconstruction errors (Eqn. 3 and Eqn. 5). We then compute two saliency maps as Eqn. 8. Next, we apply a center cue on two maps to make saliency regions more compact. Finally, we sum the two saliency maps with respect to A and H. A new saliency dictionary S k+1 is generated with by using superpixels whose saliency values are higher than the mean. The pseudocode of our iterative refinement is shown in Algorithm 1. Fig. 4 (c) illustrates the change of average precision value of SOD dataset with different step lengths in iterative refinement. We can tell that the algorithm converges within 50 iterations. Notice that we combine two saliency maps to generate the final saliency map, which will cause the ignorable noises on background becoming significant. Hence, we further clamp the low value (< 50) to 0.
5. Experiments We compare our approach with state-of-the-art techniques tailored for specific dimensional data. Parameter Setup. We set the number of superpixels to be 300 in all experiments. Initial backgrounds are extracted from re-clustered segmentation map (re-clustering superpixels) with 2 clustering levels E = 1 for feature matrix using original RGB values and E = 3.5 for feature matrix for RGB color histogram. E is the matching tolerance value (distance threshold). The reason of choosing a smaller E for feature matrix using original RGB values is that RGB is less representative than color histogram. If E is too high, a superpixel of uniform color and a textural superpixel may be incorrectly merged. We also test the robustness of our algorithm to the parameters and to analyze their effect. Regarding different superpixels numbers, ranging from 50 to 500, we found that the results are relatively uniform in precision value. We believe it is because the performance is dominantly affected by the choice of the superpixel’s feature vectors instead of the number of superpixels. Certainly when the number of
superpixels is too small, the salient and non-salient regions will merge and the performance of our approach will ultimatly degrade. Regarding different feature types, we have compared the contribution of individual features to the final performance of our approach on different datasets. We can see from Fig. 4 (d) that the addition of the focusness feature better improves 4D light field data than 2D image data. The discrepancies can be attributed to the characteristics of the datasets: 4D light field data provides a more reliable estimation to focusness. 2D databases. We evaluate the performance of our algorithm vs. DSR [17], GBMR [31], LRMR [29], HS [30], SF [23], GS [28], HDCT[12], ORBD[32] on the MSRA1000 [18] dataset and the SOD [19] database. MSRA1000 database contains 1000 images selected from MSRA5000 with corresponding binary ground truth maps. The SOD database is derived from the Berkeley segmentation database where objects in each image have a consistency score. Objects with high consistency scores are considered salient objects. The SOD database is considered as the most challenge database in saliency detection since the contrast between foreground and background is generally rather small. 3D databases. The PSU Stereo Saliency Benchmark (SSB) contain 1000 pairs of stereoscopic images and corresponding salient object masks for the left images. All the results are evaluated on the left images of SSB. In addition to the above 2D schemes, we compared our results with SS[20], which is tailored for this dataset. Before running our algorithm, we derive the disparity maps for each left image by SIFT-flow[7]. In order to achieve a more fair comparison, we extend the feature matrix of DSR and LRMR to one more dimension to record the depth information before implementing. 4D databases. The recently proposed LFSD database contains 100 scenes, where each scenes’s light field is recorded by Lytro camera. We compare the results of our algorithm with above 2D methods and LFS[16] (designed for this dataset). For 2D algorithms, we use the all-focus
2D
3D
4D
Image
LRMR
GS
HS
DSR
GBMR
HDCT
ORBD
Ours
GT
Figure 5. Visual Comparisons of different saliency detection algorithms vs. ours on 2D (first two rows: MSRA-1000; last two rows: SOD), 3D and 4D datasets.
1
0.8
0.7 0.6
0.7
Precision
Precision
Precision
0.8
0.6 0.5
0.5
0.8 0.9
0.91
0.7
0.8
Precision
0.9 1
0. 9
0.6 0.5 0.4
0.7 0.6 0.5
0.4 0.4
Ours LRMR GS HS DSR
0.3
0.3
0.3 GBMR HDCT ORBD SF
Ours LRMR GS HS DSR
0.2
0.2
GBMR HDCT ORBD SF
0.2
0.1 0
0.1
0.2
0.3
0.4
0.5
0.6
0.7
0.8
0.9
1
0.1
0.2
0.3
0.4
0.5
0.6
0.7
0.8
0.9
1
0.7
GBMR HDCT ORBD SF LFS
0.2 0
0.1
0.2
0.3
Recall Precision Recall F−measure
Ours LRMR GS HS DSR
0.3
0.1 0
Recall 0.8
0.4
GBMR HDCT ORBD SF SS
Ours LRMR GS HS DSR
0.4
0.5
0.6
0.7
0.8
0.9
1
0
0.1
0.2
0.3
Recall
1
Precision Recall F−measure
0.9
0.4
0.5
0.6
0.7
0.8
0.9
1
Recall
0.7
Precision Recall F−measure
0.6 0.8
0.9
Precision Recall F−measure
0.8 0.7
0.6
0.5
0.7
0.6 0.5
0.6
0.4
0.5 0.4
0.3
0.4
0.5
0.3
0.4 0.3
0.3
0.2
0.2
0.2
0.2 0.1
0.1
0
0.1
0.1
Ours
LRMR
GS
HS
DSR
GBMR
(a) SOD
HDCT
ORBD
SF
0
0 Ours
LRMR
GS
HS
DSR
GBMR
(b) MSRA
HDCT
ORBD
SF
0 Ours LRMR
GS
HS
DSR GBMR HDCT ORBD
(c) SSB
SF
SS
Ours LRMR
GS
HS
DSR GBMR HDCT ORBD
SF
LFS
(d) LFSD
Figure 6. Performance comparisons of ours vs. (a) SOD, (b) MSRA, (c) SSB and (d) LFSD. The top row shows the PRC and bottom row uses the bar chart to show the average precision, recall and F-score.(Best view in pdf)
Image
Ours
GT
Figure 7. Failure cases. Top: our result appears segmented on a 4D light field data due to incorrect focusness estimation. Bottom: our result incurs errors on a 2D image due to high foreground/background similarity.
image as input. Again, to avoid unfair comparison, we add the light field features (defined in section 3.1) into DRS and LRMR’s framework before evaluation. We follow the canonical precision-recall curve(PRC) and F-measure methodologies to evaluate the accuracy of the detected saliency on databases of different dimension. For details about these two evaluation methods, we refer reader to [10]. The parameters setting in our implement is the same as [5]. Fig. 6 shows the result of the two comparison architectures. Experimental results show that the PRC of our unified approach achieves state-of-the-art and the best F-measure in all the databases. It is important to note that our PRC only have values within certain recall range. This is due to the fact that the difference between saliency and non-saliency values assigned by our algorithm is much greater than others. In another word, the saliency maps computed by our algorithms is of the best similarity to ground truth, as shown in Fig. 5. Our approach can handle highly challenging cases such as the blue bird scene in LFSD and the fish scene in SOD where the deemed saliency regions have a similar color/texture to the non-saliency regions. Notice that our recall values are still higher than other methods with favourable precision in most cases. This indicates that our algorithm is capable of locating most saliency regions with a high confidence. Fig. 5 shows that our technique also produces more visually pleasing results, e.g., it generates more complete contours and more accurate saliency maps.
6. Conclusions We have presented a novel saliency detection algorithm that is applicable to 2D image data, 3D stereo/depth data, and 4D light field data without modifying the processing pipeline. We first develop a data-specific feature vector descriptor. For 2D data, it corresponds to color and textures. For 3D, we append depth information. For 4D, we further append focusness measures. We show that two types of fea-
ture descriptors are complimentary to each other for handling variational types of texture/color scene compositions. We have then built a dictionary based framework that constructs saliency and non-saliency dictionaries from the stacked feature vectors. Compared with state-of-art techniques that commonly adopt different solution frameworks for handling different data inputs, our technique does not require modifying the algorithm but only the input descriptor. Comprehensive experiments have shown that it outperforms previous tailored solutions for different data types. A limitation of our technique is that it does not fully exploit the rich information embedded in 3D and 4D. By far, we only use the depth value and focusness cues inferred from these data. If they do not provide additional information, our technique falls back to the 2D case, as shown in Fig. 7. In the future, we plan to design more effective descriptors, e.g., depth variations and view-dependency features, embedded in 3D and 4D data. Since our approach requires building and refining dictionaries, we also plan to investigate more efficient algorithms to accelerate the process. Finally, we expect other uses of our framework such as tracking and recognition. In particular, there is limited work on using 3D depth and in particular 4D light field data for such tasks. For example, the saliency results can be directly used as inputs to existing tracking or streo matching algorithms, to improve their performance in cluttered scenes. Algorithm 1 Iterative Refinement Input: S 0 , A0 ,H 0 ,F A ,F H , j = 0 Output: Sal 1: function I TERATIVE O PT(S 0 , A0 , H 0 , F A , F H ) 2: while not converge do 3: for superpixel ri = 1 → N do j j 4: αrAi , αrHi ← Eqn. 3 j Hj 5: �A ri , �ri ← Eqn. 5 j j 6: SalA (ri ), SalH (ri ) ← Eqn. 8 7: Sal(ri ) ← Eqn. 9 8: end for 9: S j+1 ← {ri |Sal(ri ) > mean(Sal(ri ))} 10: Aj+1 ← F A (S j+1 ) 11: H j+1 ← F H (S j+1 ) 12: j ←j+1 13: end while 14: Sal < T ← 0 15: end function
Acknowledgements This research is supported by National Science Foundation Grant IIS-1218177.
References [1] R. Achanta, A. Shaji, K. Smith, A. Lucchi, P. Fua, and S. Susstrunk. Slic superpixels compared to state-of-the-art superpixel methods. IEEE Trans. Pattern Anal. Mach. Intell., 34(11):2274–2282, Nov. 2012. 2 [2] A. Borji and L. Itti. Exploiting local and global patch rarities for saliency detection. In CVPR, pages 478–485. IEEE, 2012. 2 [3] A. Borji, D. N. Sihite, and L. Itti. Salient object detection: a benchmark. In ECCV, 2012. 2 [4] A. P. Bradley and F. Stentiford. J. Visual Communication and Image Representation, (3):232–250. 1 [5] M. Cheng, G. Zhang, N. Mitra, X. Huang, and S. Hu. Global contrast based salient region detection. In CVPR, pages 409– 416, 2011. 7 [6] H. G. Feichtinger and T. Strohmer, editors. Gabor Analysis and Algorithms: Theory and Applications. Birkhauser Boston, 1st edition, 1997. 3 [7] Y. HaCohen, E. Shechtman, D. B. Goldman, and D. Lischinski. Non-rigid dense correspondence with applications for image enhancement. In ACM Transactions on Graphics (TOG), volume 30, page 70. ACM, 2011. 5 [8] J. Huang, S. Ma, and C. hui Zhang. Adaptive lasso for sparse highdimensional regression. Technical report, University of Iowa, 2006. 3 [9] L. Itti and C. Koch. Computational modelling of visual attention. Nature Reviews Neuroscience, 2(3):194–203, Mar 2001. 2 [10] L. Itti, C. Koch, and E. Niebur. A model of saliency-based visual attention for rapid scene analysis. TPAMI, 20(11):1254– 1259, 1998. 7 [11] P. Jiang, H. Ling, J. Yu, and J. Peng. Salient region detection by ufo: Uniqueness, focusness and objectness. In ICCV’13, pages 1976–1983, 2013. 2 [12] J. Kim, D. Han, Y.-W. Tai, and J. Kim. Salient region detection via high-dimensional color transform. In CVPR, 2014. 5 [13] P. D. Kovesi. MATLAB and Octave functions for computer vision and image processing. Centre for Exploration Targeting, School of Earth and Environment, The University of Western Australia, 2000. Available from: . 4 [14] C. Lang, T. V. Nguyen, H. Katti, K. Yadati, M. Kankanhalli, and S. Yan. Depth matters: influence of depth cues on visual saliency. In Proceedings of the 12th European conference on Computer Vision - Volume Part II, ECCV’12, pages 101– 115, 2012. 1, 2 [15] M. Levoy and P. Hanrahan. Light field rendering. In Proceedings of the 23rd Annual Conference on Computer Graphics and Interactive Techniques, SIGGRAPH ’96, pages 31–42, New York, NY, USA, 1996. ACM. 1 [16] N. Li, J. Ye, Y. Ji, H. Ling, and J. Yu. Saliency detection on light field. In CVPR, June 2014. 2, 5 [17] X. Li, H. Lu, L. Zhang, X. Ruan, and M.-H. Yang. Saliency detection via dense and sparse reconstruction. In ICCV, 2013. 1, 3, 4, 5
[18] T. Liu, Z. Yuan, J. Sun, J. Wang, N. Zheng, X. Tang, and H. Shum. Learning to detect a salient object. TPAMI, 33(2):353–367, 2011. 2, 5 [19] V. Movahedi and J. H. Elder. Design and perceptual validation of performance measures for salient object segmentation. In Computer Vision and Pattern Recognition Workshops (CVPRW), 2010 IEEE Computer Society Conference on, pages 49–56. IEEE, 2010. 2, 5 [20] Y. Niu, Y. Geng, X. Li, and F. Liu. Leveraging stereopsis for saliency analysis. In CVPR, 2012. 1, 2, 3, 5 [21] H.-C. Nothdurft. Salience from feature contrast: additivity across dimensions. Vision Research, 40(10´lC12):1183 – 1201, 2000. 2 [22] F. Perazzi, P. Krähenbühl, Y. Pritch, and A. Hornung. Saliency filters: Contrast based filtering for salient region detection. In CVPR, pages 733–740, 2012. 2 [23] F. Perazzi, P. Krähenbühl, Y. Pritch, and A. Hornung. Saliency filters: Contrast based filtering for salient region detection. In CVPR, 2012. 5 [24] J. H. Reynolds and R. Desimone. Interacting roles of attention and visual salience in {V4}. Neuron, 37(5):853 – 863, 2003. 2 [25] M. Rubinstein, A. Shamir, and S. Avidan. Improved seam carving for video retargeting. ACM Transactions on Graphics (SIGGRAPH), 27(3):1–9, 2008. 1 [26] A. Santella, M. Agrawala, D. DeCarlo, D. Salesin, and M. Cohen. Gaze-based interaction for semi-automatic photo cropping. In Proceedings of the SIGCHI Conference on Human Factors in Computing Systems, CHI ’06, pages 771– 780, New York, NY, USA, 2006. ACM. 1 [27] B. Suh, H. Ling, B. B. Bederson, and D. W. Jacobs. Automatic thumbnail cropping and its effectiveness. In Proceedings of the 16th annual ACM symposium on User interface software and technology, UIST ’03, pages 95–104, 2003. 1 [28] Y. Wei, F. Wen, W. Zhu, and J. Sun. Geodesic saliency using background priors. In ECCV, 2012. 5 [29] Y. Wu. A unified approach to salient object detection via low rank matrix recovery. In Proceedings of the 2012 IEEE Conference on Computer Vision and Pattern Recognition (CVPR), CVPR ’12, pages 853–860, Washington, DC, USA, 2012. IEEE Computer Society. 2, 3, 5 [30] Q. Yan, L. Xu, J. Shi, and J. Jia. Hierarchical saliency detection. In CVPR, 2013. 5 [31] C. Yang, L. Zhang, H. Lu, X. Ruan, and M.-H. Yang. Saliency detection via graph-based manifold ranking. In CVPR, 2013. 3, 5 [32] W. Zhu, S. Liang, Y. Wei, and J. Sun. Saliency optimization from robust background detection. In CVPR. IEEE, 2014. 4, 5