Stem C ells O A
®
This material is protected by U.S. Copyright law. Unauthorized reproduction is prohibited. For reprints contact:
[email protected]
riginal rticle
Absolute Values of Dendritic Cell Subsets in Bone Marrow, Cord Blood, and Peripheral Blood Enumerated by a Novel Method PAUL SZABOLCS,a KYUNG-DUK PARK,a,b MELISSA REESE,a LUCIANA MARTI,a GLORIA BROADWATER,c JOANNE KURTZBERGa a
Department of Pediatrics, Pediatric Stem Cell Transplant Program, Duke University Medical Center, Durham, North Carolina, USA; b(Current address) Department of Pediatrics, Chungnam National University Hospital, Daejeon, South Korea; cCancer Center Biostatistics Department, Duke University Medical Center, Durham, North Carolina, USA Key Words. Dendritic cells · Lymphocytes · Hematopoietic stem cells · Bone marrow transplantation · Tolerance
A BSTRACT Dendritic cells (DCs) are pivotal in inducing immunity or alternatively downregulating immune reactivity. In humans, the opposing phenotypic subsets of CD11c+/CD123– “myeloid” DCs and CD123+/CD11c– “lymphoid” DCs have been proposed to orchestrate these immune responses. In this study we determined the absolute numbers of both subsets in three resting hematopoietic tissues by employing a novel flow cytometry method, eliminating processing steps and calculations based on mononuclear cell percentages. Internal bead standards along with the cells of interest were simultaneously acquired directly from unmanipulated whole blood specimens. We found significant differences (p < 0.001) between the mean absolute numbers of CD123+/CD11c– lymphoid DCs among the three sources, with the fewest present in peripheral blood (8.2/µl), about 50% more in cord blood (12.2/µl), and fivefold more in bone marrow
(40.2/µl). Cord blood and bone marrow CD11c+/CD123– myeloid DC counts did not differ from each other (23.5/µl and 28.9/µl, respectively) but peripheral blood contained significantly fewer (15.5/µl, p = 0.006). CD11c+/CD123– DCs had significantly higher surface expression of HLA-DR (p < 0.001) in all three sources. To test for association with the DC subsets, T, B, and natural killer (NK) lymphocytes were also enumerated. In bone marrow only, significant correlations were found between the size of the CD123+/CD11c– lymphoid DC pool and NK cells (p = 0.0029) and B cells (p = 0.0033). These data support the hypothesis that a common CD123+/CD11c– DC, NK cell, and B cell progenitor is resident in marrow, and this cell may be identical to the common lymphoid progenitor previously described in mice and/or the human CD34+/Lin–/CD10+ progenitor. Stem Cells 2003;21:296-303
INTRODUCTION Dendritic cells (DCs) are bone marrow-derived antigenpresenting cells (APCs) critical in the initiation and regulation of immune responses [1-3]. Circulating DCs in the
peripheral blood take residence in parenchymal tissues poised to capture self and foreign antigens, which the DCs present in draining lymphoid tissues as processed peptides to T and B lymphocytes, stimulating both primary and recall
Correspondence: Paul Szabolcs, M.D., Pediatric Stem Cell Transplant Program, Box 3350, Duke University Medical Center, Durham, NC 27710, USA. Telephone: 919-668-1122; Fax: 919-668-1180; email:
[email protected] Received October 4, 2002; accepted for publication January 31, 2003. ©AlphaMed Press 1066-5099/2003/$12.00/0
STEM CELLS 2003;21:296-303
www.StemCells.com
297
immunity. DCs in the thymus eliminate potentially autoreactive cells from the T-cell repertoire [4]. Peripheral immature DCs presenting self-antigens may be tolerogenic by silencing autoreactive T cells [5, 6]. Recently, both resident and blood DCs have been divided into two distinct groups: the GM-CSF-dependent myeloid DCs, previously characterized in mice by Inaba et al. [7, 8] versus interleukin (IL)-3-dependent/GM-CSF-independent lymphoid DCs [1, 9]. In humans, myeloid CD11c+/CD123– DCs (DC1) have been proposed to be the key initiators of Th1 type antimicrobial T-cell responses, while CD123+/CD11c– lymphoid DCs (DC2) are candidate APCs regulating Th2 T cells. The latter may also modulate tolerance [10]. The potential clinical significance of DCs as APCs in transplantation is evident by their capacity to modulate alloreactivity that may affect graft acceptance and graft-versus-host disease [11]. CD123+ lymphoid DCs are selectively mobilized in G-CSFprimed peripheral blood mononuclear cell (MNC) grafts inhibiting alloreactivity by inducing Th2 polarization among naïve allogeneic T cells [12]. Despite extensive research, the developmental origins of DCs remain somewhat ambiguous. CD13+, CD33+ myeloid DCs are well defined in humans and can be generated in vitro from CD34+ progenitors [13-18]. Downstream from CD34+ cells, bipotential post-colony-forming unit progenitors exist with the developmental potential for either DC or monocyte differentiation, dependent on the cytokine milieu [19, 20]. Myeloid DCs resident in human tonsillar germinal centers [21] and blood [22, 23] express CD11c, CD33, and CD13 in the absence of cytokine stimulation. The cytokine expression profile of isolated human myeloid DCs includes GM-CSF and macrophage-CSF (M-CSF) [24, 25]. Myeloid DCs can also be generated in vitro in large numbers from human blood monocytes cultured in GM-CSF and IL-4, [26-28] and, even in the absence of GM-CSF alternative signals such as CD40 ligation and transendothelial migration, they can develop into DCs [29, 30]. The existence of another DC population with lymphoid origin was proposed first in rodents, describing them as CD8α+ cells in mouse thymus [31]. Subsequently, CD11c– putative lymphoid DCs that lack the myeloid markers CD13 and CD33 were also found in human tonsils (plasmacytoid DCs) [32], in thymus [33], and in circulating blood as well [9, 34]. Despite the obvious clinical relevance of these leukocytes in organ and hematopoietic cell transplantation and altered immune states, the physiologic numbers of resting DC subsets have been only estimated based on methods that could have yielded inaccurate results. Employing overnight culture, utilizing processing steps such as density centrifugation or washes that may reduce or eliminate certain cell
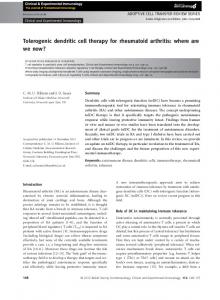
DC Subsets in Bone Marrow, Cord Blood, and Peripheral Blood populations, or by using calculations of crude WBC percentages or ficolled MNCs [12, 35-45] could all contribute to inaccurate results. In this study, we set out to determine the physiologic numbers of both DC subsets in unmanipulated cord blood and bone marrow, the two clinically most commonly transplanted resting stem cell pools, and compared them with DC subsets in resting adult peripheral blood. We simultaneously enumerated both DC subsets in the same unprocessed sample by a novel DC enumeration assay method based on fourcolor flow cytometry, eliminating the potentially biasing effect of MNC percentages. Internal bead standards and the cells of interest were simultaneously acquired directly from unmanipulated specimens. Once the respective size of both DC pools was determined, we tested whether the measured DC subsets were numerically linked to lymphoid or myeloid leukocytes. To evaluate the quantitative and potentially ontogenetic relationship between DC subsets and lymphocyte subsets, the respective absolute numbers of CD3+ T cells, CD16/56+ natural killer (NK) cells, and CD19+ B cells were measured from each sample in all three sources. MATERIALS AND METHODS Heparinized samples of fresh peripheral blood from normal adult volunteers (n = 31) were obtained after signed informed consent. Freshly harvested bone marrow (n = 29) and collected umbilical cord blood samples (n = 29) were obtained from discarded quality control specimens that were processed at the Duke University Stem Cell Laboratory and the Carolinas Cord Blood Bank at Duke University. Bone marrow donors with a mean age of 30 ± 10 years were healthy family members (n = 27) or unrelated bone marrow donors (n = 2) of patients undergoing allogeneic transplantation at Duke University Medical Center. Samples were stained in TruCount (Becton Dickinson [BD]; San Jose, CA; http://www.bd.com] tubes containing internal bead standards, fixed with FACS Lyse buffer (BD), and acquired without wash the same day they were obtained. Fluorescent beads were simultaneously acquired with cellular events on a dual laser (488 nm, 635 nm) FACS Calibur instrument (BD). Acquisition threshold was set on FL-3, excluding most cells negative for HLA-DR-PerCP (Fig. 1B). For DC analysis, an R1 region was drawn, including lymphocytes and monocytes but excluding granulocytes and beads (Fig 1A). DC were further defined by tight gating on HLA-DRPerCP-expressing cells in FL-3 (R2 in Fig. 1B), and finally by limiting to only those cells (R3 in Fig. 1C) that stained negative/dim for a cocktail of fluorescein isothiocyanate (FITC)-conjugated monocyte/B-cell/T-cell/NK-cell lineage (Lin) markers (CD14, CD19/20, CD3, CD16/56) plus the progenitor marker, CD34. CD11c+/CD123– myeloid DCs
Szabolcs, Park, Reese et al.
SSC-Height 200 400 600 800 1,000
SSC-Height 200 400 600 800 1,000
298
B
A
0
R4 R3
101 102 103 Mouse IgG1 PE
104
104 103 101
102
104
103
104
101 102 103 CD11c APC
102
LIN+CD34FITC
103 102
100
100
101
104
104
F
101 100
LIN+CD34FITC
101 102 103 CD123 PE
103 101 102 104 Anti-HLA-DR PerCP
R5
100
R3
100
R4
LIN+CD34FITC
103 102 101 100
LIN+CD34FITC
D
100
E
100
200 400 600 800 1,000 FSC-Height
104
0
C
R2
0
R1
R6
100
R5
101 102 103 Mouse IgG2a APC
104
Figure 1. CD123+/CD11c– lymphoid and CD11c+/CD123– myeloid DC subsets. Analysis was performed on CellQuest software (BDIS). Each measurement contained >50,000 events within the MNC population. Images A and B depict the R1 and R2 regions, respectively. The dotplots (C-F) present only those cellular events that conform to both regions (R1×R2). R6 region (cells in magenta) depicts the acquired TruCount beads. The R3 region restricts the cells within the R1×R2 region to DCs that are negative for a cocktail of FITC-conjugated lineage and CD34 surface markers. The R4 region (cells in red) identifies and enumerates CD123+/CD11c– DC events, while the R5 region (cells in green) identifies CD11c+/CD123– DC events. Images E-F depict cells from the same sample stained with matching isotype controls.
DC Subsets in Bone Marrow, Cord Blood, and Peripheral Blood
299
Table 1. Acquired cellular events Events
Median
Mean
SD
CV
Blood
Total CD11c+ DC CD123+ DC
31,321 282 138
34,495 326 164
10,452 205 100
30% 63% 61%
UCB
Total CD11c+ DC CD123+ DC
56,018 259 159
60,715 347 186
29,329 195 113
48% 56% 61%
Marrow
Total CD11c+ DC CD123+ DC
82,493 339 519
87,006 384 515
27,636 197 230
32% 51% 45%
Absolute cell counts/µl as measured from volunteer blood, umbilical cord blood (UCB), and bone marrow. Dilutional effect of anticoagulants was corrected by calculating the dilutional coefficient. Median, mean, standard deviation (SD), and coefficient of variance (CV) are presented for each group.
(R5 in Fig. 1D) were identified within the HLA-DR+/Lin– cells (compound gated R1×R2×R3) as those cells that stained with CD11c–APC above that of isotype control (Fig. 1F), while lymphoid DCs (Fig. 1C) were identified by their surface stain for CD123– phycoerythrin (R4 in Fig. 1C) above that of isotype control (Fig. 1E). Fluorescent TruCount beads were identified by their small size and brightness in all fluorescent channels along with the respective DC or lymphocyte events (Figs. 1A, 1B). The total cellular events and DC subset-specific events acquired for each group are presented in Table 1. Absolute counts of DC and lymphocyte subsets were calculated by determining the ratio of beads to the cell population of interest and then multiplying this ratio with the number of beads placed in the tube [46]. For DC subsets, the following formula was used. First DC-adjusted events were obtained by: (% test - % isotype control)/100 × acquired events in the R1×R2×R3 region. The final, absolute number of cells/µl sample was then obtained by the formula: DC-adjusted events/acquired bead count × original bead count/sample volume × dilutional coefficient. Dilutional coefficient = final diluted volume/dilution-free sample volume. Lymphocytes were stained and acquired similarly with the same “lyse/no wash” method in another TruCount tube using a commercial four-color reagent (Multitest, BD). Within the CD45+ lymphocyte scatter gate, T cells were identified as CD3+ lymphocytes, NK cells as CD16/56+ cells not expressing CD3, while B cells were CD19+ CD3– CD16/56–. Absolute lymphocyte count (ALC) was calculated as the sum of T, NK, and B lymphocytes. Absolute myeloid count (AMC) was derived from the total WBC count by subtracting the ALC. A total of 89 patients were included in the analysis; however, the HLA-DR fluorescence data were retrospectively
analyzed for 30 patients (10 in each cell type group). All analyses were performed on the log transformations of the raw data. This transformation normalizes the data. An analysis of variance approach was used to test for any differences in mean cell count among the three groups: bone marrow, cord blood, and volunteer blood. Duncan’s multiple-range test was used to determine which groups differed with respect to mean cell count. Pearson’s correlation coefficients were used to examine pairwise associations to analyze the relationship between two variables such as the absolute values of DC subsets and various leukocyte subsets, all of which were obtained from the same sample. RESULTS Lymphoid and myeloid DC subsets were enumerated in cord blood, bone marrow, and resting adult peripheral blood from unprocessed samples by a novel lyse/no wash enumeration assay method. The development of this method served to eliminate potentially biasing effects of sample manipulation and the need for calculations based on MNC percentages. Fluorescent bead standards at predetermined numbers were loaded by the manufacturer into TruCount tubes and were acquired simultaneously along with the cells of interest, directly from unmanipulated specimens. The ratio of acquired versus preloaded beads served to determine the ratio of cells acquired versus those present in the specimen. CD11c+/CD123– myeloid and CD123+/CD11c– lymphoid DC subsets were readily identified in all three cell sources in the HLA-DR+/Lin– population by their contrasting expression profile for CD11c and CD123 (Figs. 1C, 1D). During acquisition, the flow cytometer threshold was set on HLADR to exclude most HLA-DR–/dim cells. The mean acquired HLA-DR+ cellular events for the 89 samples was 81,500 events per tube with a standard deviation of 35,900. The acquired total cellular events and lymphoid versus myeloid DC-specific events for each group are presented in Table 1. When measured by size and granularity (forward scatter and side scatter), both subsets of DCs, regardless of the source, clustered in a transitional zone between lymphocytes and monocytes (Fig. 1A) as previously shown in peripheral blood [12, 44]. When the two subsets were compared within the same sample, there was a significantly higher expression of HLA-DR on CD11c+/CD123– myeloid DC as compared with CD123+/CD11c– lymphoid DCs in each sample for all three sources (p < 0.001, paired t-test comparison of mean fluorescence intensity; Fig. 1B). Absolute numbers of DC subsets and the other leukocytes were determined with the same method from all three sources (Table 2). Significant differences were found among the mean absolute numbers of CD123+/CD11c– lymphoid DCs in the three sources, with the fewest present in
Szabolcs, Park, Reese et al.
300
Table 2. Absolute numbers of DC subsets and leukocytes from three sources
Blood
+
CD11c DC CD123+ DC T cells B cells NK cells ALC AMC WBC +
Median
Mean
SD
CV
13 8 1,628 270 284 2,268 4,229 6,800
15.5 8.2 1,777.0 317.5 304.1 2,398.4 4,804.8 7,203.2
9.3 4.3 507.2 196.0 146.3 743.9 2,039.3 2,018.2
60% 53% 29% 62% 48% 31% 42% 28%
UCB
CD11c DC CD123+ DC T cells B cells NK cells ALC AMC WBC
20 12 2,945 766 1,146 4,908 6,960 12,200
23.5 12.2 3,015.8 888.1 1,098.5 5,060.5 7,536.1 12,596.6
12.7 5.8 983.1 471.5 561.6 1,670.6 3,181.2 3,401.6
54% 48% 33% 53% 51% 33% 42% 27%
Marrow
CD11c+ DC CD123+ DC T cells B cells NK cells ALC AMC WBC
20 36 2,235 473 200 3,339 15,678 17,900
28.9 40.2 2,425.7 662.9 251.8 3,318.8 16,681.8 20,072.4
31.6 34.9 966.9 481.2 214.2 1,213.1 6,236.2 6,334.3
110% 87% 40% 73% 85% 37% 37% 32%
Absolute DC and lymphocyte counts/µl as measured from volunteer blood, umbilical cord blood (UCB), and bone marrow. Dilutional effect of anticoagulants was corrected by calculating the dilutional coefficient. Median, mean, standard deviation (SD), and coefficient of variance (CV) are presented for each group.
volunteer blood (8.2/µl), about 50% more in cord blood (12.2/µl), and about fivefold more in bone marrow (40.2/µl) (p < 0.001). Adult peripheral blood contained significantly less CD11c+/CD123– myeloid DCs (15.5/µl, p = 0.006), while cord blood and bone marrow counts did not differ from each other statistically (23.5/µl and 28.9/µl, respectively) (Table 2). Furthermore, in cord blood and adult peripheral blood there were almost twice as many CD11c+/CD123– myeloid DCs than CD123+/CD11c– lymphoid DCs. In contrast, in bone marrow, lymphoid CD123+/CD11c– DCs predominated. Once the range of DC subsets in the three hematopoietic compartments was established, we analyzed within each specimen the relationship between the absolute values of DC subsets and WBC; T, NK, and B lymphocytes; ALC, and AMC. Pearson’s correlation coefficients were used to examine pairwise associations. In adult peripheral blood and cord blood, no significant correlation was found between any leukocyte populations and DC numbers (Table 3).
However, in bone marrow the CD123+/CD11c– lymphoid DC population size correlated with the size of the NK cell pool (p = 0.0029) and B-lymphocyte numbers (p = 0.0033), but not T lymphocytes (p = 0.107) (Table 3). NK- and B-lymphocyte pool size also correlated with each other (p = 0.002, data not shown). CD11c+/CD123– myeloid DC numbers did not correlate with T, B, or NK lymphocytes in any of the sources tested, nor did we find any correlation between CD11c+/CD123– myeloid DCs and AMC. DISCUSSION In this manuscript, we reported the physiologic ranges of lymphoid and myeloid DC subsets in cord blood, bone marrow, and adult peripheral blood by establishing a reliable lyse/no wash method to enumerate absolute numbers of DC subsets directly from unmanipulated whole blood samples without using percentage of WBCs or MNC counts. This need is underscored by the increasing number of investigators who employ potentially biasing processing methods to report on the clinical associations of these APC subsets following chemotherapy for various malignancies or immunodeficiency states such as following solid organ and hematopoietic cell transplantation [12, 36-43]. Sample processing and calculations based on the percentage of WBCs or MNC numbers were eliminated by our method, and target cell-specific fluorescent events (DC subsets; T, B, NK lymphocytes) were counted directly from the sample along with a known number of brightly fluorescent polystyrene beads. The reproducibility and reliability of this approach is highlighted in a carefully performed recent study [47] enumerating absolute CD4 and CD8 counts. The use of TruCount tubes loaded with beads (BDIS) decreased both the inter- and intralaboratory variability when 60 specimens from HIV type 1-infected donors were shipped to five laboratories. The acquisition of cellular events along with TruCount beads has been demonstrated to be superior to standard methods in enumerating rare cells, as well as for CD34+ progenitor cells in cord blood [48] and in mobilized leukopheresis products [49] with less variability between data analyzed by different operators. The absolute DC numbers obtained by our lyse/no wash method appear to be in range with some other flow cytometric DC enumeration studies [44, 45]. The absolute CD11c+ myeloid DC counts (mean, 15.5/µl, n = 31) enumerated in peripheral blood were remarkably similar to a study that estimated CD33 myeloid marker-positive DC counts from the MNC percentage following red cell lysis and wash (mean, 17.4/µl, n = 35) [45]. Thus, we believe our method for staining unmanipulated specimens could be easily adopted, and its accuracy may be superior in enumerating DC subsets in various clinical scenarios. Furthermore, the test can be performed on a small 100-µl blood sample.
DC Subsets in Bone Marrow, Cord Blood, and Peripheral Blood
301
Table 3. Pearson correlation between the mean absolute numbers of leukocytes, major lymphocyte subsets, and DC subsets enumerated from the same sample Blood CD123+/CD11c– lymphoid DC
CD11c+ DC T cells B cells NK cells ALC AMC WBC
CD11c+/CD123– myeloid DC
T cells B cells NK cells ALC AMC WBC
Marrow
UCB
r
p
r
r
p
– – – 0.31 – – –
NS NS NS 0.088 NS NS NS
0.76 0.31 0.54 0.54 0.51 – 0.32