VOL. 10, NO. 16, SEPTEMBER 2015
ISSN 1819-6608
ARPN Journal of Engineering and Applied Sciences ©2006-2015 Asian Research Publishing Network (ARPN). All rights reserved.
www.arpnjournals.com
ACTIVE SEGMENTATION AND CLASSIFICATION FOR HYPER SPECTRAL IMAGE USING BACK PROPAGATION Sathiyavani1, S. Pavithra1 and A. Krishnalakshmi2 1Department 2Department
of Computer Science and Engineering, VeltechMultitech Engineering College, Chennai, India of Electronics and Communication Engineering, Jaya Sakthi Engineering College, Chennai, India E-Mail:
[email protected]
ABSTRACT A set of high-resolution remote sensing images covering multiple spatial features, we propose a classification based on unsupervised technique including pixel-wise and sub-pixel-wise methods to detect possible built-up areas from remote sensing images. The motivation behind is that the frequently recurring appearance patterns or repeated textures corresponding to common objects of interest in the input image data set can help us distinguish built-up areas from other features. In our proposed method have two main steps first; extract a large set of corners from each input image by an improved Harris corner detector. In the second step we incorporate the extracted corners into a likelihood function to locate candidate regions in input image. Experimental results demonstrated that the proposed approach have got accurate estimation compare to the existing algorithms in terms of detection accuracy. Keywords: hyper spectral image, neural network, harris corner detector, classification.
1. INTRODUCTION A multispectral image consists of several bands of data. For visual display, each band of the image may be displayed one band at a time as a grey scale image, or in combination of three bands at a time as a colour composite image. Interpretation of a multispectral colour composite image will require the knowledge of the spectral reflectance signature of the targets in the scene. In this case, the spectral information content of the image is utilized in the interpretation.Computers are indispensable for the analysis of large amounts of data, for tasks that require complex computation, or for the extraction of quantitative information. On the other hand, the human visual cortex is an excellent image analysis apparatus, especially for extracting higher-level information, and for many applications - including medicine, security, and remote sensing - human analysts still cannot be replaced by computers. For this reason, many important image analysis tools such as edge detectors and neural networks are inspired by human visual perception models. Remote sensing has become an important source of land use/cover information at a range of spatial and temporal scales [3]. Traditional classification techniques assign every pixel to a single class, but remote-sensing images, particularly at coarse spatial resolutions, are commonly dominated by mixed pixels that contain more than one class on the ground [4]. To obtain the subpixel information, soft classification techniques and spectral unmixing algorithms have been used to obtain the fraction of each class in a pixel [5]-[7]. However, the subpixel spatial attribution of the different classes in a pixel will still be unknown with these techniquesQuantitative measurements of the spectral characteristics of materials using a remote sensing system having greater than 60 spectral bands with a spectral resolution less than 10 nm producing a contiguous portion of the light spectrum
which defines the chemical composition of the material through its spectral signature Hyperspectral sensing allows the analyst to perform reflectance or fluorescence spectroscopy on each spatial element (pixel) of the image scene In these cases, the additional information provided by hyperspectral imagery often provides results not possible with multispectral or othertypes of imagery. In target detection projects, investigators are generally trying to locate known target materials. This can sometimes involve distin- guishing targets from very similar backgrounds, or locating examples of targets that are smaller than the nominal pixel size. Hyperspectral images contain a wealth of data, but interpreting them requires an understanding of exactly what properties of ground materials we are trying to measure, and how they relate to the measurements actually made by the hyperspectral sensor. Hyperspectral images are produced by instruments called imaging spectrometers. The development of these complex sensors has involved the convergence of two related but distinct technologies: spectroscopy and the remote imaging of Earth and planetary surfaces. Spectroscopy is the study of light that is emitted by or reflected from materials and its variation in energy with wavelength. Remote imagers are designed to focus and measure the light reflected from many adjacent areas on the Earth’s surface. The most significant recent breakthrough in remote sensing has been the development of hyperspectral sensors and software to analyze the resulting image data.Fifteen years ago only spectral remote sensing experts had access to hyperspectral images or software tools to take advantage of such images. Over the past decade hyperspectral image analysis has matured into one of the most powerful and fastest growing technologies in the field of remote sensing. The “hyper” in hyperspectral means “over” as in “too many” and refers to the large
6908
VOL. 10, NO. 16, SEPTEMBER 2015
ISSN 1819-6608
ARPN Journal of Engineering and Applied Sciences ©2006-2015 Asian Research Publishing Network (ARPN). All rights reserved.
www.arpnjournals.com number of measured wavelength bands. Hyperspectral images are spectrally overdetermined, which means that they provide ample spectral information to identify and distinguish spectrally unique materials. Hyperspectral imagery provides the potential for more accurate and detailed information extraction than possible with any other type of remotely sensed data. Applications of Hyperspectral Remote Sensing Projects utilizing hyperspectral imagery usually have one of the following objectives:
target detection material mapping material identification mapping details of surface properties
on fuzzyrule-based composition of anisotropic texture cooccurrencemeasures. In recent years, built-up area detection based onlocal invariant features has revealed promising results. In developing a method to detect built-up areasand buildings in very high resolution Ikonos satellite imagesbased on scale-invariant feature transform features and graphtheory. However, it needs some template building images fortraining and therefore suffers from a high computing complexityand memory requirement. In their later, a moredirect method is used. However, since it solely depends on localfeatures for recognition, it can often be too weak of a signal toreliably detect the built-up regions in complex satellite image 2. RELATED WORK
Therefore unsupervised classification (back propagation) has been used. Back propagation is the generalization of the Widrow-Hoff learning rule to multiple-layer networks and nonlinear differentiable transfer functions. Input vectors and the corresponding target vectors are used to train a network until it can approximate a function, associate input vectors with specific output vectors, or classify input vectors in an appropriate way as defined by you. With the development of remote sensing technologies, high-resolution remote sensing images have become critical sources of information in diverse fields such asgeography, cartography, surveillance, city planning, and soon. Among them, monitoring the distribution, growth, and characteristics of built-up area receives a growing numberof attention for it can greatly help local agency to updateland maps and draw city plans. In such applications, the basicbut important step is to extract built-up regions from thehigh-resolution remote sensing images.Generally, a built-up area represents a vital and highly dynamic environment which is mostly composed of both manmade and natural objects. Because the texture of the scene isdistinct from that of the natural scene, major approaches for built-up area detection are based on texture analysis. Its application for built-up region detection can be found. In their later work, a builduparea presence index is proposed for built-up area extractionin panchromatic satellite image, which is based
Subpixel mapping Most of the proposed methods were pixel-based. These methods try to estimate the probability of each pixel to belong to the possible classes by employing statistic measures based only on spectral properties. The Maximum Likelihood Classification (MaxVer) [16] remains one of the most popular methods for RSI classification. MaxVer computes the probability of each pixel to belong to each of the defined classes and uses that information to assign the class with the highest probability. The improvements in sensor technologies have increased the accessibility to high-resolution images. As a result, new approaches have been developed to make a better use of the available data. This led to researches that take into account the neighborhood of the pixels in the analysis and, thus, texture features in the classification of RSIs. In [17], a general overview of RSI classification until 2005 is presented. That work discusses the challenges and describes all the steps that compose the classification process. Various classification methods are presented and grouped according to its taxonomy.More recently, a new trend can be observed. Many studies [1821] consider information encoded in regions (group of pixels) for RSI classification tasks. Gigandetet al. [18] proposed a classification algorithm for high resolution RSIs, combining non-supervised and supervised classification strategies.
6909
VOL. 10, NO. 16, SEPTEMBER 2015
ISSN 1819-6608
ARPN Journal of Engineering and Applied Sciences ©2006-2015 Asian Research Publishing Network (ARPN). All rights reserved.
www.arpnjournals.com
Figure-1.Proposed system architecture. In this method, regions were classified by using Mahalanobis distance and Support Vector Machines (SVM). Lee et al. [19] created a region-based classification method for high resolution images that exploited two approches: MaxVer with region means and MaxVer with Gaussian Probability Density Function. Both works presented better results than pixel-based classifiers. Yu et al. [20] also proposed a method to classify RSIs based on regions. The image segmentation and classification were performed by using fractal networks and non-parametric K-Nearest Neighbor (KNN), respectively. Another recent work in this research area was developed by Katartziset al. [21] who proposed a regionbased RSI classification method that uses Hierarchical Markov Models. The key issue in subpixel mapping is how to determine an optimal subpixel distribution of each class in a pixel. Spatial dependence, as proposed by Atkinson in 1997, inspired from Tobler’s first law [10], is the universal criterion, which refers to the tendency for spatially proximate observations of a given property to be more alike than more distant observations [9]. A coarser fraction image is obtained by a spectral unmixing technique, as the input image and each pixel are divided into × subpixels, where S represents the scale factor. The number of subpixels for each land-cover class is then determined by
the abundances of the fraction image. Figure-2 illustrates the principle of subpixel mapping and describes a simple example with two classes. In the fraction image, as shown in Figure-2(a),assuming the scale fraction S is 4, a coarse pixel is divided into 16 (4 × 4) subpixels, and 0.5 in the fraction image means that 8 (16 × 0.5) subpixels belong to land-cover class 1. Figure-2(b) and (c) describe two possible distributions of subpixels, and the former is superior to the latter, with higher spatial dependence. Generally speaking, four kinds of features can be utilized in image processing: low-level visual features, local features, local-global features and biologically inspired features [11], [12]. However, these features are always based on the assumption that all pixels in the image are pure pixels, which is unreasonable in remotely sensed images. Fisher [13] suggested that there are four types of mixed pixels in remotely sensed images as follows [14]. 1) Small subpixel objects: the size of the object is smaller than the size of the pixel. 2) Boundary pixels: the sizes of two or more land-cover classes on the ground may be larger than the sizes of the pixel, but parts of their boundaries lie in a single pixel. 3) Intergrade pixels: a pixel allocates a space for a transition from a cluster of one class to a cluster of another class.
6910
VOL. 10, NO. 16, SEPTEMBER 2015
ISSN 1819-6608
ARPN Journal of Engineering and Applied Sciences ©2006-2015 Asian Research Publishing Network (ARPN). All rights reserved.
www.arpnjournals.com 4) Linear subpixels: the length of a land-cover class maybe longer than a pixel but its width is thinner, and the land-cover class runs through a pixel. Many
subpixel mapping methods have been proposed to tackle thedifferent types of mixed pixels: subpixel objects [15],
Figure-2. Image of 3 × 3 coarse pixels and possible distributions (scale = 4, 2classes). (a) Fraction image. (b) Optimal distribution. (c) Inferior distribution. Subpixel mapping techniques aim to determine the optimal distribution of subpixels of the different landcover classes within a pixel, based on the fraction images. The fractions of each category can be obtained by a spectral unmixing technique. Subpixel mapping can transform the fraction image into a map of suitable subpixel locations for the different classes within a pixel. Each pixel can be divided into a number of subpixels during this transformation, according to the predefined scale S and the abundances of the fraction image. Harris corners The Harris Corners module identifies corners present within the image using the Harris Corner detection technique. The technique first identifies vertical and horizontal edges using a Sobel type edge detector. Those edges are then blurred to reduce the effect of any image noise. The resulting edges are then combined together to form an energy map that contains peaks and valleys. The peaks indicate the presence of a corner. Without loss of generality, we will assume a grayscale 2-dimensional image is used. Let this image be given by I. Consider taking an image patch over the area (u,v) and shifting it by. The weighted sum of squared differences (SSD) between these two patches, denoted S is given by S(x,y)= ∑∑w(u,v)(I(u+x,v+y)-I(u,v))2 uv
(1)
Corners as interest points Many applications require relating two or more images in order to extract information from them. For example, if two successive frames in a video sequence taken from a moving camera can be related, it is possible to extract information regarding the depth of objects in the environment and the speed of the camera. The brute force
method of comparing every pixel in the two images is computationally prohibitive for the majority of applications. Intuitively, one can image relating two images by matching only locations in the image that are in some way interesting. Such points are referred to as interest points and are located using an interest point detector. Finding a relationship between images is then performed using only these points. This drastically reduces the required computation time. Many different interest point detectors have been proposed with a wide range of definitions for what points in an image are interesting. Some detectors find points of high local symmetry; others find areas of highly varying texture, while others locate corner points. Corner points are interesting as they are formed from two or more edges and edges usually define the boundary between two different objects or parts of the same object. Many corner detectors have been developed and this website investigates some of the more important ones. Applications of Corner Detectors The use of interest points (and thus corner detectors) to find corresponding points across multiple images is a key step in many image processing and computer vision applications. Some of the most notable examples are:
stereo matching image registration (of particular importance in medical imaging) stitching of panoramic photographs object detection/recognition motion tracking robot navigation
6911
VOL. 10, NO. 16, SEPTEMBER 2015
ISSN 1819-6608
ARPN Journal of Engineering and Applied Sciences ©2006-2015 Asian Research Publishing Network (ARPN). All rights reserved.
www.arpnjournals.com Requirements of a Corner Detector It is desirable for a corner detector to satisfy a number of criteria: 1. All "true corners" should be detected. 2. No "false corners" should be detected. 3. Corner points should be well localized. 4. Detector should have a high repeatability rate (good stability). 5. Detector should be robust with respect to noise. 6. Detector should be computationally efficient. The detection of all true corners with no false corners is application (interpretation) dependent since there is no well defined definition of a grayscale corner. However, in many images the corners are intuitively clear and such images can be used to evaluate the performance of different corner detectors (see Evaluating and Comparing Corner Detectors). Localization refers to how accurately the position of a corner is found. This is critical in applications requiring the precise alignment of multiple images (for example, in registration of medical images). In Figure-1.2 the reported position of the corner is illustrated with a red circle. The corner detector on the right has good localizationwhereas the corner detector on the left has poor localization. Although good localization is desirable for all applications, it is not critical for all applications (for example, an object detection algorithm may simply require the approximate location of all the object's corners).
Figure-3.Illustration of good and poor localization, respectively.
3. ARCHITECTURE OF THE NEURAL NETWORKS An Artificial Neural Network (ANN) is an information processing paradigm that is inspired by the way biological nervous systems, such as the brain, process information. The key element of this paradigm is the novel structure of the information processing system. It is composed of a large number of highly interconnected processing elements (neurones) working in unison to solve specific problems. ANNs, like people, learn by example. An ANN is configured for a specific application, such as pattern recognition or data classification, through a learning process. Learning in biological systems involves adjustments to the synaptic connections that exist between the neurones. A three-layer network was used. The input layer consisted of nine neurons, corresponding to a central pixel and its eight surrounding neighbors. This implied that subpixels could not be calculated for border pixels, as part of the information about their surroundings was missing. The input values were the membership values of these pixels for a certain class. The (unknown) spatial configuration was assumed equal for all classes. Consequently, the network was trained using membership values regardless of their originating class. In this way, only one network for all classes had to be trained, instead of having to train a separate network for each land cover class. The number of neurons in the hidden layer was set at 15. In this training algorithm, an input pattern is first propagated through the network in the so-called feedforward phase. Afterward the difference between the calculated and the desired output is back-propagated from the output neurons to the first layer of the network, thereby adjusting the network weights in the opposite direction of the derivative of the network error with respect to each individual network weight. The learning rate was set at 0.1, and a momentum coefficient of 0.2 was applied. Back propagation is a popular algorithm employed for training multilayer connectionist learning systems with nonlinear activation functions (sigmoid). However, its drawback has been partly attributed to the following: (1) there are some flat-spot problem regions, where the derivative of the sigmoid activation function approaches zero, and the weight changes become negligible; (2) because the gradient descent algorithm is used here, the constructed highresolution image is not very good, as indented shapes appear in the boundary, which makes the algorithm inefficient. To resolve this problem, an observation model is introduced in every fraction image after the Back propagation.
6912
VOL. 10, NO. 16, SEPTEMBER 2015
ISSN 1819-6608
ARPN Journal of Engineering and Applied Sciences ©2006-2015 Asian Research Publishing Network (ARPN). All rights reserved.
www.arpnjournals.com
Figure-4.Architecture of neural network. 4. EXPERIMENTALRESULT
Figure-5(a). Feature detection.
Figure-5(b).Object detection.
6913
VOL. 10, NO. 16, SEPTEMBER 2015
ISSN 1819-6608
ARPN Journal of Engineering and Applied Sciences ©2006-2015 Asian Research Publishing Network (ARPN). All rights reserved.
www.arpnjournals.com
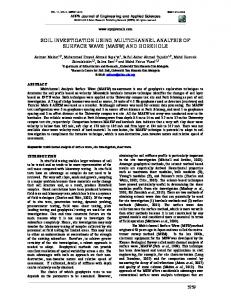
Figure-6. Predictive maps of A. artemisiifolia: (a) from the green band of Worldview 2 imagery of Montréal; (b) from the green band of Rapid Eye imagery of Salaberry-de-Valleyfield; (c) From the green band of SPOT 4 imagery ofMontreal [23].
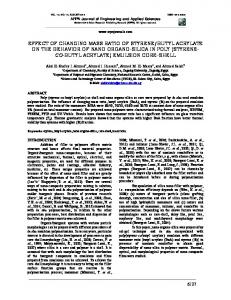
Figure-7. Kappa index of agreement between observed and predicted common ragweed for various habitat: (a) in Montreal; (b) in Valleyfield. 5. CONCLUSIONS A novel adaptive subpixel mapping method based on a back propagation model and a winner-take-all class determination strategy namely Harris corner, has been proposed to adaptively deal with hyperspectral images by
using original image downsampling and spectral unmixing to meet with the real situation. Harris corner utilizes a back propagation model, which has the ability to regularize the ill-posed problem by adding prior information to obtain a better subpixel mapping result. The traditional
6914
VOL. 10, NO. 16, SEPTEMBER 2015
ISSN 1819-6608
ARPN Journal of Engineering and Applied Sciences ©2006-2015 Asian Research Publishing Network (ARPN). All rights reserved.
www.arpnjournals.com subpixelmapping algorithms always utilize the fraction image obtained by the classification image downsampling method as the input information. In Harris corner, the original image downsampling and spectral unmixing results are applied to acquire the subpixel mapping result. Since the determination of the regularization parameter is very difficult, the traditional methods usually set a series of values to find the best result. In addition, the sensitivity analysis of the regularization parameter λ demonstrates that Harris corner obtains similar results to the optimal parameters of manual selection and hence provides an effective subpixel mapping method for hyperspectral remote sensing imagery. REFERENCES [1] J. M. Bioucas-Dias et al. 2013.Hyperspectral remote sensing data analysis and future challenges.IEEE Geosci. Remote Sens. Mag. 1(2): 6-36.
[9] P. M. Atkinson. 1997. Mapping sub-pixel boundaries from remotely sensed images.Innovations in GIS IV. London, U.K.: Taylor and Francis. pp. 166-180. [10] W. R. Tobler. 1970. A computer movie simulating urban growth in the Detroit region.Econom. Geograph. 46: 234-240. [11] D. Song and D. Tao. 2010. Biologically inspired feature manifold for scene classification.IEEE Trans. Image Process. 19(1): 174-184. [12] K. Huang, D. Tao, Y. Yuan, X. Li and T. Tan. 2011. Biologically inspired features for scene classification in video surveillance. IEEE Trans.Syst. Man, Cybern. Part B, Cybern. 41(1): 307-313. [13] P. Fisher. 1997. The pixel: A snare and a delusion.Int. J. Remote Sens. 18(3): 679-685.
[2] J. M. Bioucas-Dias et al. 2012.Hyperspectralunmixing overview: Geometrical, statistical, and sparse regression-based approaches.IEEE J. Sel. Topics Appl. Earth Observ. Remote Sens. 5(2): 354-379.
[14] A. M. Muad. 2011. Super resolution mapping. Ph.D. dissertation, School Geography, Univ. Nottingham, U.K.
[3] G. G. Wilkinson. 2005. Results and implications of a study of fifteen years of satellite image classification experiments.IEEE Trans. Geosci. Remote Sens. 43(3): 433-440.
[15] A. M. Muad and G. M. Foody. 2012. Super-resolution mapping of lakes from imagery with a coarse spatial and fine temporal resolution.Int. J. Appl.Earth Observ. Geoinf. 15: 79-91.
[4] G. M. Foody. 2002. Hard and soft classifications by a neural network with a non-exhaustively defined set of classes. Int. J. Remote Sens. 23(18): 3853-3864.
[16] R. Showengerdt. 1983. Techniques for Image Processing and Classification in Remote Sensing. New York: Academic Press.
[5] X. Ceamanos, S. Douté, B. Luo, F. Schmidt, G. Jouannic, and J. Chanussot. 2011. Intercomparison and validation of techniques for spectral unmixing of hyperspectral images: A planetary case study.IEEE Trans. Geosci. Remote Sens. 49(11): 4341-4358.
[17] D. Lu and Q. Weng. 2007. A survey of image classification methods and techniques for improvingclassification performance. International Journal of Remote Sensing. 28(5): 823-870.
[6] R. Heylen, D. Burazerovic, and P. Scheunders. 2011. Fully constrained least squares spectral unmixing by simplex projection.IEEE Trans. Geosci. Remote Sens. 49(11): 4112-4122. [7] M.-D. Iordache, J. Bioucas-Dias, and A. Plaza. 2011. Sparse unmixing of hyperspectral data.IEEE Trans. Geosci. Remote Sens. 49(6): 2014-2039. [8] A. J. Tatem, H. G. Lewis, P. M. Atkinson and M. S. Nixon. 2001. Superresolutiontarget identification from remotely sensed images using a Hopfield neural network.IEEE Trans. Geosci. Remote Sens. 39(4): 781-796.
[18] X. Gigandet, M. Cuadra, A. Pointet, L. Cammoun, R. Caloz, and J.-P. Thiran. 2005. Region-based satellite image classification: method and validation. ICIP 3: III-832-5. [19] J. Lee and T. A. Warner. 2004. Image classification with a region based approach in high spatial resolution imagery.In International Archives of Photogrammetry, Remote Sensing and Spatial Inf. Sciences, Istanbul, Turkey. pp. 181-187. [20] Q. Yu, P. Gong, N. Clinton, G. Biging, M. Kelly and D. Schirokauer. 2006. Object-based detailed vegetation classification with airborne high spatial resolution remote sensing imagery.Photogrametric Engineering Remote Sensing. 72(7): 799-811.
6915
VOL. 10, NO. 16, SEPTEMBER 2015
ISSN 1819-6608
ARPN Journal of Engineering and Applied Sciences ©2006-2015 Asian Research Publishing Network (ARPN). All rights reserved.
www.arpnjournals.com [21] A. Katartzis, I. Vanhamel and H. Sahli. 2005. A hierarchical markovian model for multiscale regionbased classification of vector-valued images. IEEE Transactions on Geoscience and Remote Sensing. 43(3): 548-558. [22] L. Zhang, K. Wu, Y. Zhong and P. Li. 2008. A new sub-pixel mapping algorithm based on a BP neural network with an observation model.Neurocomputing. 71(10-12): 2046-2054. [23] Roland Ngomand Pierre Gosselin. 2014. Development of a remote sensing-based method to map likelihood of common ragweed (Ambrosia artemisiifolia) presence in urban areas. IEEE journal of selected topics in applied earth observations and remote sensing. 7(1).
6916