Please verify that (1) all pages are present, (2) all figures are acceptable, (3) all fonts and special characters are correct, and (4) all text and figures fit within the margin lines shown on this review document. Return to your MySPIE ToDo list and approve or disapprove this submission.
Adapting images to observers Kyle C. McDermott1, Igor Juricevic1, George Bebis2, and Michael A. Webster1* 1) Department of Psychology, University of Nevada, Reno 2) Department of Computer Science and Engineering, University of Nevada, Reno
ABSTRACT Adaptation exerts a continuous influence on visual coding, altering both sensitivity and appearance whenever there is a change in the patterns of stimulation the observer is exposed to. These adaptive changes are thought to improve visual performance by optimizing both discrimination and recognition, but may take substantial time to fully adjust the observer to a new stimulus context. Here we explore the advantages of instead adapting the image to the observer, obviating the need for sensitivity changes within the observer. Adaptation in color vision adjusts to both the average color and luminance and to the variations in color and luminance within the scene. We modeled these adjustments as gain changes in the cones and in multiple post-receptoral mechanisms tuned to stimulus contrasts along different colorluminance directions. Responses within these mechanisms were computed for a range of different environments, based on images sampled from a range of natural outdoor settings. Images were then adapted for different environments by scaling the responses so that for each mechanism the average response equaled the response to a reference environment. Transforming images in this way can increase the discriminability of different colors and the salience of novel colors. It also provides a way to simulate how the world might look to an observer in different environments or to different observers in the same environment. Such images thus provide a novel tool for exploring color appearance and the perceptual and functional consequences of adaptation. Keywords: color perception, adaptation, image processing, natural images
1. INTRODUCTION Color in the world typically seems perceptually balanced, even though the mechanisms encoding color have marked biases and asymmetries in sensitivity. For example, most scenes appear to have a neutral average hue near gray, despite the strong filtering effects of the eye’s spectral sensitivity 1. Moreover, the world continues to appear neutral across the lifespan despite the increases in lens density with aging and the consequent light losses at shorter wavelengths 2. Similarly, the contrast or range of colors in scenes also routinely appears balanced, so that the world seems to vary as much in color as in brightness and has a similar perceived gamut for different colors. This balance belies the fact that luminance contrasts are necessarily much larger than chromatic contrasts because of the overlapping spectral sensitivities of the cone receptors, and the fact that there is a marked imbalance in the relative number of different cone types. For example, short-wave sensitive cones make up less than 5% of the total cone population, yet the world does not seem impoverished in the chromatic signals they convey, and this may be because their signals are greatly amplified in the cortex 3. The perceptual gamut of colors could overcome the inherent sensitivity biases of the visual system if this gamut is matched by experience to the range of color signals in the observer’s environment, and this match could be achieved by processes of adapting the range of neural responses so that they span the range of available signals. In fact, like many aspects of vision, color coding is well known to be highly adaptable, and even brief exposures to colors in an image can lead to strong changes in appearance 4. The response changes underlying these adaptation effects have been extensively studied and are understood in broad outline. In particular, the visual system adapts to both the average color in scenes – largely through gain changes in cone-specific pathways – and also adapts to the variance in color – through contrast adaptation primarily in cortical color mechanisms 5. Matching the visual response to the range of stimuli in the environment in this way is thought to confer many advantages for color perception 6, 7. These include more efficient
6806-29 V. 2 (p.1 of 10) / Color: No / Format: Letter / Date: 1/25/2008 10:03:18 PM SPIE USE: ____ DB Check, ____ Prod Check, Notes:
Please verify that (1) all pages are present, (2) all figures are acceptable, (3) all fonts and special characters are correct, and (4) all text and figures fit within the margin lines shown on this review document. Return to your MySPIE ToDo list and approve or disapprove this submission.
coding and improving the ability to discriminate color differences, to identify new colors in the scene, and to recognize the same surface color despite changes in the illumination or surrounding context. Studies of these adaptation processes have traditionally measured the changes in sensitivity or appearance as observers are exposed and thus adapted to a stimulus. In the present study we have explored an alternative approach, in which the images are instead adapted to the observer. In a recent paper we noted that images can in principle be transformed to simulate how an observer would adapt to them, and that this transformation could allow an observer to immediately “see” the images in a way that could increase visual performance 8. For example, we showed that finding a novel color within a background of colors is easier and faster if the individual is first adapted to the average color of the background - and in turn, would be easier if the image itself were first adapted to remove the average color. Here we use an empirically-based model of color adaptation and apply this to a range of images to predict how color appearance changes as the environment changes. The world itself is not homogeneous in its color properties and varies markedly in different locations or within the same location as the lighting or seasons change 9, 10. We adapted images for these changes by equating the responses of putative color mechanisms across the different environments. These adjustments could optimize images for the observer, improving visual performance. They also allow one to simulate how color might appear to individuals living in different contexts, or might appear to different individuals with different sensitivities when they are exposed to the same color environment.
2. METHODS 2.1 Model We modeled the encoding of color as a standard two-stage process in which the color signal is first represented by the activity in the long, medium, and short wavelength cones (L, M, and S) and then the signals from the cones are added or subtracted to form non-opponent or opponent post-receptoral mechanisms that respond to the luminance and chromatic contrasts in the signal. The spectral sensitivities were based on the Smith and Pokorny fundamentals 11 and the contrasts in the image are represented in terms of a modified version of the MacLeod-Boynton chromaticity diagram 12 which represents colors at constant luminance (L+M) in terms of two chromatic dimensions corresponding to the difference in excitation of the L and M cones [L/(L+M), or LvsM] or the difference between signals in the S cones versus the combined response of the L and M cones [S/(L+M) or SvsLM]. These dimensions characterize how color is thought to be encoded at early post-receptoral stages of the visual system 13. In our space the origin was set to a neutral gray corresponding to illuminant C, and contrasts along the LvsM and SvsLM axes and along the achromatic axis [LUM] were scaled based on previous measurements of the relative sensitivity and adaptation strength along the three dimensions 14. The resulting contrasts are related to the r,b coordinates of the MacLeod-Boynton space by the following equations: LvsM = [(L/L+M) - .6568] * 1955. SvsLM = [(S/L+M) - .01825] * 5533. LUM = [(Lumi - Lummean)/Lummean] * 70. where .6568, .01825 are the MacLeod-Boynton coordinates of Illuminant C, and LUM represents the luminance contrast of the signal relative to the mean luminance for the image. Chromatic contrast adaptation effects are selective for many different directions in color space 14. This is consistent with adaptation within multiple mechanisms each tuned to a different color and luminance direction, so that color is represented by the population response across a large number of mechanisms, in an analogous way to how orientation might be represented by the distribution of responses across channels tuned to different tilts. For the purpose of the model we defined mechanisms at intervals of 45 deg both within the isoluminant plane and within each corresponding chromatic and luminance plane. We assume that actual color mechanisms sample the space more finely yet steps of 45 deg have been shown to be sufficient for describing the adaptation effects 15. This gave 26 different color-luminance mechanisms. Each was assumed to be drawn from a different linear combination of the cone signals, so that its sensitivity varied as the cosine of the preferred color direction. The sensitivities were also half-wave rectified so that there was no response to signals greater than +90 deg from the preferred direction. Thus the two poles of a given axis
6806-29 V. 2 (p.2 of 10) / Color: No / Format: Letter / Date: 1/25/2008 10:03:18 PM SPIE USE: ____ DB Check, ____ Prod Check, Notes:
Please verify that (1) all pages are present, (2) all figures are acceptable, (3) all fonts and special characters are correct, and (4) all text and figures fit within the margin lines shown on this review document. Return to your MySPIE ToDo list and approve or disapprove this submission.
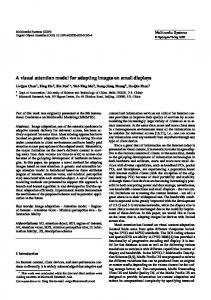
(e.g. +LvsM or –LvsM), or pure luminance increments or decrements were encoded by different mechanisms. Finally the color-luminance contrasts were given by the vector sum of the responses of all mechanisms. Because their sensitivities overlap, the summed responses were scaled so that for the unadapted model the sum equaled the original signal contrast. For the set of mechanisms we used this required dividing the net chromatic contrast by 4 and the net luminance contrast by 5. The resulting contrasts could then be projected back into the LvsM, SvsLM and LUM axes and from these transformed back to corresponding RGB values for the image. 2.2 Adaptation Adaptation was modeled as two successive response changes corresponding to independent gain changes at both the receptoral and post-receptoral sites. Multiplicative gain changes in the cones – a process known as von Kries adaptation rescales the cone responses so that the average response to the color in the image approaches the response to a neutral gray 16, 17. Complete von Kries adaptation removes completely any average bias in the luminance or chromaticity of the image, and was implemented in the model by rescaling all L, M, and S responses so that the mean response equaled the cone responses to an equal energy white with a mean nominal luminance corresponding to an RGB value of 128 in the image. Adaptation in post-receptoral mechanisms was similarly implemented by rescaling the response of each mechanism so that the mean response equaled the response to a reference contrast. This reference could correspond to a uniform distribution of contrasts within the color-luminance space, or could correspond to the set of contrasts defined by a reference image or environment. We used the latter by adjusting images from one environment so that the average mechanism responses were equal to the mean responses for the reference environment. For both von Kries scaling and contrast scaling the averages were taken uniformly over the entire image. It should be noted that empirical measurements of contrast adaptation do not follow a simple multiplicative scaling and instead are intermediate to this adjustment and a subtractive change, in which the response is adjusted by removing a fixed constant 14, 18. (Moreover, even light and chromatic adaptation include both multiplicative and subtractive response changes 19.) Thus in this sense our model does not capture aspects of how the visual system may adapt. However, a subtractive change has large effects only at low contrasts, and this cannot readily explain how the perceptual gamut is matched to the full range of contrasts in images. This match itself suggests that adaptation at longer time scales than is typically measured in the laboratory might behave differently and rescale the responses to image contrasts, and this is the adjustment we assume. Rescaling is also the adjustment predicted by models of adaptation based on coding efficiency 6, 20 . 2.3 Image sets We used the model to transform images of natural outdoor scenes taken from a diverse range of different environments. In a recent study Webster, Mizokami, and Webster 10 reported analyses of the color statistics of a large database of calibrated color images taken at different seasons in both the Western Ghats of India and the Sierra Nevada Mountains in the United States. There are characteristic seasonal variations in the color distributions at both locales. In wetter periods vegetation is greener and the range of chromatic contrasts in the images tends to vary predominantly along the SvsLM dimension of color space. As the environment becomes more arid and thus less verdant the mean color shifts primarily along the LvsM axis toward yellow, while the contrasts tend to rotate toward a bluish-yellowish axis intermediate to the SvsLM and LvsM cardinal axes. We used images from the India set during wet or dry seasons to simulate how color perception should change with adaptation as the seasons change. We also acquired images from the internet that are representative of a number of other environments. These included arctic and desert regions, where there is little vegetation, and as an example of a more extreme environmental variation, images taken in turbid underwater settings. Figure 1 plots the color distributions for these 5 environments, based on the average of dozens of individual images “characteristic” of each context. (Note these plots show only the chromatic content and not the luminance variations.) The plots show the mean chromaticity and principal axis of chromatic contrast for each set, and also plot the average response to the images of chromatic mechanisms tuned to 22.5 deg intervals within the isoluminant plane. So that they would be comparable to the other contexts, the distributions for the India images are based on the original, uncalibrated digital photos. The figures show that there are substantial changes across
6806-29 V. 2 (p.3 of 10) / Color: No / Format: Letter / Date: 1/25/2008 10:03:18 PM SPIE USE: ____ DB Check, ____ Prod Check, Notes:
Please verify that (1) all pages are present, (2) all figures are acceptable, (3) all fonts and special characters are correct, and (4) all text and figures fit within the margin lines shown on this review document. Return to your MySPIE ToDo list and approve or disapprove this submission.
scenes in the average color, in the range of contrasts, and in the principal axes of the contrast variations, all of which the visual system adapts to. We therefore modeled this adaptation by adjusting mean and contrast responses in the model so that the average mechanism responses in one environment were equated to the average responses in a different environment. Again this allowed us to simulate how color perception might change as an observer moves from one environment to another.
Figure 1. Color distributions measured for 5 outdoor environments. Each plot shows the mean chromaticity (gray circle) and principal axis of chromatic contrast (gray line), and also plots the mean response of mechanisms tuned to angles at 22.5 deg intervals in the isoluminant plane. The India monsoon responses are replotted in each panel for comparison.
6806-29 V. 2 (p.4 of 10) / Color: No / Format: Letter / Date: 1/25/2008 10:03:18 PM SPIE USE: ____ DB Check, ____ Prod Check, Notes:
Please verify that (1) all pages are present, (2) all figures are acceptable, (3) all fonts and special characters are correct, and (4) all text and figures fit within the margin lines shown on this review document. Return to your MySPIE ToDo list and approve or disapprove this submission.
Figure 2. Illustration of adapting imaging for seasonal variations in color. Top panels show color distributions for a pair of images in India captured during rainy (left) or dry (right) seasons. Lower panels show the transformed distributions when the model responses for one environment are adapted to equate them to the mean responses from the other environment.
6806-29 V. 2 (p.5 of 10) / Color: No / Format: Letter / Date: 1/25/2008 10:03:18 PM SPIE USE: ____ DB Check, ____ Prod Check, Notes:
Please verify that (1) all pages are present, (2) all figures are acceptable, (3) all fonts and special characters are correct, and (4) all text and figures fit within the margin lines shown on this review document. Return to your MySPIE ToDo list and approve or disapprove this submission.
Figure 3. Transformation of color distributions when responses to scenes from low-contrast underwater environments are adapted to equate the responses for the average response to a terrestrial environment (dry season in India).
6806-29 V. 2 (p.6 of 10) / Color: No / Format: Letter / Date: 1/25/2008 10:03:18 PM SPIE USE: ____ DB Check, ____ Prod Check, Notes:
Please verify that (1) all pages are present, (2) all figures are acceptable, (3) all fonts and special characters are correct, and (4) all text and figures fit within the margin lines shown on this review document. Return to your MySPIE ToDo list and approve or disapprove this submission.
3. RESULTS Figure 2 shows an example of how color coding and color salience might change as observers transition from a lush to arid environment. Color images illustrating these adaptation effects are available on request from the authors. The two top panels plot the original distribution of colors for a pair of scenes in India taken from a similar viewpoint during the monsoon or winter (dry) seasons. During the monsoon the area is lush green and, as noted above, color variations relative to this average vary primarily along the SvsLM dimension. Von Kries adaptation would therefore tend to remove this green bias while contrast adaptation will selectively reduce sensitivity and thus perceived contrast along the SvsLM dimension. This leads to noticeable desaturation of the green in the scenes, and thus greens become less dominant as the observer acclimates to the environment. These effects are illustrated in the lower left panel, which plots the change in the color distribution when the monsoon scene is adapted to give the same average chromatic responses that occur for the arid environment. Conversely, for arid scenes, green foliage is instead rare, and adapting to the mean and contrasts of such scenes instead boosts the response to these greens and thus heightens their perceptual salience. These changes are illustrated in the lower right panel, in which the responses to the arid scene are now matched to the average responses for the monsoon environment. These changes are striking in visual inspection of the transformed images. For example, sparse green regions in the arid scenes become highly pronounced. They also fit with anecdotal reports where it is frequently claimed that the arid regions appear greener to observers living in them. The same changes are more pronounced in going from the India to desert or arctic scenes, since the color differences for these scenes are larger. For the latter areas, the characteristic colors are very strongly biased along a bluish to yellowish or orange axis, so that there is a high negative correlation between signals along the SvsLM and LvsM axes. Adapting these images for color responses to lusher environments again strongly accentuates rare colors like green in the scenes, thus highlighting them for an observer. Parenthetically, the blue-yellow bias evident in these scenes is in fact present in most scenes, including many with dense vegetation 21, but the present analysis suggests it becomes highly pronounced in regions of the world that lack vegetation. If the LvsM and SvsLM dimensions evolved to efficiently represent the colors characteristic of primate environments (e.g. lush forests) 22, then that environment is not characteristic of the colors in most regions of the world. Alternatively, it is interesting to note the emergence of a blue-yellow axis, which is considered a principal dimension of color appearance 23. The perceptual salience of this axis has been associated with variations in daylight, which lie very close to a perceptual change from pure blue to yellow 24, 25. Yet this axis might also be tied to characteristics of the scenes themselves. In this regard, it is noteworthy that Webster et al. 10 found that the seasonal changes in color were not due to seasonal differences in illumination. Figure 3 shows an example of these adaptation effects for the underwater environment. The underwater images had a strong blue bias and low contrast, and thus appear relatively homogenous and featureless. We also explored how adaptation might alter the appearance of images of the Martian surface, which alternatively appears relatively monochrome red and has strong luminance contrast but little chromatic contrast. However, adapting either for the responses of the terrestrial earth scenes expands the perceptual gamut and thus brings out a full range of hues and lightnesses. This causes many objects which tend be hidden in the original image to stand out in strong contrast to the background in the adapted images, and would presumably be much more noticeable to an observer adapted to those environments.
4. DISCUSSION We have used a model that approximates established principles of color coding and adaptation in the human visual system 16 to simulate how color appearance should change as observers become adapted to different color environments. The model adjusts the color and luminance responses to one environment to match the responses for a different environment. This produces large changes in the perceived colors in the images, and in particular tends to de-emphasize the characteristic colors for an environment while highlighting novel colors. Adapting images in this way offers a number of potential advantages for understanding color coding and color adaptation and for improving visual performance. These include the following: 1. One proposed function of adaptation is to match the response range of mechanisms to the range of stimulus levels in order to more accurately signal stimulus differences 7. Adapting images to be consistent with the observer’s current state of adaptation amounts to transforming the colors to match the gamut for which the observer is already in theory
6806-29 V. 2 (p.7 of 10) / Color: No / Format: Letter / Date: 1/25/2008 10:03:18 PM SPIE USE: ____ DB Check, ____ Prod Check, Notes:
Please verify that (1) all pages are present, (2) all figures are acceptable, (3) all fonts and special characters are correct, and (4) all text and figures fit within the margin lines shown on this review document. Return to your MySPIE ToDo list and approve or disapprove this submission.
optimized. Thus this should allow individuals viewing the images to distinguish colors more quickly and more reliably. In fact this is obvious in scenes such as the underwater environment, where objects that were unnoticeable become clearly differentiated. Of course, this is a necessary consequence of removing the mean hue and boosting the contrast. However, by modeling the actual contrast changes, the scene can more closely approximate the contrasts real observers are exposed to and thus optimized for. 2. A second possible advantage of adaptation is to draw attention to novel features of the world by effectively discounting routine properties 26. We have found evidence for such improvements previously in a visual search task: subjects are faster at finding a unique color target if they are first adapted to the set of background colors 27, 28. In the present analysis this functional gain is achieved in our model by boosting the contrast of rarer colors in the environment. Our qualitative impressions of the images suggests that for the arid scenes exemplified in Figure 2, adapting them relative to the lush scenes not only increased the saturation of green regions but made them much more noticeable. Once again this could be seen as a trivial consequence of weighting contrasts by their rarity in the image. However, importantly this weighting was achieved by asking how the real human visual system might re-weight the signals, and thus might better approximate the color changes that the real visual system is designed to encode. 3. A third commonly proposed role of color adaptation is that it helps aid color constancy. One form of constancy involves preserving the perceived color of surfaces by discounting variations in lighting in the scene. In this case it is less likely that transforming images in the way we have will help observers to maintain constancy, since much of the variation across environments or seasons results from changes in the surfaces themselves. On the other hand, constancy may be facilitated for cases such as the underwater scenes since the simulated adaptation helps to remove the filtering effects of the medium. The fact that adaptation may not always promote constancy for illumination changes is not a failing of the model but rather reflects the nature of the adaptation processes themselves. In particular, response changes that improve coding efficiency are not always compatible with the changes that would allow surface colors to remain stable, even when the source of the stimulus variation is an illuminant change 29.However, a second and potentially more important form of constancy involves maintaining stable perceptions despite changes in the observer, for example as their spectral sensitivity changes with age 2. In this case the transformed images do capture this stability because they will always renormalize the changing observer to the same color environment and thus discount the observer variation (as we discuss further in point 6). 4. A particularly important advantage of simulating adaptation is that it obviates the need for the observer to adapt. This could prove valuable for allowing an observer to immediately inspect and interact with image sets in an optimal state, without requiring a period of acclimation. This is also potentially important because the actual time course of adaptation may be very protracted 30 and, as we noted above, at longer time scales may result in different patterns of change than the kinds that are revealed in measurements of short-term aftereffects (e.g. in the form of the changes in the contrast response function). To the extent that a model of the type we used actually simulates longer-term adjustments in color coding, it provides a novel technique for exploring some of the functional implications of adaptation processes. For example, improved discrimination with adaptation is readily seen for light or chromatic adaptation but has not been consistently found for discriminating contrast or patterns 4. These failures may miss the performance improvements provided by adaptation if they fail to fully adapt the observer. By instead testing observers with images that mimic complete adaptation it may be possible to more directly evaluate some of the design principles driving adaptation. Alternatively, even if actual observers would never show the full degree of perceptual changes that the model assumes, it could nevertheless improve their performance if the adaptation increases the availability of information relevant to tasks such as distinguishing elements in the scene or identifying statistical outliers. 5. An intriguing application of adapting images is that it simulates how the world might look to us as we move to different color contexts. For example, our simulations show how in principle color appearance can shift with changes in the seasons or between observers living in different settings. It remains a contested question to what extent color perception and color naming is similar across different cultural groups and what factors might shape similarities or differences 31. One possible factor is the extent to which environments themselves are similar or different 32. Models of the kind we proposed could be used to evaluate the changes in color across different environments and the degree to which this might modulate basic color categories. Adapting images to match coding for the observer’s current environment also allows us to simulate how color perception might be shaped by completely novel environments, such
6806-29 V. 2 (p.8 of 10) / Color: No / Format: Letter / Date: 1/25/2008 10:03:18 PM SPIE USE: ____ DB Check, ____ Prod Check, Notes:
Please verify that (1) all pages are present, (2) all figures are acceptable, (3) all fonts and special characters are correct, and (4) all text and figures fit within the margin lines shown on this review document. Return to your MySPIE ToDo list and approve or disapprove this submission.
as under water or on the surface of Mars. This could provide a seemingly whimsical yet nevertheless plausible glimpse of the phenomenology of color vision within entirely new worlds. 6. Just as the adaptation reveals how the same observer might experience color in different environments, it can also provide a method for visualizing what images look like to individuals within the same environment but with different sensitivity limits. Many algorithms are in fact available to simulate how the world looks to an individual with a visual deficiency (e.g. color blindness) or as sensitivity changes with development. Typically these involve adjusting the images for the reduced chromatic or spatial sensitivity of the observer and are designed to reveal what residual information is available. However, if the processes of adaptation are intact then these variant observers should again adapt to match their perceptual gamut to the world. Consistent with this, Macleod, an anomalous trichromat, noted that his own visual experience of the world did not seem deficient in reds and greens even though he was less able to discriminate them 33. Thus incorporating some model of adaptation is important to actually simulate what the world looks like to an individual with reduced color vision. Of course, adaptation cannot undo a sensitivity loss in the observer if gain changes increase both the signal and noise. Simulations of reduced vision could therefore incorporate noise to represent these sensitivity limits. 7. A related application is to ask how perception changes as observers themselves change, for example because of aging or progressive disease, or during recovery. For instance, models of the kind we used can simulate what the world looks like through a cataract, and perhaps more importantly, what the world will look like when the cataract is removed. This could allow clinicians to better anticipate the perceptual changes that might follow a correction. Two points are notable in this regard. First, the visual changes following surgery can show a very long time course 30. Second, it is common for patients to report discomfort after a visual correction, and this is in part likely to be because they are not appropriately adapted for their improved retinal image. Adapting images can provide insights into these perceptual experiences and could also provide a way of compensating for them by adjusting images to remain more consistent with their adapted state. While we have attempted to model only the changes in color perception, the principles we have explored are very general, and could be applied to many different attributes of the stimulus. For example, images could similarly be adapted to adjust for differences in spatial statistics, and indeed our model of color coding is incomplete in that it does not include the spatial selectivity of luminance and chromatic mechanisms. The development of more general models is limited by knowledge of how more complex image attributes are encoded by the visual system and how it adapts to these attributes. However, as this knowledge grows we argue that simulations of adaptation processes will continue to grow in utility for both exploring and enhancing visual performance.
ACKNOWLEDGMENTS Supported by EY-10834 *Corresponding author MAW:
[email protected]
REFERENCES 1. Stockman, A. and L.T. Sharpe, Cone spectral sensitivities and color matching, in Color Vision: From Genes to Perception, K.R. Gegenfurtner and L.T. Sharpe, Editors. 1999, Cambridge University Press: Cambridge. 2. Werner, J.S. and B.E. Schefrin, Loci of achromatic points throughout the life span. Journal of the Optical Society of America A, 1993. 10: p. 1509-1516. 3. De Valois, R.L., et al., Some transformations of color information from lateral geniculate nucleus to striate cortex. Proceedings of the National Academy of Science, 2000. 97: p. 4997-5002. 4. Webster, M.A., Pattern selective adaptation in color and form perception, in The Visual Neurosciences Volume 2, L.M. Chalupa and J.S. Werner, Editors. 2003, MIT Press: Cambridge. p. 936-947. 5. Webster, M.A., Human colour perception and its adaptation. Network: Computation in Neural Systems, 1996. 7: p. 587-634.
6806-29 V. 2 (p.9 of 10) / Color: No / Format: Letter / Date: 1/25/2008 10:03:18 PM SPIE USE: ____ DB Check, ____ Prod Check, Notes:
Please verify that (1) all pages are present, (2) all figures are acceptable, (3) all fonts and special characters are correct, and (4) all text and figures fit within the margin lines shown on this review document. Return to your MySPIE ToDo list and approve or disapprove this submission.
6. Atick, J.J., Z. Li, and A.N. Redlich, What does post-adaptation color appearance reveal about cortical color representation? Vision Research, 1993. 33: p. 123-129. 7. MacLeod, D.I.A. and T. von der Twer, The pleistochrome: optimal opponent codes for natural colours, in Colour Perception: Mind and the Physical World, R. Mausfeld and D. Heyer, Editors. 2003, Oxford University Press: Oxford. p. 155-184. 8. Webster, M.A., K. McDermott, and G. Bebis, Fitting the world to the mind: Transforming images to simulate perceptual adaptation. Lecture Notes in Computer Science, in press. 9. Webster, M.A. and J.D. Mollon, Adaptation and the color statistics of natural images. Vision Research, 1997. 37: p. 3283-3298. 10. Webster, M.A., Y. Mizokami, and S.M. Webster, Seasonal variations in the color statistics of natural images. Network: Computation in Neural Systems, 2007. 18: p. 213-233. 11. Smith, V.C. and J. Pokorny, Spectral sensitivity of the foveal cone photopigments between 400 and 500 nm. Vision Research, 1975. 15: p. 161-171. 12. MacLeod, D.I.A. and R.M. Boynton, Chromaticity diagram showing cone excitation by stimuli of equal luminance. Journal of the Optical Society America, 1979. 69: p. 1183-1186. 13. Derrington, A.M., J. Krauskopf, and P. Lennie, Chromatic mechanisms in lateral geniculate nucleus of macaque. Journal of Physiology, 1984. 357: p. 241-265. 14. Webster, M.A. and J.D. Mollon, The influence of contrast adaptation on color appearance. Vision Research, 1994. 34: p. 1993-2020. 15. Lennie, P., Color coding in the cortex, in Color Vision: From Genes to Perception, K.R. Gegenfurtner and L.T. Sharpe, Editors. 1999, Cambridge University Press: Cambridge. p. 235-247. 16. Webster, M.A. and J.A. Wilson, Interactions between chromatic adaptation and contrast adaptation in color appearance. Vision Research, 2000. 40: p. 3801-3816. 17. Wuerger, S.M., Color appearance changes resulting from iso-luminant chromatic adaptation. Vision Research, 1996. 36: p. 3107-3118. 18. Georgeson, M.A., The effect of spatial adaptation on perceived contrast. Spatial Vision, 1985. 1: p. 103-112. 19. Hayhoe, M. and P. Wenderoth, Adaptation mechanisms in color and brightness, in From Pigments to Perception, A. Valberg and B.B. Lee, Editors. 1991, Plenum: New York. p. 353-367. 20. Zaidi, Q. and A.G. Shapiro, Adaptive orthogonalization of opponent-color signals. Biological Cybernetics, 1993. 69: p. 415-428. 21. Webster, M.A. and J.D. Mollon, Adaptation and the color statistics of natural images. Vision Research, 1997. 37: p. 3283-3298. 22. Ruderman, D.L., T.W. Cronin, and C.-C. Chiao, Statistics of cone responses to natural images: implications for visual coding. Journal of the Optical Society of America A, 1998. 15: p. 2036-2045. 23. Hurvich, L.M. and D. Jameson, An opponent-process theory of color vision. Psychological Review, 1957. 64: p. 384404. 24. Mollon, J., Monge: The Verriest Lecture, Lyon, July 2005. Visual Neuroscience, 2006. 23: p. 297-309. 25. Shepard, R.N., The perceptual organization of colors: an adaptation to regularities of the terrestrial world?, in The Adapted Mind, J. Barkow, L. Cosmides, and J. Tooby, Editors. 1992, Oxford University Press: Oxford. 26. Barlow, H.B., A theory about the functional role and synaptic mechanism of visual after-effects, in Vision: coding and efficiency, C. Blakemore, Editor. 1990, Cambridge University Press: Cambridge. p. 363-375. 27. McDermott, K., et al., Visual Search and eye movements in novel and familiar contexts. In Rogowitz, B.E. and Pappas, T.N. (Eds.), Human Vision and Electronic Imaging, SPIE, 2006. 4622: p. 1-11. 28. Webster, M.A., V.E. Raker, and G. Malkoc. Visual search and natural color distributions. In Rogowitz, B.E. and Pappas, T.N. (Eds.), Human Vision and Electronic Imaging, SPIE, 1998, 3299: p. 498-509. 29. Webster, M.A. and J.D. Mollon, Colour constancy influenced by contrast adaptation. Nature, 1995. 373: p. 694-698. 30. Delahunt, P.B., et al., Long-term renormalization of chromatic mechanisms following cataract surgery. Visual Neuroscience, 2004. 21: p. 301-307. 31. Steels, L. and T. Balpaeme, Coordinating perceptually grounded categories through language: a case study for colour. Behavioral and Brain Sciences, 2005. 28: p. 469-489. 32. Yendrikhovskij, S.N., Computing color categories from statistics of natural images. Journal of Imaging Science and Technology, 2001. 45: p. 409-417. 33. MacLeod, D.I.A., Colour discrimination, colour constancy and natural scene statistics, in Normal and Defective Colour Vision, J.D. Mollon, J. Pokorny, and K. K., Editors. 2003, Oxford University Press: Oxford.
6806-29 V. 2 (p.10 of 10) / Color: No / Format: Letter / Date: 1/25/2008 10:03:18 PM SPIE USE: ____ DB Check, ____ Prod Check, Notes: