Available online at www.sciencedirect.com
Procedia Engineering 13 (2011) 451–456
5th Asia-Pacific Congress on Sports Technology (APCST)
ADAT: A Matlab toolbox for handling time series athlete performance data Daniel A. Jamesab*, Andrew Wixteda a
b
Centre for Wireless Monitoring and Applications, Griffith University, Brisbane, Qld Australia Centre of Excellence for Applied Sports Science Research, Queensland Academy of Sport, Brisbane Qld, Australia Received 19 March 2011; revised 14 May 2011; accepted 16 May 2011
Abstract The treatment and handling of large quantities of time series sensor data is a particular challenge for the sport science community. Significant quantities of data can be generated during routine training sessions that involve multi-sensor monitoring on multiple limb segments. Whilst sensor devices are commonplace, the data formats, available sensors and acquisition rates vary considerably. Additionally sensor fusion is of increasing interest where multiple data sets from multiple sources are required to be combined. In this paper we present a set of tools that have been developed over the last 5 years to help meet this emerging challenge. The tools are based on the popular computational environment Matlab, which allows rapid customisation of routines, together with complex analysis and visualisation tools to be used by technical and non-technical researchers alike. Using these developed tools data gained from a variety of sources (including video) can be combined together, visualised and processed using over 50 processing and visualisation tools. The toolbox is designed to automatically annotate data sets to keep track of signal processing steps and maintain original data source integrity. It can also be easily extended and customised for individual applications. At its core is the ‘athdata’ data structure, which can accommodate multiple channels and kind of data at a variety of sample rates, annotations and unlimited processing steps. A sample import tool has been developed for users to easily apply the toolbox to their own data sets and real-time streaming of data into the toolbox is also possible. When adopted as a research team tool it facilitates the sharing of developed processing and visualisation steps, it also enables a faster path to application for new researchers joining any team
© 2011 Published by Elsevier Ltd. Selection and peer-review under responsibility of RMIT University Keywords: Athlete data; time series data; inertial sensors; computation
* Corresponding author. Tel.: +61-73735-5036; fax: +61-73735-5384. E-mail address:
[email protected].
1877–7058 © 2011 Published by Elsevier Ltd. doi:10.1016/j.proeng.2011.05.113
452
Daniel A. James and Andrew Wixted / Procedia Engineering 13 (2011) 451–456
1. Introduction Technology continues to transform many aspects of our lives. The adoption of technology into sport is no exception where advances in materials, equipment design, clothing and more recently video, GPS and micro sensors have all had an impact on the practice and performance of sport. Today nearly all professional sports routinely use video based analysis and sensor based analysis to help in the monitoring and improvement of their athletes. The range of sports where micro sensors have been used is extensive, accelerometers have been used in half-pipe snowboarding to detect air time and activity, in rowing to monitor athlete biomechanics and boat movement through the water, in running to generate force-plate simulations, contact time, step rate and other biomechanical information, in football to estimate energy expenditure, in swimming to count laps, monitor lap times and stroke rate. Coupled with high precision GPS these sensors give researchers the means to monitor the position, orientation, activity velocity and aspects of biomechanics of runners, skiers, football players and rowing sculls just to name a few. Emerging from the adoption of these technologies is the need for adequate resources to make best use of these technologies. In the case of sensor data and fusion of data a flexible way to analyse the data beyond visual inspection and the capabilities of spreadsheet tools is an emerging requirement. The ADAT toolbox was developed in house over the period of some years to meet the needs of a research environment that specializes in the adoption of inertial [1-3] and other time series data sensors. This paper describes the requirements that led to such a toolbox for a variety of years. Also described is the vision for the toolbox for the future together with some sample functions. The toolbox is freely available upon request under the creative commons license. The toolbox is a snapshot in time of its current development and it is hoped that the tool may enjoy application and further development by other users. 2. Requirements The handling and integration of time series data, from differing data sources such as inertial sensors, video frames, GPS, force sensors is a complex task. Data from differing sample rates, data formats, calibration data all need to be collected, integrated and synchronized. There are differing levels of users from the technical through to application level users. Users of the toolbox need to have access to standard processing techniques such as calibration, filtering, visualization and yet be able to customize further with a short development time. The developed tools should have the computational efficiency of low level code but operate at a high level, yet not have the draw back of needing to be compiled or developed. Thus the developed tool could evolve rapidly. The tools should handle large data sets and preserve the integrity of the original data. In any technological discipline, technology advances rapidly, thus any developed tools should be reasonably future proof. Thus the tools foundation environment/language should be widely used in the scientific community where future support is assured for the environment. Ideally the tools would be scalable to take advantage of multicore processing, parallel computing and cloud based implementation. The environment should be portable across multiple platforms. 3. ADAT Toolbox The ADAT toolbox was developed for the high performance computing environment Matlab. A range of operating environments were considered included languages such as C, the .NET framework, computational environments such as Matlab, Mathematica and more conventional generalized environments such as spreadsheets and SPSS.
Daniel A. James and Andrew Wixted / Procedia Engineering 13 (2011) 451–456
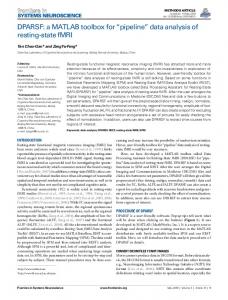
The Matlab environment is popular and offers considerable flexibility through its interpreted environment with precompiled modules for numerical processing that given it the flexibility of working in the run-time environment, together with efficient computational time. Additionally the Matlab environment offers many toolbox’s for scientific endeavors, include a parallel processing toolbox, together with real-time data acquisition from sensors, database integration and code portability across many operating systems. 4. Functional Specification The ADAT toolbox uses structures within Matlab to append metadata to data sets. The structure is designed to be flexible for specific data sets and uses annotation meta data. Figure 1 shows the data structure. Additional data types can be added for different sensor data including different sample rates
Fig. 1. ADAT data structure
There are a number of functions currently available. These include data loading and viewing functions, signal processing functions, transformation functions and general arithmetic functions. A function is described by its name, the parameters it is passed and the value it returns (if any). A function may not only process data and return a value but also modify its environment in some way. The file conversion functions can read text data files, convert the data to athdata format and both return the data to the calling function as well as write the data to disk. The ADATview function accepts a single parameter, does not return any value but modifies the environment (displays a graph). The core tools are summarized in Table 1.
453
454
Daniel A. James and Andrew Wixted / Procedia Engineering 13 (2011) 451–456
Table 1. Sample of ADAT core functions divided into visualization, filtering and processing categories respectively. ADAT Function Name
Description
ADAT3Dtrace
(script) Convert data into a 3-D representation and trace the path.
ADATEnergyHistogram
Displays a histogram of time at each energy level, returns the results.
ADAT_fc
Filter a dataset and compare filtered & unfiltered versions.
ADAToverlay
View one data-set overlaid on another.
ADATplotall, ADATplot3D
Plot all data 2-dimensionally (all channels) or 3-dimensionally.
ADATplotPolar
View data as vector lengths vs. vector angles.
ADATpattern
Allows selection of data of interest for graphing in different ways
ADATRollingFFT
Display second by second FFT results and return the results.
ADATStrideDetection
Displays stride-rate/energy/distance vs. time and returns the results.
ADATview, ADATview2
View all channels of one or two athdata data-sets in subplots
ADATdespike
Remove short duration noise spikes.
ADATfilter
Filter the data using a hamming filter
ADAThamming
Generates a Hamming filter for use by ADATfilter.
ADATsmooth
Simple Averaging or Smoothing.
ADATclip
Manual truncation of data set.
ADATtag
Manual tagging of data of interest.
ADATadd, ADATsubtract
Add or subtract two data sets element by element.
ADATAlanLaiCalibrate
A 6 point calibration routine for accelerometers [add ref]
ADATcombinedvector
Combine channels into a single vector (magnitude only)
ADATdifference
Calculate differences between successive samples
ADATenergy
Calculate energy
ADATEnergySum
Sum energy over specified periods
ADATfft
Perform Fast Fourier Transform (convert to frequency)
ADATManualEnergy
Calculate energy using a selected gravity point.
ADATManualRotate
Rotate the data-set to make one channel vertical.
ADATmultiply
Multiply two data sets
ADATpolar
Convert from rectangular to polar coordinates.
ADATregenerateDPCM
Convert sample differences to original data set.
ADATremoveAverage
Calculate an average and remove form the data.
ADAT_Rxy
Calculate auto or cross-correlation factors.
Note: the term energy refers to the RMS of the signal over different time periods and is used as an estimator of athlete energy expenditure.
Daniel A. James and Andrew Wixted / Procedia Engineering 13 (2011) 451–456
5. Results The example below shows the syntactical use of the tool box in the Matlab runtime environment and demonstrates the kind of graphical output that can be generated. It demonstrates the process from data capture to displaying energy. Not all parameters are explained. NOTE: ‘>>’ denotes the Matlab prompt >> a=ADATconv("test1.txt"); convert sensor text data into athdata variable a >> ADATview(a); view original data >> b=ADATcombinedVector(a,0,1,2,3); combine channels 1,2 &3 into b >> c=ADATenergy(b,-1); create 1 sec ‘energy’ data into c >> figure; cause a new figure to be created >> ADATview(c); display energy graph. In this example there are three athdata type variables, a, b, c. Athlete data in all variables has been retained, some fields have been annotated to record the processing steps that have occurred. The above functions can be short cut and no intermediate variables created. >> a=ADATconv("test1.txt"); convert sensor text data into athdata variable a >> ADATview(a); view original data >> figure; ADATview(ADATenergy(ADATcombinedVector(a,0,1,2,3),150)); 5.1. Sample graphical output athdata ADATEnergyHistogram(athdata athdata [,float summingTime [,integer categoryWidth [,integer startTime [,integer timePeriod]]]] ) Inputs: athdata athdata object containing the data you wish to view (compulsory parameter) summingTime defines time period over which to integrate energy. (optional, default=0.25s) categoryWidth width of energy categories (optional, default 25). startTime time to start calculation (seconds) (optional, default 0). timePeriod elapsed time (seconds) (optional, default startTime to end of data). In the example below, “source” is unprocessed acceleration data. The acceleration data is calibrated then the ADATsubtract and ADATfilter function are combined to generate a 1Hz high pass output. The three channel 1Hz high-pass data is converted to a signal magnitude using ADATcombinedvector. The magnitude signal is summed in this example in 0.25 second intervals (the default for the histogram function) before being displayed in a histogram. This gives an estimated energy expenditure from accelerometer data. cal=ADATManualCalibrate(source); ener=ADATcombinedvector(ADATsubtract(cal,ADATfilter(cal,800,1)),-1,1,2,3) ADATEnergyHistogram(ener)
455
456
Daniel A. James and Andrew Wixted / Procedia Engineering 13 (2011) 451–456
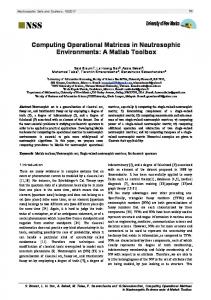
6. Conclusions The ADAT Matlab toolbox has been developed and in use for some years within our research group. It has proven to be a useful tool for handling time series data. It continues to evolve in functionality and applications as our research group and collaborative groups grow. It has enabled a faster start time for new researchers joining our group as a tool that encapsulates the most basic and emerging common advanced processing required for the handling of time series sensor data in sporting applications
Fig. 2. (a) Energy Histogram from accelerometer data using the ADAT function ADATEnergyHistogram; (b) filtering of accelerometer data using the ADAT function ADAT_fc Graphical Output for Single Channel Data Set. (0.8Hz Filtering)
References [1] James DA, Davey N, Rice T. An Accelerometer Based Sensor Platform for Insitu Elite Athlete Performance Analysis, IEEE Sensors conference, Vienna, 2004 [2] Davey N, Anderson M, James DA, Validation trial of an accelerometer-based sensor platform for swimming, Sports Technology 2008;1(4) :202-207 [3] Andrew Wixted, David V. Thiel, Allan, Hahn, Chris Gore, D. Pyne, Daniel A. James, "Measurement of Energy Expenditure in Elite Athletes using MEMS based inertial sensors", IEEE Sensors 2007 ;7(4):481-8