ignored or discarded as noise. For example, some ex- isting algorithms in machine learning and data mining have considered outliers, but only to the extent of ...
Algorithms
for Mining
Distance-Based Datasets
Outliers
in Large
Edwin M. Knox and Raymond T. Ng Department of Computer Science University of British Columbia Vancouver, BC V6T 124 Canada {knorr,rng}@cs.ubc.ca
experimental results showing that these cellbased algorithms are by far the best for k 5 4.
Abstract 1 This paper deals with finding outliers (exceptions) in large, multidimensional datasets. The identification of outliers can lead to the discovery of truly unexpected knowledge in areas such as electronic commerce, credit card fraud, and even the analysis of performance statistics of professional athletes. Existing methods that we have seen for finding outliers in large datasets can only deal efficiently with two dimensions/attributes of a dataset. Here, we study the notion of DB- (DistanceBased) outliers. While we provide formal and empirical evidence showing the usefulness of DB-outliers, we focus on the development of algorithms for computing such outliers. First, we present two simple algorithms, both having a complexity of O(k N’), k being the dimensionality and N being the number of objects in the dataset. These algorithms readily support datasets with many more than two attributes. Second, we present an optimized cell-based algorithm that has a complexity that is linear wrt N, but exponential wrt k. Third, for datasets that are mainly disk-resident, we present another version of the cell-based algorithm that guarantees at most 3 passes over a dataset. We provide Permission to copy without fee all or part of this material is granted provided that the copies are not made or distributed fOT direct commercial advantage, the VLDB copyright notice and the title of the publication and its date appear, and notice is given that copying is by permission of the Very Large Data Base Endowment. To copy otherwise, OT to republish, requires a fee and/or special permission from the Endowment.
Proceedings New York,
of the 24th VLDB USA, 1998
Conference
392
Introduction
Knowledge discovery tasks can be classified into four general categories: (a) dependency detection, (b) class identification, (c) class description, and (d) exception/outlier detection. The first three categories of tasks correspond to patterns that apply to many objects, or to a large percentage of objects, in the dataset. Most research in data mining (e.g., association rules [.4IS93, MTV95, MT96], classification [AGIf92], data clustering [EKSX96, NH94, ZRL96], and concept generalization [HCC92, KN96]) belongs to these 3 categories. The fourth category, in contrast, focuses on a very small percentage of data objects, which are often ignored or discarded as noise. For example, some existing algorithms in machine learning and data mining have considered outliers, but only to the extent of tolerating them in whatever the algorithms are supposed to do [AL88, EKSX96, NH94, ZRL96]. “One person’s noise is another person’s signal.” Indeed, for some applications, the rare events are often more interesting than the common ones, from a knowledge discovery standpoint. Sample applications include the detection of credit card fraud and the monitoring of criminal activities in electronic commerce [Kno97]. For example, in Internet commerce or smart card applications, we expect many low-value transactions to occur. However, it is the exceptional cases-exceptional perhaps in monetary amount, type of purchase, timeframe, location, or some combination thereof-that may interest us, either for fraud detection or for marketing reasons. IBM’s Advanced Scout data mining system has shown that data mining tools can be used to discover knowledge for strategic advantage in National Basketball Association games [BCP+97]. In Section 2.2, we give some concrete examples of detecting outliers in National Hockey League (NHL) data.
1.1
Related
Work
to optimize outlier detection.
Most of the existing work on outlier detection lies in the field of statistics [BL94, Haw80]. While there is no single, generally accepted, formal definition of an outlier, Hawkins’ definition captures the spirit: “an outlier is an observation that deviates so much from other observations as to arouse suspicions that it was generated by a different mechanism” [Haw80]. Accordingly, over one hundred discordancy/outlier tests have been developed for different circumstances, depending on: (i) the data distribution, (ii) whether or not the distribution parameters (e.g., mean and variance) are known, (iii) the number of expected outliers, and even (iv) the types of expected outliers (e.g., upper or lower outliers in an ordered sample) [BL94]. However, those tests suffer from two serious problems. First, almost all of them are univariate (i.e., single attribute). This restriction makes them unsuitable for multidimensional datasets. Second, all of them are distribution-based. In numerous situations where we do not know whether a particular attribute follows a normal distribution, a gamma distribution, etc., we have to perform extensive testing to find a distribution that fits the attribute. To improve the situation, some methods in computational statistics have been developed, which can be best described as depth-based. Based on some definition of depth, data objects are organized in layers in the data space, with the expectation that shallow layers are more likely to contain outlying data objects than the deep layers. Peeling and depth contours are two notions of depth studied in [PSSS, RR96]. These depth-based methods avoid the problem of distribution fitting, and conceptually allow multidimensional data objects to be processed. However, in practice, the computation of k-dimensional layers relies on the computation of k-dimensional convex hulls. Because the lower bound complexity of computing a k-dimensional convex hull is R(Nrtl), depth-based methods are not expected to be practical for more than 4 dimensions for large datasets. In fact, existing depth-based methods only give acceptable performance for k 5 2 [RR96]. Arning, et al. [AAR96] search a dataset for implicit redundancies, and extract data objects called sequential exceptions that maximize the reduction in Kolmogorov complexity. This notion of outliers is very different from the aforementioned statistical definitions of outliers. As will be seen shortly, it is also very different from the notion of outliers considered here, primarily because there is not an associated notion of distance and similarity measure between objects. Finally, a few clustering algorithms, such as CLARANS [NH94], DBSCAN [EKSX96] and BIRCH [ZRL96], are developed with exception-handling capabilities. However, their main objective is to find clusters in a dataset. As such, their notions of outliers are defined indirectly through the notion of clusters, and they are developed only to optimize clustering, but not 393
1.2
Distance-Based Outliers tions of this Paper
and
Contribu-
The notion of outliers studied here is defined as follows: An object 0 in a dataset T is a DB(p, D)-outlier if at least fraction p of the objects in T lies greater than distance D from 0. We use the term DB(p, D)-outlier as shorthand notation for a Distance-Based outlier (detected using parameters p and 0). This intuitive notion of outliers is consistent with Hawkins’ definition. It is suitable for situations where the observed distribution does not fit any standard distribution. More importantly, it is well-defined for k-dimensional datasets for any value of k. Unlike the depth-based methods, DB-outliers are not restricted computationally to small values of k. While depth-based methods rely on the computation of layers in the data space, DB-outliers go beyond the data space and rely on the computation of distance values based on a metric distance function.’ We do not claim that DB-outliers can replace all existing notions of outliers and can be used universally. Indeed, depth-based outliers would be more applicable than DB-outliers to situations where no reasonable metric distance function can be used. However, for numerous applications that are not readily supported by existing methods, defining a distance function is not hard. Our work builds on the premise that knowledge discovery is best facilitated by keeping a human user involved. The choice of p and D, and validity checking (i.e., deciding whether each DB(p, D)-outlier is a “real” outlier of any significance), is left to a human expert.2 The specific parts and contributions of this paper are as follows: We show that the notion of distance-based outliers generalizes the notions of outliers supported by statistical outlier tests for standard distributions. Because this material appears in our preliminary work [KN97], Section 2.1 only provides a brief summary. Algorithms, optimizations, and disk-residency were not the focus of our previous work, but are the focus here. We present two simple algorithms in Section 3 having a complexity of O(k iV2), where k and N are the dimensionality and size of the dataset, respectively. The detection of DB-outliers, unlike the depth-based approaches, is computationally tractable for values of k > 2. 1 Algorithms presented here assume that the distance function is (weighted) Euclidean. 2The values of p and D do provide indications on how “strong” an identified outlier is. Many existing approaches for finding outliers, including the depth-based approaches, do not provide such indications.
l
l
2
We present a partitioning-based algorithm in Section 4 that, for a given dimensionality k, has a complexity of O(N). The algorithm, however, is exponential on k. We show that, in some cases, this algorithm outperforms the two simple algorithms by at least an order of magnitude for k 5 4. We present a different version of the partitioningbased algorithm in Section 5 for large, diskresident datasets. We show that the algorithm guarantees at most 3 passes over the dataset. Again, experimental results indicate that this algorithm is by far the best for k 5 4.
Justification
for DB-Outliers
In this section, we provide two justifications for finding DB-outliers. The first is formal, and the second is empirical. In Section 2.1, we show how DB-outliers generalize certain statistical outlier tests. In Section 2.2, we show a few sample runs of our DB-outlier detection package using actual NHL data. 2.1
Properties
of DB(p, D)-Outliers
Definition 1 DB(p, D) unifies3 or generalizes another definition Def for outliers, if there exist specific values ~0, DO such that: object 0 is an outlier accordCl ing to Def iff 0 is a DB(po, Do)-outlier. For a normal distribution, outliers can be considered to be observations that lie 3 or more standard deviations (i.e., 2 30) from the mean p [FPP78]. Definition 2 Define DefNormal as follows: t is an outlier in a normal distribution with mean 1-1and standard deviation ~7iff 1%I 1 3. cl Lemma 1 DB(p, D) unifies DefNormal with p. = 0.9988 and DO = 0.13~7, that is, t is an outlier according to DefN o,.mal iff t is a DB(0.9988,0.13a)-outlier. Proofs of the lemmas in this section have already been documented [KN97]. Note that if the value 3~ in DefNormal is changed to some other value, such as 4~, the above lemma can easily be modified with the corresponding po and DO to show that DB(p, D) still unifies the new definition of DefNormal. The same general approach applies to a Student t-distribution, which has fatter tails than a normal distribution. The principle of using a tail to identify outliers can also be applied to a Poisson distribution. Definition 3 Define Defpoisson as follows: t is an outlier in a Poisson distribution with parameter p = 3.0 0 ifftL8. Lemma 2 DB(p, D) unifies Defpoisson with 0.9892 and DO = 1.
po = 0
3DB-outliers are called unified outliers in our preliminary work [KNS’I]. 394
Finally, for a class of regression models, we can define an outlier criterion DefRegression, and show that DB(p, D) unifies DefRegression [KN97]. 2.2
Sample
Runs
Using
NHL
Statistics
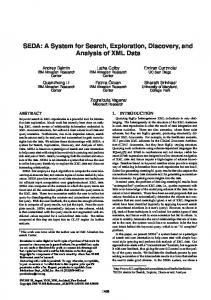
During in-lab experiments on historical NHL data, we have identified outliers among players having perhaps “ordinary looking” statistics which suddenly stand out as being non-ordinary when combined with other attributes. Portions of sample runs of these experiments are documented in Figure 1. The first example shows that, in 1994, Wayne Gretzky and Sergei Fedorov were outliers when 3 attributes-points scored, plus-minus statistiq4 and number of penalty minutes-were used. Fedorov was an outlier because his point and plus-minus figures were much higher than those of almost all other players. (As a reference note, the “average” NHL player has fewer than 20 points, a plus-minus statistic of 0, and fewer than 100 penalty minutes.) Gretzky was an outlier because of his high point total and low plusminus figure. In fact, we were surprised that Gretzky’s plus-minus figure was so poor, especially since he was the highest scorer in the league that year, and since high scorers usually have positive plus-minus values (as confirmed by Fedorov in the same example).5 Using the same 3 attributes for 1996 data (see the second example), we note that Vladimir Konstantinov had an astonishingly high plus-minus statistic (i.e., +SO) despite having a rather mediocre point total. Our third example shows that Chris Osgood and Mario Lemieux were outliers when 3 attributesgames played, goals scored, and shooting percentage (i.e., goals scored, divided by shots taken)-were used. Few NHL players had shooting percentages much beyond 20%, but Osgood’s shooting percentage really stood out. Despite playing 50 games, he only took 1 shot, on which he scored. Osgood’s outlier status is explained by the fact that he is a goalie, and that goalies have rarely scored in the history of the NHL. Lemieux was an outlier, not because he scored on 20.4% of his shots, but because no other player in the 20% shooting range had anywhere near the same number of goals and games played. Whereas the above 3 examples contain outliers that are extreme in some dimension, the 4th example is different. None of Alexander Mogilny’s statistics was extreme in any of the 5 dimensions. The NHL range 4The plus-minus statistic indicates how many more evenstrength goals were scored by the player’s team-as opposed to the opposition’s team-when this particular player was on the ice. For example, a plus-minus statistic of $2 indicates that this player was on the ice for 2 more goals scored by his team than against his team. 5The next highest scorer in negative double digits did not occur until the 23rd position overall. Perhaps Gretzky’s plusminus can be explained by the fact that he played for the Los Angeles Kings that year-a team not known for its strong defensive play.
FindOutliers nh194.data p=O.998 D=29.6985 POINTS PLUSMINUS PENALTY-MINUTES 1) Name = WAYNEGRETZKY, POINTS = 130, PLUSMINUS= -25, PENALTY-MINUTES= 20 2) Name = SERGEI FEDOROV,POINTS = 120, PLUSMINUS= 48, PENALTY-MINUTES= 34 FindOutliers nh196.data p=O.998 D=26.3044 POINTS PLUSMINUS PENALTY-MINUTES 1) Name = VLAD KONSTANTINOV,POINTS = 34, PLUSMINUS= 60, PENALTY-MINUTES= 139 FindOutliers nh196.data p=O.997 D=5 GAMES-PLAYEDGOALS SHOOTING-PERCENTAGE 1) Name = CHRIS OSGOOD, GAMES-PLAYED = 50, GOALS= 1, SHOOTING-PERCENTAGE = 100.0 2) Name = MARIOLEMIEUX, GAMES-PLAYED = 70, GOALS= 69, SHOOTING-PERCENTAGE = 20.4 FindOutliers nh196.normalized.Otol p=O.996 D=0.447214 GAMES-PLAYEDPOWER-PLAY-GOALS SHORTHANDED-GOALS GAME-WINNING-GOALSGAME-TIEING-GOALS 1) Name = ALEXANDERMOGILNY, GAMES-PLAYED = 79, POWER-PLAY-GOALS = 10, SHORTHANDED-GOALS = 5, GAME-WINNING-GOALS = 6, GAME-TIEING-GOALS= 3 2) Name = MARIOLEMIEUX, GAMES-PLAYED = 70, POWER-PLAY-GOALS = 31, SHORTHANDED-GOALS = 8, GAME-WINNING-GOALS = 8, GAME-TIEING-GOALS= 0
Figure 1: Sample Output Involving for each of the 5 attributes (with Mogilny’s statistic in parentheses) was as follows: l-84 games played (79), O-31 power play goals (lo), O-8 shorthanded goals (5)) O-12 game winning goals (6), and O-4 game tieing goals (3). In contrast, 3 of 5 statistics for Mario Lemieux were extreme. In all of these examples, a user chose suitable values for p and D to define the “strength” of the outliers requested. These values depend on the attributes being analyzed and each attribute’s distribution. The quest for suitable values for p and D may involve trial and error and numerous iterations; therefore, in future work, we will use sampling techniques to estimate a suitable starting value for D, given some value of p close to unity (e.g., p = 0.999). We also plan on supporting user-defined distance functions (including statistical distance functions which account for variability among attributes [JW92]).
3 3.1
Simple Algorithms DB(p, D)-Outliers Index-Based
for
Finding
NHL Players’ Statistics
each object 0. As soon as (M + 1) neighbours are found in the D-neighbourhood, the search stops, and 0 is declared a non-outlier; otherwise, 0 is an outlier. Analyses of multidimensional indexing schemes [HKP97] reveal that, for variants of R-trees [Gut841 and Ic-d trees [Ben75, SamSO], the lower bound complexity for a range search is R(N’-l/“), where k is the number of dimensions or attributes and N is the number of data objects. As k increases, a range search quickly reduces to O(N), giving at best a constant time improvement reflecting sequential search. Thus, the above procedure for finding all DB(p, D)-outliers has a worst case complexity of O(k N2). Two points are worth noting: .
All
Algorithms
Let N be the number of objects in dataset T, and let F be the underlying distance function that gives the distance between any pair of objects in T. For an object 0, the D-neighbourhood of 0 contains the set of objects Q E T that are within distance D of 0 (i.e., {Q E T ] F(O,Q) 5 D}). The fraction p is the minimum fraction of objects in T that must be outside the D-neighbourhood of an outlier. For simplicity of discussion, let M be the maximum number of objects within the D-neighbourhood of an outlier, i.e., M = NC1 -P). From the formulation above, it is obvious that given p and D, the problem of finding all DB(p, D)-outliers can be solved by answering a nearest neighbour or range query centred at each object 0. More specifically, based on a standard multidimensional indexing structure, we execute a range search with radius D for 395
Compared to the depth-based approaches, which have a lower bound complexity of S1(Nrsl), DBoutliers scale much better with dimensionality. The framework of DB-outliers is applicable and computationally feasible for datasets that have many attributes, i.e., k >_ 5. This is a significant improvement on the current state-of-the-art, where existing methods can only realistically deal with two attributes [RR96]. The above analysis only considers search time. When it comes to using an index-based algorithm, most often for the kinds of data mining applications under consideration, it is a very strong assumption that the right index exists. As will be shown in Section 6, the index building cost alone, even without counting the search cost, almost always renders the index-based algorithms uncompetitive.
3.2
A Nested-Loop
Algorithm
To avoid the cost of building an index for finding all DB(p, D)-outliers, Algorithm NL shown in Figure 3.2 uses a block-oriented, nested-loop design. Assuming a total buffer size of B% of the dataset size, the algorithm divides the entire buffer space into two halves,
called the first and second arrays. It reads the dataset into the arrays, and directly computes the distance between each pair of objects or tuples.6 For each object t in the first array, a count of its D-neighbours is maintained. Counting stops for a particular tuple whenever the number of D-neighbours exceeds M. Algorithm Fill the first array (of size f% of tuples from T.
In the following two sections, we present two versions of a cell-based algorithm that has a complexity linear with respect to N, but exponential with respect to k. This algorithm is therefore intended only for small values of k. The key idea is to gain efficiency by using cell-by-cell processing instead of tuple-by-tuple processing, thereby avoiding the N2 complexity term.
NL of the dataset)
with a block
4
a. count;
+ 0 tj) 5 D:
Increment count; by 1. If counti > M, mark t; as a non-outlier and proceed to next ti. While blocks remain to be compared
to the first array, do:
4.1
a. Fill the second array with another block (but save a block which has never served as the first array, for last). b. For each unmarked
tuple
t; in the first array do:
tuple ti in the first array, report
b(G,y)
Figure 2: Pseudo-Code for Algorithm
we use the terms
object
Properties
in 2-D
I u
=
x
f
1,
21 =
y f
1,
GA,,
#
G,,}.(l)
A typical cell (except for any cell on the boundary of the cell structure) has 8 Li neighbours.
NL
and
and
= {G,,
Property 1 Any pair of objects within the same cell 0 is at most distance g apart.
As an example, consider Algorithm NL with 50% buffering, and denote the 4 logical blocks of the dataset by A, B, C, D, with each block/array containing $ of the dataset. Let us follow the algorithm, filling the arrays in the following order, and comparing: 1. A with A, then with B, C, D-for a total of 4 block reads; 2. D with D (no read required), then with A (no read), B, C-for a total of 2 block reads; 3. C with C, then with D,A, B-for a total of 2 blocks reads; and 4. B with B, then with C, A, D-for a total of 2 block reads. Thus, in this example, a grand total of 10 blocks are read, amounting to y = 2.5 passes over the entire dataset. Later, in Section 5.3, we compute the number of passes required in the general case. Algorithm NL avoids the explicit construction of any indexing structure, and its complexity is O(kN2). Compared to a tuple-by-tuple brute force algorithm that pays no attention to I/O’s, Algorithm NL is SUperior because it tries to minimize I/O’s. on in,
Structure
t; as
5. If the second array has served as the first array anytime before, stop; otherwise, swap the names of the first and second arrays and goto step 2.
6From here interchangeably.
Cell
Suppose our data objects are 2-D. We quantize each of the data objects into a 2-D space that has been partitioned into cells or squares of length 1 = &. Let C,?, denote the cell that is at the intersection of row z and column y. The Layer 1 (Li) neighbours of C,,, are the immediately neighbouring cells of CZ,Y, defined in the usual sense, that is,
For each tuple tj in the second array, if dist(t;, tj) 5 D: Increment counti by 1. If counti > M, mark t; as a non-outlier and proceed to next tj. 4. For each unmarked an outlier.
Approach
Let us begin with a simplified version of the algorithm, which assumes that both the multidimensional cell structure and the entire dataset fit into main memory. For ease of presentation, we begin with 2-D, and then proceed to k-D. In Section 5, we give the full version of the algorithm for handling disk-resident datasets.
For each tuple ti in the first array, do:
b. For each tuple tj in the first array, if dist(ti,
A Cell-Based
Property 2 If C,,, is an LI neighbour of CZ,y, then any object P E C,), and any object Q E C,,, are at cl most distance D apart.
Property 1 is valid because the length of a cell’s diagonal is fil = 4% = g. Property 2 is valid because the distance between any pair of objects in the two cells cannot exceed twice the length of a cell’s diagonal. We will see that these two properties are useful in ruling out many objects as outlier candidates. The Layer 2 (Lz) neighbours of C,,, are those additional cells within 3 cells of C%,v, i.e., Lz(C,,,)
= {C,,, 1u = 5 f 3, v = y f 3, c,,, 9 Ll(C,,,), c,,, # Cqy}. (2)
A typical cell (except for ary) has 72 - 32 = 40 L2 cell thick and Layer 2 is in this way to satisfy the
any cell on or near a boundcells. Note that Layer 1 is 1 2 cells thick. L2 was chosen following property.
Property 3 If C,,, # C,,, is neither an L1 nor an L:! neighbour of CZ,Y, then any object P E C,,, and any 0 object Q E C,,, must be > distance D apart.
tuple
396
All of the properties mentioned in Section 4.1 are used to help determine outliers and non-outliers on a cell-by-cell basis, rather than on an object-by-object basis. This helps to reduce execution time significantly because we quickly rule out a large number of objects that cannot be outliers. For cells not satisfying any of Properties 4(a)-(c), we resort to object-by-object processing. Such cells are denoted as white cells (C,). In step 5(c)(3) of Algorithm FindAllOutsM, each object P E C, must be compared with every object Q lying in a cell that is an Lz neighbour of C, in order to determine how many Q’s are inside the D-neighbourhood of P. As soon as the number of D-neighbours exceeds M, P is declared a non-outlier. If, after examining all Q’S, the count remains 5 M, then P is an outlier.
Since the combined thickness of L1 and LQ is 3 cells, the distance between P and Q must exceed 31= 3 > D. Property 4 (a) If there are > M objects in CZ,Y, none of the objects in C,,, is an outlier. (b) If there are > M objects in C,,, U LI(C,,,), of the objects in C,,, is an outlier.
none
(c) If there are 5 M objects in C,,, U Ll(C,,,) L2(Cz,y), ewenJ object in C,,, is an outlier.
U
0
Properties 4(a) and 4(b) are direct consequences of Properties 1 and 2, and 4(c) is due to Property 3. 4.2
Algorithm Resident
FindAllOutsM Datasets
for
Memory4.3
Algorithm ,... m,
FindAllOutsM Count,
+- 0
2. For each object P, map P to an appropriate P, and increment Count, by 1. 3. Forq+1,2
,...,
m,
if Count,
cell C,, store
> M, label C, red.
4. For each red cell CT, label each of the L1 neighbours of C, pink, provided the neighbour has not already been labelled red. 5. For each non-empty a. Cow&Z b. If Count,2
white (i.e., uncoloured)
+- Count,
+ CiELIcCwj
> M, label C,
cell C,,
do:
Counti
pi&
c. else 1. Countw3
+- Count,2
+ CiEL2(C,I
2. If Count,3 5 M, mark all outliers. 3. else for each object P E C,, i. Countp + Countw2 ii. For each object Q dist(P, Q) i: D: Increment Countp by M, P cannot be an 5(c)(3). iii. Mark P as an outlier.
Figure 3: Pseudo-Code for Algorithm
COUnti
objects
in C,
as
do: E
L2(C,),
Analysis:
The 2-D Case
Let us analyze the complexity of Algorithm FindAllOutsM for the 2-D case. Step 1 takes O(m) time, where m < N is the total number of cells. Steps 2 and 3 take O(N) and O(m) time respectively. Since M + 1 is the minimum number of objects that can appear in a red cell, there are at most fi red cells. Thus, step ) time. The time complexity of step 5 4 takes O(& is the most complicated. In the worst case, (i) no cell is labelled red or pink in the previous steps, and (ii) step 5(c) is necessary for all cells. If no cell is coloured, then each cell contains at most M objects. Thus, in step 5(c), each of the objects in a cell can require the checking of up to M objects in each of the 40 Lz neighbours of the cell; therefore, 0(40M2) time is required for each cell. Hence, step 5 takes O(mM2) time. Since, by definition, M = N(1 - p), we equate O(mM2) to O(mN2(1 - P)~). In practice, we expect p to be extremely close to 1, especially for large datasets, so O(mN2(1 -p)“) can be approximated by O(m). Thus, the time complexity of Algorithm FindAllOutsM in 2D is O(m+N). Note that this complexity figure is very conservative because, in practice, we expect many red and pink cells. As soon as this happens, there are fewer object-to-object comparisons. Thus, step 5(c) becomes less dominant, and the algorithm requires less time. In Section 6.2, we show experimental results on the efficiency of Algorithm FindAllOutsM.
Figure 3 presents Algorithm FindAllOutsM to detect all DB(p, D)-outliers in memory-resident datasets. Later, in Section 5.2, we present an enhanced algorithm to handle disk-resident datasets. 1. Forq+1,2
Complexity
if
1. If Countp > outlier, so goto
4.4
FindAllOutsM
Generalization
to Higher
Dimensions
When moving from k = 2 dimensions to k > 2, Algorithm FindAllOutsM requires only one change to incorporate a general k-D cell structure. That change involves the cell length 1. Recall that in 2-D, 1 = 3. Since the length of a diagonal of a k-D hypercube/cell of length 1 is &l, the length 1 in a k-D setting must be changed to $ to preserve Properties 1 and 2. Although the following comments do not change Algorithm FindAllOutsM, an understanding of which
Step 2 of Algorithm FindAllOutsM quantizes each tuple to its appropriate cell. Step 3 labels all cells containing > M tuples, red. This corresponds to Property 4(a). Cells that are L1 neighbours of a red cell are labelled pink in step 4, and cannot contain outliers because of Property 4(b). Other cells satisfying Property 4(b) are labelled pink in step 5(b). Finally, in step 5(c)(2) of the algorithm, cells satisfying Property 4(c) are identified. 397
cells appear in Layer 2 is important in correctly applying the algorithm. First, we note that the Li neighbours of cell CZ1,...,llc are: L(G,...,l,>
=
tJ1 I
i I
{G,,...,u,
k,
G,
I ui ,..., uk #
= xi G,
f
Here, we extend the simplified version to handle diskresident datasets. This new version preserves the property of being linear with respect to N. It also provides the guarantee that no more than 3, if not 2, passes over the dataset are required.
1
(3)
,..., zk}
5.1
which generalizes the definition given in (1). However, to preserve Property 3, the definition of Lz neighbours needs to be modified. Specifically, since 1 = 3, Layer 2 needs to be thicker than it is for k = 2. Let x denote the thickness of Layer 2. Then, the combined thickness of Layers 1 and 2 is z + 1. So, for Property 3 to hold, we require that (x + 1)1 > D; consequently, we pick x as [2& - 11. The Lz neighbours of C,,,...,,, are therefore: L2(G,,..+zk)
=
{G,,...,,,
C Ul,...)
k,
zlk #
G,
I ui
= xi
G,
,..., uk # Ll(G,
f
l
pdq ,..., z,),
,..., lk)
(4)
which generalizes (2). In this way, Properties listed in Section 4.1 are preserved. 4.5
Complexity Analysis: Higher Dimensions
The
1 to 4
Case
for
For k > 2, the complexities of steps 1 to 4 in Algorithm FindAllOutsM remain the same. However, we note that m is exponential with respect to k, and may not necessarily be much less than N. Also, the complexity of step 5 is no longer O(m), but O(m(2[2&] + 1)“) M O(ck), where c is some constant depending on & and on milk (which roughly corresponds to the number of cells along each dimension). Thus, the complexity of the entire algorithm is O(c” + N). While this complexity figure represents a worst case scenario, the question to ask is how efficient Algorithm FindAllOutsM is in practice for the general k-D case. We defer the answer to Section 6.4, but make the following preliminary comments. First, for the identification of “strong” outliers, the number of outliers to be found is intended to be small. This is achieved by having a relatively large value of D, and a value of p very close to unity. A large value of D corresponds to a small number of cells along each dimension. Thus, the constant c is small, but it is > 1. Second, for values of p very close to unity, M is small, implying that there will be numerous red and pink cells. This means that the savings realized by skipping red and pink cells is enormous, and that the number of objects requiring pairwise comparisons is relatively small.
5
DB-Outliers Datasets
in Large,
Disk-Resident
Datasets:
In handling a large, disk-resident dataset, the goal is to minimize the number of page reads or passes over the dataset. In the cell-based algorithm, there are two places where page reads are needed:
l
V 1 5 i I
Handling Large, An Example
the initial mapping phase In step 2 of Algorithm FindAllOutsM, each object is mapped to an appropriate cell. This unavoidable step requires one pass over the dataset. the object-pairwise phase In step 5(c)(3), for each object P in a white cell C,,,, each object Q in a cell that is an L2 neighbour of C, needs to be read to perform the object-byobject distance calculation. Since objects mapped to the same cell, or to nearby cells, are not necessarily physically clustered on disk, each pair of objects (P, Q) may require a page to be read, thereby causing a large number of I/O%. The point here is that if object-by-object distance calculations are to be done exactly as described in step 5(c)(3), then a page may be read many times.
The above scenario is an extreme case whereby no tuples/pages are stored in main memory. A natural question to ask is if, in the object-pairwise phase, it is possible to read each page only once. Let Page(C) denote the set of pages that store at least one tuple mapped to cell C. Then, for a particular white cell C we need to read the pages in Page(&). Because w:‘also need the tuples mapped to a cell C, that is an L2 neighbour of C,,, (i.e., C, E Lz(C,)), we need the pages in Pw$L2(C,)) = UcvEL2~c,~ Pqe(G). Also, if we want to ensure that pages in Page(Ls(C,)) are only read once, we need to read the pages: (i) that are needed by C,, because C, itself may be a white cell, and (ii) that use C,,, because C, may be an L2 neighbour of yet another white cell. In general, the “transitive closure” of this page cascading may include every page in the dataset. Hence, the only way to ensure that a page is read at most once in the objectpairwise phase is to use a buffer the size of the dataset, which is clearly a strong assumption for large datasets. Our approach is a “middle ground” scenario whereby only a selected subset of tuples is kept in main memory. This subset is the set of all tuples mapped to white cells. Hereinafter, we refer to such tuples as white tuples. This is our choice partly because these are the very tuples that need object-by-object calculations, and partly because the number of tuples in a
Disk-Resident
In the last section, we presented a cell-based algorithm that was simplified for memory-resident datasets. 398
white cell, by definition, is bounded above by M. Furthermore, we classify all pages into three categories: A. Pages that contain some white tuple(s) B. Pages that do not contain any white tuple, but contain tuple(s) mapped to a non-white cell which is an Lz neighbour of some white cell C. All other pages To minimize page reads, our algorithm first reads Class A pages, and then Class B pages. Following this, it suffices to re-read Class A pages to complete the objectpairwise phase. Class C pages are not needed here. Consider a simple example where there are 600 pages in a dataset. Suppose pages 1 to 200 are Class A pages, pages 201 to 400 are Class B pages, and pages 401 to 600 are Class C pages. Suppose tuple P is mapped to white cell C,, and is stored in (Class A) page i. For P to complete its object-by-object distance calculations, these three kinds of tuples are needed: l
l
l
white tuples Q mapped to a white Lx neighbour of c, non-white tuples Q mapped to a non-white neighbour of C,, and stored in page j > i
Lz
non-white tuples Q mapped to a non-white neighbour of C,, but stored in page j < i
Lz
For the first kind of tuple, the pair (P, Q) is kept in main memory after the first 200 pages have been read, because both tuples are white. Thus, their separation can be computed and the appropriate counters (i.e., both P’s and Q’s) may be updated after all Class A pages have been read. For the second kind of tuple, the distance between the pair (P, Q) can be processed when page j is read into main memory, because P is already in main memory by then since i 5 j. The fact that Q is not kept around afterwards does not affect P at all. Thus, after the first 400 pages have been read (i.e., all class A and B pages), the second kind of tuples for P have been checked. The only problem concerns the third kind of tuples. In this case, when Q (which is stored in page j) is in main memory, P (which is stored in page i > j) has not been read. Since Q is a non-white tuple and is not kept around, then when P eventually becomes available, Q is gone. To deal with this situation, page j needs to be re-read. In general, all Class A pages (except one) may need to be re-read. But it should be clear that because all white tuples are kept in main memory, it is sufficient to read Class A pages a second time. Before presenting the formal algorithm, we offer two generalizations to the above example. First, the example assumes that all Class A pages precede all Class B pages in page numbering, and that pages are read in ascending order. Our argument above applies equally
well if these assumptions are not made-so long as all Class A pages are read first, followed by all Class B pages, and the necessary (re-reading of) Class A pages. Second, Class A pages can be further divided into two subclasses: (A.l) pages that do not store any nonwhite tuple that is needed, and (A.2) pages that store some non-white tuple(s) that are needed. If this subdivision is made, it should be obvious from the above analysis that in re-reading all Class A pages, it suffices to re-read only the Class A.2 pages. For simplicity, this optimization is not described in the algorithm below.
5.2
Algorithm Disk-Resident
FindAllOutsD Datasets
for
Figure 4 presents Algorithm FindAllOutsD for mining outliers in large, disk-resident datasets. Much of the processing in the first 5 steps of Algorithm FindAllOutsD is similar to that described for Algorithm FindAllOutsM shown in Figure 3. We draw attention to step 2 of Algorithm FindAllOutsD, which no longer stores P but makes a note of the fact that P’s page contains some tuple(s) mapped to C,. This is important because (i) we may need to access a given cell’s tuples later in the algorithm, and (ii) we need to know which cells have tuples from a particular page. Step 5(c)(2) co1ours a white cell yellow if it has been determined that every tuple in a given cell is an outlier. Its tuples will be identified in step 8 after they have been read from their pages in step 6. Step 6 reads only those pages containing at least one white or yellow tuple. With respect to Section 5.1, this corresponds to reading all Class A pages. The white and yellow tuples from these pages are stored with the cell C, to which they have been quantized. C, stores exactly Count, tuples, and this count is 5 M. To prepare for L2 processing, step 6(b) (1) (ii) initializes the D-neighbour counter to the number of tuples in C, U L1 (C,). In step 7, for each non-empty white cell C,, we determine how many more D-neighbours each tuple P E C, has, using (as potential neighbours) just the tuples read and stored in step 6. As soon as we find that P has > M D-neighbours, we mark P as a nonoutlier. After step 7, it is possible that some (or all) of the non-empty white cells need no further comparisons, thereby reducing the number of reads in step 9. Necessary disk reads for cells that are both nonwhite and non-yellow are performed in step 9. With respect to Section 5.1, this corresponds to reading all Class B pages, and re-reading (some) Class A pages. Again, we determine how many more D-neighbours that each tuple P in each white cell has, using only the newly read tuples from disk. If P has > A4 Dneighbours, then P is marked as a non-outlier, and no further comparisons involving P are necessary.
5.3 Algorithm
FindAllOutsD
1. For q +- 1,2,.
m,
2. For each object
P in the dataset,
Count,
Count,
,...,
m,
do:
cell C, but do not store P.
by 1.
c. Note that C, references 3. Forqt1,2
P’s page.
if Count,
Lemma 3 Algorithm FindAllOutsD 3 passes over the dataset.
> M, label C, red.
4. For each red cell C,, label each of the L1 neighbours of C, pink, provided the neighbour has not already been labelled red. 5. For each non-empty a. Count,2
white (i.e., uncoloured)
+ Cour&
+ CjELl(Cuj
b. If CountW2 > M, label C,
cell C,,
6 Count,2
do:
Counti
pink. + CiELzcCW)
Count;
2. If Count,3 5 M, label C,,, yellow to indicate that all tuples mapping to C, are outliers. 3. else Sum, +- CountW2 6. For each page i containing do:
at least 1 while or yellow tuple,
a. Read page i. b. For each while or yellow cell C, having tuples in page i, do: 1. For each object P in page i mapped to C,, do: i. Store P in C,. ii. Kountp +- Sum, 7. For each object
P in each non-empty
white cell C,,
a. For each white or yellow cell CL E Lz(C,),
do:
do:
1. For each object Q E CL, if dist(P, Q) < D: Increment Kountp by 1. If Kountp > M, mark P as a non-outlier, and goto next P. 8. For each object Q in each yellow cell, report Q as an outlier. 9. For each page i containing at least 1 tuple that (i) is both non-white and non-yellow, and (ii) maps to an L2 neighbour of some white cell C, do:
Lemma 4 If a dataset is blocks (B is the percentage total number of block reads is n + (n - 2) (n - l), and (ii) the dataset is 2 n - 2.
a. Read page i. b. For each cell C, E L2(C) that is both non-white non-yellow, and has tuples in page i, do:
and
1. For each object Q in page i mapped to C,, do: i. For each non-empty white cell C, E L2(C,h do: For each object P E C,, if dist(P, Q) < D: Increment Kountp by 1. If Kountp > M, mark P as a non-outlier. 10. For each object P in each non-empty white cell, if P has not been marked as a non-outlier, then report P as an outlier.
Figure 4: Pseudo-Code for Algorithm
requires at most
Proof Outline: The initial mapping phase requires one pass over the dataset. Let n be the total number of pages in the dataset. Then if nl, n2, n3 denote the number of pages in Classes A, B, and C respectively (cf: Section 5.1), it is necessary that n = n1 + n:! + n3. As shown in Section 5.1, the maximum total number of pages read in the object-pairwise phase is given by n1 + 122+ nl , which is obviously 5 2n. Thus, the entire 0 algorithm requires no more than 3 passes. The above guarantee is conservative for two reasons. First, the sum n1 + 722+ n1 can be smaller than n. For example, if nl 5 n3, then the sum is 5 n, implying that while some page may be read 3 times, the total number of pages read is equivalent to no more than 2 passes over the dataset. Second, the above guarantee assumes that: (i) there is enough buffer space for storing the zuhite tuples (as will be shown later, this is not a strong assumption because typically there are not too many non-empty white cells), and (ii) there is only one page remaining in the buffer space for Class A and B pages. More buffer space can be dedicated to keep more Class A pages around, thereby reducing the number of page re-reads for Class A pages. At this point, let us revisit Algorithm NL, used for block-oriented, nested-loop processing of disk-resident datasets (cf: Section 3.2). We will show that Algorithm FindAllOutsD guarantees fewer dataset passes than Algorithm NL does, for sufficiently large datasets.
c. else 1. Countwg
and
Algorithm FindAllOutsD has a linear complexity wrt N for the same reasons explained for Algorithm FindAllOutsM (cf: Section 4.3), but by design, Algorithm FindAllOutsD has the following important advantage over Algorithm FindAllOutsM wrt I/O performance.
+- 0
a. Map P to its appropriate b. Increment
Analysis of Algorithm FindAllOutsD Comparison with Algorithm NL
FindAllOutsD
400
divided into n = 191 of buffering), then (i) the required by Algorithm NL the number of passes over
Proof Outline: (i) Each of the n blocks must be read exactly once during the first dataset pass. At the end of each pass, we retain 2 blocks in memory, so only n - 2 additional blocks need to be read during passes 2, 3, . ..) n. Thus, n + (n - 2)(n - 1) blocks are read. (ii) The number of dataset passes is: nt(n-i)(n-l) = n2-T+2 =n-2+$>n-2. 0 In general, Algorithm NL may require many more passes than Algorithm FindAllOutsD. For example, if a large dataset is split into n = 10 pieces, Lemma 4 states that Algorithm NL requires n - 2 = 10 2 = 8 passes, which is 5 more passes than Algorithm FindAllOutsD may need.
6
Empirical rit hms
6.1
Behaviour
Experimental
of
the
Algo-
Setup
Our base dataset is an 855-record dataset consisting of 1995-96 NHL player performance statistics. These statistics include numbers of goals, assists, points, penalty minutes, shots on goal, games played, power play goals, etc. Since this real-life dataset is quite small, and since we want to test our algorithms on large, disk-resident datasets, we created a number of synthetic datasets mirroring the distribution of statistics within the NHL dataset. More specifically, we determined the distribution of the attributes in the original dataset by using lo-partition histograms. Then, we generated datasets containing between 10,000 and 2,000,OOOtuples, whose distributions mirrored that of the base dataset. Each page held up to 13 tuples. All of our tests were run on a Sun Microsystems UltraSPARC-1 machine having 128 MB of main memory. Unless otherwise indicated, all times shown in this paper are CPU times plus I/O times.7 Our code was written in C++ and was processed by an optimizing compiler. The modes of operation that we used, and their acronyms, are as follows:
Figure 5: How CPU + I/O Time Scales with N for 3-D Disk-Resident Datasets, Using p = 0.9999
Table 1: CPU Times (in Seconds) for 3-D, MemoryResident Datasets, using p = 0.9995
1
1. CS is a multidimensional cell structure implementation as described by either Algorithm FindAllOutsM or FindAllOutsD. The context makes it clear which algorithm is being evaluated.
N
11CS 1 NL
1 KD
1 20000 110.32 1 1.02 1 3.14
2. NL is an implementation of Algorithm NL. The amount of memory permitted for buffering in each NL case is the same amount of memory required by CS. For example, if CS uses 10 MB of main memory, then 10 MB is also available for NL.
J
Range query processing in KD and RT modes has been optimized to terminate as soon as the number of Dneighbours exceeds M.
competitive. Unlike CS, RT is not linear wrt N. In fact, just building the R-tree can take at least 10 times as long as CS, let alone searching the tree. While the preceding paragraph concerns diskresident datasets, Table 1 summarizes the results for memory-resident datasets in 3-D, using p = 0.9995. Again, CS can outperform NL by an order of magnitude, and the index-based algorithm-a k-d tree (KD) in this case--takes much longer, even if we just consider the time it takes to build the index.
6.2
6.3
3. KD is a memory-based k-d tree implementation. 4. RT is a disk-based R-tree implementation.
Varying
the Dataset
Size
Figure 5 shows results for various modes and various dataset sizes for 3-D, using p = 0.9999. Specifically, it shows how CPU + I/O time is affected by the number of tuples. (The z-axis is measured in millions of tuples.) For example, CS takes 256.00 seconds in total time to find all the appropriate DB-outliers in a 2 million tuple dataset. In contrast, NL takes 2332.10 seconds, about 9 times as long. RT mode is even less
Varying
the Value
of p
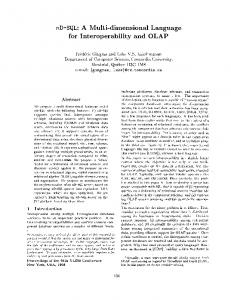
Figure 6 shows how the percentages of white, pink, red, and non-empty white cells vary with p.* The total number of cells is simply the sum of the red, pink, and white cells. Processing time is less when there is a greater percentage of red and pink cells because we can quickly eliminate a larger number of tuples from being considered as outliers. The success of the cell-based algorithms is largely due to the fact that many of the cells may be red or pink (and there may be relatively few non-empty white cells). Recall that non-empty
70~r CPU timer wraps around after 2147 seconds; hence, times beyond this are unreliable. Where we have quoted a CPU + I/O figure > 2147, it is because the CPU time was < 2147, but the I/O time actually caused the sum to exceed 2147. (CPU time and I/O time were measured separately.)
8We include yellow cells with the while cell population yellow cells are just a special type of white cell.
401
since
zvhite cells require the most computational
out the optimization, however, it is true that reducing the number of cells normally results in a reduction in total time. Our implementation uses a hybrid strategy whereby we turn off the optimization at certain thresholds of p and m. Finally, because we made CS and NL use the same amount of memory for fair comparison, the amount of buffer space available to NL increased as k increased. This explains why the execution time of NL shown in Table 2 often dropped with increasing dimensions.
effort.
7
Figure 6: 3-D Cell Colouring Statistics for Variable p, for 500,000 Tuples
6.4
Varying Cells
the Number
of Dimensions
and
In this section, we see how the number of dimensions and cells affects performance. We omit the trivial 1-D and 2-D results, but show results for 3-D, 4-D, and 5-D. Beyond 5-D, we believe that NL will be the clear winner. Table 2 shows how CS and NL compare in different dimensions for disk-resident datasets of various sizes, using p = 0.9999. For CS mode in 5-D, we varied the number of partitions rni in a given dimension i. We chose mi = 10, 8, and 6 for each dimension. The columns CS(105), CS(85), and CS(65) stand for cases where the cell structure contains m = IIt=imi = 105, S5, and 65 cells, respectively. The table shows that (i) CS outperforms NL in 3-D by almost an order of magnitude, (ii) CS clearly ou t performs NL in 4-D, and (iii) NL is the clear winner in 5-D. Due to the exponential growth in the number of cells, CS is uncompetitive with NL in 5-D. Even when the number of cells is greatly reduced in 5-D, CS generally cannot beat NL. In fact, of all the 5-D tests we ran (in addition to those shown in Table 2), there was only one case where CS actually beat NL. Perhaps surprisingly, the table shows that a reduction in the number of cells in 5-D does not necessarily result in a reduction in total time. This is due to an I/O optimization that we included in our implementation, whereby dramatic savings are achieved for larger numbers of cells (for values of p close to unity).g Withgin particular, for a non-empty white cell C,, as soon as the number of D-neighbours exceeds A4 for all of G’s tuples, we explicitly search through L2(CW)‘s cells looking for red or pink cells. For each such red or pink cell, we determine the block ID’s (pages) that contain tuples mapped to it, and then we subtract 1 from the respective block ID counters. Later in the program,
Conclusions
We believe that identifying DB-outliers is an important and useful data mining activity. In this paper, we proposed and analyzed several algorithms for finding DB-outliers. In addition to two simple O(k N2) algorithms, we developed cell-based algorithms that are linear with respect to N and are suitable for k 5 4. The cell-based algorithm developed for large, diskresident datasets also guarantees that no data page is read more than 3 times, if not once or twice. Our empirical results suggest that (i) the cell-based algorithms are far superior to the other algorithms for k 5 4 (in some cases, by at least an order of magnitude), (ii) the nested-loop algorithm is the choice for k 2 5 dimensions, and (iii) finding all DB-outliers is computationally very feasible for large, multidimensional datasets (e.g., 2.5 minutes total time for 500,000 tuples in 5-D). Using Algorithm NL, there is no practical limit on the size of the dataset or on the number of dimensions. In ongoing work, we are developing incremental techniques that allow the user to freely experiment with p and D, but do not require the cell structure to be recomputed from scratch for every change of the parameters. We are also looking for ways to incorporate user-defined distance functions, and to provide incremental support for changing distance functions. Acknowledgements This research has been partially sponsored by NSERC Grant OGP0138055 and IRIS-2 Grants HMI-5 & IC-5.
References [AAR96]
A. A rning, R. Agrawal, and P. Raghavan. A linear method for deviation detection in large databases. In Proc. KDD, pages 164169, 1996.
[AGI+92]
S. Ghosh, T. Imielinski, R. Agrawal, B. Iyer, and A. Swami. An interval clas-
when it comes time to read the block, if the block ID counter is no longer positive, we avoid reading and processing the page because we know that this page is no longer needed. Thus, for the additional expense of searching Ls(C,) cells, we may realize substantial savings; however, this advantage is lost as p becomes smaller or as the overall number of cells becomes fewer.
402
Table 2: CPU + I/O Times (in Seconds) for a Variable Number of Tuples, Dimensions, and Cells-for 3-D N 100,000
CS(10”) 10.77
500,000 2,000,000
57.10
NL 93.96 490.62
253.90
2332.10
4-D CS(104) 23.32 114.00 606.56
[AL881
CS(85)
>2147
CS(65)
NL
217.04
205.63
17.30
997.11
1061.33
148.44
>2147
>2147
1555.78
[KN96]
E. M. Knorr and R. T. Ng. Finding aggregate proximity relationships and commonalities in spatial data mining. IEEE Transactions on Knowledge and Data Engineering, 8(6):884-897, 1996.
[KN97]
E. M. Knorr and R. T. Ng. A unified notion of outliers: Properties and computation. In PTOC. KDD, pages 219-222, 1997. An extended version of this paper appears as: E. M. Knorr and R.T. Ng. A Unified Approach for Mining Outliers. In PTOC. 7th CASCON, pages 236-248, 1997.
[Kno97]
E. M. Knorr. On digital money and card technologies. Technical Report 97-02, University of British Columbia, 1997.
[MT961
H. Mannila and H. Toivonen. Discovering generalized episodes using minimal occurrences. In Proc. KDD, pages 146-151,1996.
[MTV95]
H. Mannila, H. Toivonen, and A. Verkamo. Discovering frequent episodes in sequences. In Proc. KDD, pages 210-215, 1995.
[NH941
D. Freedman, R. Pisani, and R. Purves. Statistics. W.W. Norton, New York, 1978.
R. Ng and J. Han. Efficient and effective clustering methods for spatial data mining. In PTOC. 20th VLDB, pages 144-155, 1994.
[PS88]
R. Guttmann. A dynamic index structure for spatial searching. In PTOC. ACM SIGMOD, pages 47-57, 1984.
F. Preparata and M. Shamos. Computational Geometry: an Introduction. Springer-Verlag, 1988.
[RR961
I. Ruts and P. Rousseeuw. Computing depth contours of bivariate point clouds. Computational Statistics and Data Analysis, 23:153-168, 1996.
[SamSO]
H. Samet. The Design and Analysis of Spatial Data Structures. Addison-Wesley, 1990.
[ZRL96]
T. Zhang, R. Ramakrishnan, and M. Livny. An efficient data clustering BIRCH: method for very large databases. In PTOC. ACM SIGMOD, pages 103-114,1996.
R. Agrawal, T. Imielinski, and A. Swami. Mining association rules between sets of items in large databases. In PTOC. ACM SIGMOD, pages 207-216,1993. D. Angluin and P. Laird. from noisy examples. Machine 2(4):343-370, 1988.
Learning Learning,
I. S. Bhandari, E. Colet, J. Parker, Z. Pines, R. Pratap, and K. Ramanujam. Advanced scout: Data mining and knowledge discovery in NBA data. Data Mining and Knowledge Discovery, 1(1):121125, 1997.
[Ben751
Multidimensional binary J. L. Bentley. search trees used for associative searching. CACM, 18(9):509-517, 1975.
[BL94]
V. Barnett and T. Lewis. Outliers in Statistical Data. John Wiley, 3rd edition, 1994.
[EKSX96]
M. Ester, H.-P. Kriegel, J. Sander, and X. Xu. A density-based algorithm for discovering clusters in large spatial databases with noise. In PTOC.KDD, pages 226-231, 1996.
[Gut841
223.51 1421.16
CS(105) 93.40 695.37
R. A. Johnson and D. W. Wichern. Applied Multivariate Statistical Analysis. PrenticeHall, 3rd edition, 1992.
[BCP+97]
[FPP78]
5-D NL 45.79
[JW92]
sifier for database mining applications. In PTOC. 18th VLDB, pages 560-573, 1992. [AIS93]
p = 0.9999.
[Haw80]
Identijcation of Outliers. D. Hawkins. Chapman and Hall, London, 1980.
[HCC92]
J. H an, Y. Cai, and N. Cercone. Knowledge discovery in databases: An attributeoriented approach. In PTOC. 18th VLDB, pages 547-559,1992.
[HKP97]
J. Hellerstein, E. Koutsoupias, and C. Papadimitriou. On the analysis of indexing schemes. In Proc. PODS, pages 249-256, 1997. 403