Alpha-Particle Stoyying CrossSection in Solids from 4pp keV &o 2 MeVf ... particle stopping cross section c with stopping element atomic number Z2 are.
BOOLCHAND,
ROBINSON,
YS ICAL REVIEW
VOLUM E
JHA
ACKNOWLEDGMENTS Our grateful thanks are due to Miss Ruth Mary Larimer of the Lawrence Radiation Laboratory, Berkeley, for her kindness in providing many sources of W' 8 and to Professor Donald F. Gibbons for putting the facilities of the Center for the Study of Materials at our disposal. Dr. W. R. Owens started the Mossbauereffect studies in Hf"' in this laboratory.
187,
NUM B ER
10 NOVEM 8 ER 1969
2
Stoyying Cross Section in Solids from 4pp keV
Alpha-Particle
187
tures of (227&10)'K for the y rays propagating along the c axis and (192+13)'K for the y rays propagating perpendicular to the c axis.
polycrystalline hafnium-metal absorber were found to have relative intensities of (0.36&0.12):1:1, which suggests that the Debye-Wailer factor is somewhat anisotropic; but because of the uncertainty in the intensity estimate, no definite conclusion can be drawn. The FWHM of the Mossbauer lines with the singlecrystal absorbers were found to be 3.2&0.1 mm/sec for the p rays propagating parallel to the c axis and 2.67+0.14 mm/sec for the y rays propagating perpendicular to the c axis. Since p is practically zero, the broadening of these Mossbauer lines must be attributed entirely to the effective thickness of the absorbers. The observed broadenings correspond to Debye tempera-
PH
AND
&o
2 MeVf
W. K. CHU ApG3 D. PowERs Baylor University, 8'aco, Texas 76703 (Received 20 May 1969; revised manuscript received 14 July 1969) Stopping cross sections of a particles from 400 keV to 2 MeVhave been measured to an accuracy of +3.6 to 17 elements (Be, C, Mg, Al, Ti, V, Cr, Mn, Fe, Co, Ni, Cu, Ge, Pd, Ag, In, and Sn). The experimental method consists of the elastic scattering of o. particles from a thick Ta backing onto which a thin layer pf target element has been evaporated. The energy loss of u particles in the target Qlm is determined by the difference in energy between a particles scattered from clean Ta and n particles scattered from Ta after having gone thrpugh the thin layer of target element. The results are compared with measurements by Porat and Ramavataram and by Gobeli and with estimates by Whaling; the discrepancies range from 1 to 20%. Structure in and a decrease of the o.-particle stopping cross section c with stopping element atomic number Z2 are 29. This dependence is not predicted by the Bethe-Bloch formalism valid at noticed in the region Z2=22 — higher velocities, nor by the Firsov or the Lindhard formalism valid at lower velocities. The oscillatpry structure of e on Zs is discussed qualitatively by comparing e (L' ) versus Zs with a Hartree-Fock-Slater potential 4 (r) versus Z, with E, related to the radius r by a velocity comparison. An empirical formula for e = c (E,Zs) has been constructed from the present measurements.
~4.9% in
I. INTRODUCTION 'N 1963 Ormrod and Duckworth' discovered that the electronic stopping cross section e;,„has an oscillating dependence on Z;, „.This oscillatory dependence (or periodic structure) of e;, on Z;, „has been verified at ~ -
thin low energies in boron, carbon, and aluminum 61ms'' and in gaseous media4' at higher energies (0.1—1.5 MeV) and Z;, &39 in thin carbon films, 'r and has also been verified in the channeling of heavy
t Research Foundation.
' J. H.
supported
Ormrod and H.
(1963). ' J. H. Ormrod,
in
part
by
E. Duckworth,
the
National
Science
Can.
J. Phys.
41, 1424
J. R. MacDonald, and H. E. Duckworth, Can. J. Phys. 43, 275 (1965). 3 J. R. MacDonald, J. H. Ormrod, and H. E. Duckworth, Z. Naturforsh. 21a, 130 (1966). 4B. Fastrup, A. Borup, and P. Hvelplund, Can. J. Phys. 46, 489 (1968). ' J. H. Ormrod, Can. J. Phys. 46, 497 (1968).
B. Fastrup, P. Hvelplund, and C. A. Sautter, Kgl. Danske Videnskab. Selskab, Mat. -Fys. Medd. 35, No. 10 (1966). ' P. Hvelplund and B. Fastrup, Phys. Rev. 165, 408 (1968).
ions in oriented 8' single crystals' and Si crystals. ' This oscillating phenomenon is of interest in that it was not predicted by the theories of Firsov" or of Lindhard, Scharff, and Schigtt" applicable in the low-velocity region of the incident ion. Several theoretical treatments" obtaining Zio oscillations from Hartree-Fock wave functions have recently been made. El-Hoshy and Gibbons" have correlated the periodic structure with electronic shell structure of the atoms. These treatments modify Firsov's or Lindhard's formalism in one way or another, and the authors successfully interpret the e;,
„
L. Eriksson,
J. A. Davies, and P. Jespergaard, J. Phys. 46, 561 (1968).
161, 219 (1967). F. H. Eisen, Can.
Phys. Rev.
'o O. B. Firsov, Zh. Eksperim. i Teor. Fiz. 56, 1517 (1959) LEnglish transl. : Soviet Phys. JETP 9, 1076 (1959) Lindhard, M. Scharff, and H, Schigtt, Kgl. Dansk. e Videnskab. Selskab, Mat. -Fys. Medd. 33, No. 14 (1963). ' I. M. Cheshire, G. Dearnaley, and J. M. Poate, Phys. Letters 27A, 304 (1968); C. P. Bhalla and J. N. Bradford, ibid. 27A, 318 (1968};K. B. Winterbon, Can. J. Phys. 46, 2429 (1968). "A. H. El-Hoshy and J. F. Gibbons, Phys. Rev. 173, 454
"J.
(1968).
—
j.
ALPHA
—PARTI
CLE STOP
P I NG
CROSS SECTION
measurements by Eriksson et al. in oriented % single crystals and by Eisen in Si crystals. The present experiment is different from the abovementioned experiments in two respects: (1) The above experiments are performed for a given target element by varying the projectile Z;, to study the dependence of the stopping cross section on Z;, „. The present experiment uses a fixed ion (n particle) with different target elements to study the dependence of e;,„on Zi„s. (2) The present experiment is performed at an intermediate ion velocity where the velocity of the projectile is of the same order of magnitude as the velocity of the least-tightly bound electrons of the stopping medium. No theory of the stopping process exists in this velocity region. The purpose of the present experiment is to measure n-particle stopping cross sections in various elements and at energies not previously reported and to see if a periodic structure exists in the dependence of 6j()~ on Z~»g.
o=
AND
ANALYSIS
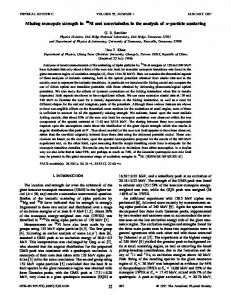
The experimental method was developed by Warters' for finding the stopping cross section of protons in I i. The technique is applied in the present experiment to measure the stopping cross section of n particles in various substances. The experimental procedure consists in evaporating a thin uniform layer of substance onto part of a known area of thick polished Ta backing. The thickness of the target (pox in pg/cm') is determined by weighing with a precision microbalance the backing before and after vacuum deposition. n particles are then elastically scattered from the Ta backing and from the Ta-plus-target area to determine the energy loss of n particles in the coated film. The experimental arrangement is similar to that used for previous range measurements""' made in this laboratory with a 2-MeV electrostatic accelerator. An 18-in. scattering chamber with solid-state detector is used for detecting the scattered o. particles. The signal from the detector goes through a preamplifier, linear amplifier, biased amplifier and enters a 200-channel analyzer with digital printout. The detecting system is calibrated with a mercury pulser. Figure 1 gives a diagram of the scattering geometry and the corresponding energy profiles for the scattered n particles from clean Ta and from Ta after having gone through the thin layer of target element (in this case, vanadium). Eia is the energy of the incident n particle. E» is the energy of the n particles scattered from the Ta surface, where by conservation of kinetic energy and W. D. Warters, Ph. D. thesis, California Institute of Technology, 1953, p. 38 (unpublished). ' D. Powers, W. K. Chu, and P. D. Bourland, Phys. Rev. 165,
376 (1968). W. K. Chu, P. D. Bourland, K. H. Wang, and D. Powers, Phys. Rev. 175, 343 (1968).
479
~«ia ~E~) -ATE&
TAR G FILM
„
II. EXPERIMENTAL METHOD
SOLI DS
IN
r ~rrrrrrr r vr«rrrrrrr r rrrrrrrrrrrrrrrrrr TAN TALUM BAC K N G
«rrrrrrrrrrrrrrrrrrrrrrrrrrrrrrrrrrrrrrrrrrrrr
BACK IN
TANTALUM
G
I
C. I
I
I~~
I
I
I
l
I
I
I
I
1000 ~ Ltj
~
8QQ
CL
xo 600 ItLI
Me V)
o 400 I- 20Q O
I
40
80
60
140
IOO
CHANNEL
I
60
I
180
200
NUMBER
FxG. 1. Typical example of the scattering kinematics and the corresponding energy profiles for the scattered o. particles. — 25', 8L, =130', and phd=59. 6 pg/cm'. Zip=1. 402 MeV 81 02 —— is the incident beam energy, E» =aE» —1.303 MeV is the energy of the 0, particles scattered from the clean Ta surface corresponding to the step of the profile (Ch&=183.9). E&0 is the energy of the n particles scattered from the Ta after having gone through the thin vanadium film. E20= 1.164 MeV, corresponding to the step of the profile at channel number 81.3, is calculated from the profile step number (Chp —81.3) by a channel-to-voltage and voltage-toenergy calibration. The shift of the step corresponds to the energy loss b, E=E2g — E2p ——139 keV.
momentum
we have
+2B &+1B) with
351 cos8L,
n=o. (Mi, Ms, 8r, ) =
+
Mt+Ms /Mi cos8r)' (
I
EMi+Ms 1
Mp
—Mi
Ms
+Mi
+
'I'
'
.
(2)
M~ is the mass of the o. particle, 3f2 is the mass of the Ta atom, and 8r, (=130') is the laboratory scattering angle. 8i (=25') is the angle between the normal and the incident n-particle beam of energy Eia 82 (= 25') is the angle between the normal and the scattered n-particle beam of energy E». E20 is the energy of o. particles scattered from the Ta surface after having gone through the V thin film. The energy difference DE=E» E20 is the energy loss of the n particles in going through the V film. This energy difference is obtained from the step shift of the corresponding profiles with a calibration which is established from the mercury pulser voltage and scattering kinematics. Several pulses of known voltages from the pulser are fed into the multichannel analyzer to obtain a voltage— versus —channel-number relation. This relation allows one to translate the channel number of each profile step into a voltage reading. The Esri from Eq. (1) corre-
—
W. K. CHU AND
480
sponds to a voltage reading obtained from the linear curve. Scattering of e versus —channel-number voltage — particles from the Ta surface at different accelerator energies enables one to construct a linear relation between scattered n-particle energy and pulser voltage by the least-squares method. All pulser voltage readings are then converted to n-particle energies from this curve. The stopping cross section of o. particles in a given target material is then given by'
0-(E*) =
312 cosgi (E2B — Epp)
1Vp(n+1) where 0~=02, Eo is Avogadro's number, and M2 is the particle mass of the stopping element. E, is an intermediate energy of the 0. particle in the coated layer, given by Warters as'
E.=
E2B+E20 E2B E20
n+1
+
2(n+1) r)+n
(4)
D. POWERS
187
Seventeen research-grade high-purity elements were used for targets in this experiment. They were Be obtained from Brush Beryllium Co. , Cleveland, Ohio; C obtained from Ringsdorff Werke GmbH. Mehlem, Rhein, Germany; Ni obtained from Chromium Corp. of America, Waterbury, Conn. ; and Mg, Al, Ti, V, Cr, Mn, Fe, Co, Cu, Ge, Pd, Ag, In, and Sn obtained from A. D. Mack. ay, Inc. , New York. , N. Y. The evaporating techniques and refractory support materials for evaporating targets depend on the melting points, alloying ability, evaporation rate, etc. Refractory support materials were obtained from R. D. Mathis, Co. , Long Beach, Calif. Holland's guide'~ was used for preparing the thin Alms. Fifty-six targets of different thickness were used in this experiment. For each element at least two targets of different thicknesses were used to show that the cross-section measurements were independent stopping — of the target thickness used. The thicknesses varied from 13.4 pg/cm2 (one of the Be targets) to 184 pg/cm2 (one of the Sn targets), and most of the targets had thicknesses of 30—90 pg/cm2.
where g is defined as 0 (E20)/0 (EiB) the ratio of the -particle stopping cross section at E20 to that at E~~.
IV. TESTS OF EXPERIMENTAL PROCEDURE
IIL TARGET PREPARATION
Stopping cross sections of n particles in Al were measured at 0.5, 0.8, 1.1, 1.4, and 1.7 MeV by analyzing in a 60' spectrometer the He+ and He++ beams emerging from the Al coating. The measurements with He+ and He++ agreed within experimental accuracy as anticipated since charge equilibrium had been established by the time the scattered He beam emerged from the Al. Although dE//pdx was measured by detecting, say, He++ with the 60' magnetic spectrometer, this does not mean that dE//pdx of He++ was measured in the target. The charge-exchange process is a random process, and the measured dE/pdx is actually an average value of the energy loss of all different charge states of the He ions. The counting rates of the He+ and He++ ions emerging from the target at 1.4 MeV were compared, and the He+-to-He++ scattering-cross-section ratio was observed to be about 1 to 8, a charge fraction in fair agreement with the prediction of 1 to 7 reported in SNclear Data Tables. The dE/pdx measurements in Al with 60' inagnetic spectrometer agreed with those obtained from the solidstate detector within experimental accuracy, thereby indicating that the energy measurements were consistent.
O,
The preparation consisted of vacuum evaporation of a target element onto a highly polished Ta backing. Ta was selected since it is desirable to have a backing with somewhat higher mass number than the mass number of the coating substance, or else the magnitude of E2~ will be close to that of E2B (see Fig. 1), and large uncertainties will be introduced in the energy determination. Throughout the experiment 0.005-in. Ta foils with a bright Zendiner knish from Fansteel Metallurgical Corp. , Chicago, Ill. , were used. Each Ta blank. was cut into a 1)&2-in. piece and polished with Wenol metal polishing compound, and then washed thoroughly with acetone, distilled water, liquid soap, and again with distilled water several times. After the Ta blank. was cleaned and dried, it was weighed carefully on a Mettler M-5 microbalance. Five weighings were made each time, and their results were averaged. The Ta blank was then sandwiched between two pieces of Al plate. One of the Al plates which covered the polished Ta surface had a circular opening of 2.85 cm'. This area was chosen to provide suKcient weight of deposited material to minimize the percentage error in the weighing technique as well as to provide space for several different beam positions on the target so that several dE//pdx measurements could be made with the same target. Target elements were then deposited by vacuum evaporation onto the Ta backing within the above-mentioned area. After deposition, the weighing process was repeated and the thickness of the target was calculated.
A. Spectrometer Test
"
B. Other Tests The geometry of the scattering chamber was carefully checked. A range measurement of oxygen in Be
"L.
Holland, Vacelm Deposition of Thie Ilies (Chapman and Hall Ltd. , London, 1963). ' J. B. Marion, 1960 ENclear Data Tables (U. S. Government Printing Ofhce, Washington, D. C., 1960), Part 3, Pig. 12.
ALP HA —PARTI CI. E STOP P I N
—
130' lab scattering was made at both +130' and angles. The agreement of these range measurements 130' were symindicated that the angles +130' and metric with respect to the 0 reference position. Most of the n-particle stopping —cross-section measurements were made at +130'. The measurements in Ni and Co were made at both 1.30' and 90', and the measurements in Fe were made at 90', 130', and 160' in order to check the scattering geometry. The agreement of these within experimeasurements stopping-cross-section mental accuracy proved the measurements to be independent of scattering angle and also provided a check on
6 CROSS SECTION
IN
SOLI DS
TABLE I. Experimental accuracy of the o.'-stopping cross-section measurement in Ag. (er —25'& Hz=130', pox=49. 8 pg/cms. )
—
the scattering-chamber geometry. The uniformity of each target was checked as follows: e particles of the same energy were scattered from three diferent spots on each target coating to determine if the midpoint of the steps (see Fig. 1) remained essentially at the same channel. The agreement within &2 channels in all cases indicated that the target was uniform within +2%, since the separation of the midpoint of the backing step from the midpoint of the targetplus-backing step was always around 100 channels. The accuracy of reading the midpoints depended on the resolution of the step; this resolution is a function of target thickness for target-plus-backing profile. Targets of uniformity worse than +2%%uq were discarded and not used in the experiment. Tests were also made of the scattering-chamber detecting electronics during each stopping-cross-section measurement by monitoring the shape and height of the pulses to ensure that the pulses were not distorted by improper gain, bias level, and voltage settings. Stoppingcross-section measurements were also made by using different detectors, different preamplifiers, and diferent biased amplifiers with all kinds of combinations. The within experimental agreement of the measurements accuracy proved the measurements to be independent of the electronics equipment used. A linearity test of the electronics system was made by feeding eight pulses at different voltages into the preamplifier to cover all channels of the multichannel versus— analyzer used in the experiment. A voltage — channel-number plot indicated the linearity to be good to one channel. Both long-term and short-term stability tests of the electronics were also made during the experiment, and the over-all stability of the detecting system was better than one channel.
V. ACCURACY
The sources of experimental error are listed in Table I, where the first column gives the parameter entering the stopping-cross-section calculation, the second column gives the probable error in each parameter, and the third column gives the error contribution to the stopping calculation. The case given in Table I is the probable error of the n-particle stopping-cross-section measurement in Ag, but the result is typical for all targets used
Probable error Source of error 0&
81, pb, x
AE
Uncertainty in incident angle Uncertainty in scattering angle Uncertainty in Sm thickness due to (i) uniformity of 61m (ii) uncertainty in coating area (iii) uncertainty in weighing Uncertainty in energy loss due to (i) uncertainty in midpoints of the steps (ii) uncertainty in pulser calibration (iii) stability of electronics (iv) linearity of electronics (v) uncertainty in scattering energy due to uncertainty in eL (vi) uncertainty in incident energy
+1B Root-mean-square
in source
Probable error in t from this source
0.3' 0 30
0.24'Fo
2o lo 1.6 %
1. 1.3 jtkg 6'%%uo
0.92%
1.61
2.03%
channels
1.5%
1.0 % 1.5 %
0.3'
0.01%
o3%
42%
probable error:
in the experiment, although the values for diferent targets may Quctuate somewhat about these values because of the target thickness used. There is generally a decreasing percent of error with thicker target. The effect of each error is obtained by independently varying the appropriate parameter which appears in the calculation for the stopping cross section $Eq. (3)$. The overall uncertainty in the measurement of o.-particle stopping cross section in solids varies from 3.6 to 4.9 jq.
VI. RESULTS The experimental results are tabulated as a function of the energy in Table II and are plotted in Figs. 2 and 3. In these figures are included Porat and Ramavataram's dE/pdx measurements" (&5% accuracy) of rr particles in C, Al, Ni, and Ag. The inverted triangles with &10% accuracy in Figs. 2 and 3 are obtained by differentiating" the range measurements of Gobeli. The squares (called Whaling's estimate in the present discussion) are dEjpdx values of n particles in a given material as calculated by Whaling" from the effective charge of n particles and the dE/pdx of protons" in the same stopping material at the same velocity as the o. particles. The dashed lines in Figs. 2 and 3 are obtained by a least-squares fit of a portion of the present measurements to a curve of the form e = (A/E) ln(BE). The
"
~9 D. I. Porat and 78, 1135 (1961).
K. Ramavataram, Proc. Phys. Soc. (London)
W. Whaling, in IIarldblch der Physik, edited by S. Fliigge (Springer-Verlag, Berlin, 1958), Vol. 34, p. 193. G. W. Gobeli, Phys. Rev. 103, 275 (1956). ~The proton stopping measurements were done by several groups [M. Bader, R. E. Pixley, F. S. Mozer, and W. Whaling, Phys. Rev. 103, 32 (1956); D. W. Green, J. N. Cooper, and J. Harris, ibid. 98, 466 (1955); H. K. Reynolds, D. N. F. Dunbar, W. A. Wenzel, and W. Whaling, ibid 92, 'i42 (1953.) and reviewed by W. Whaling (see Ref. 20).
"
j
KV.
IZ.
c HU
AN D
D. POWERS
187
TABLE II. Energy loss of n particles in various stopping materials. Column 1: stopping material in order of increasing atomic number, along with the averaged percentage probable error. Column 2: n-particle energy PE of Eq. (4)]. Column 3: energy loss in keV cm'/pg. Column 4: stopping cross section s in 10 "eV cms.
Stopping material
Be (4 9'Fo)
C (4.2%)
Energy (keV)
dE/pdx (keV cm'/pg)
459.4 603.0 740.0 883.6 1033.3 1182.7 1326.0 1465.6 1616.6 1756.3 1894.5 1987.7
. 1.81 1.79 1.74 1.71 1.66 1.56 1.47 1.44 1.40 1.35 1.26 1.24 1.62 1.76 1.79 1.87 1.85 1.88
386.8 455.8 522.9 593.7 664.6 737.5 809.9 879.0 959.9 1026.3 1109.2 1172.9 1260.3 1322.1 1403.9 1464.2 1549.9 1608.7 1698.0 1748.9 1836.4 1892.4 1941.5
1990.7 Mg (3 8%)
412.0 489.3 557.5 630.9 699.0 791.2 852.7 922.8 989.3 1072.3 1159.6 1224.8 1305.8 1374.4 1451.7 1530.1 1602.3 1672.8 1743.2
1817.7 1891.8 1968.7 Al
(39%)
385.9 449.0 524.5 590.0
661.9 735.9 794.6 831.9 876.0 957.8 1023.8
1,85
1.90 1.80 1.82 1.76 1.72 1.66 1.64 1.59 1.55 1.50 1.51 1.43 1.44 1.35 1.35 1.34 1.33 1.34 1.38 1.42 1.44 1.43 1.41 1.39 1.39 1.40 1.36 1.30 1.34 1.25 1.25 1.21 1.27 1.21 1.20
(10» eV cm') 27.0 26.8 26. 1 25.6 24.8 23.4 22.0 21.6 20.9 20.3 18.9 18.6
32.2 35.1 35.6 37.3 36.9 37.5 36.9 37.9 36.0 36.2 35.1 34.2
Stopping material
Energy (keV)
dE/pdx (keV cm'/pg)
Al
1098.8 1168.6 1260.0 1324.2 1396.1 1461.2 1552.3 1613.4 1701.4 1752.7 1848.1 1904.7
1.14 1.10 1.12 1.09 1.09 1.06 1.06 1.05 1.05 1.06 1.01 0.974
437.2 582.6 723.1 873.0 1018.6 1168.3 1314,4 1459.7 1609.6 1754.3 1901.4 2001, 1
1.16 1.20 1.20 1.22 1.15 1.16 1.10 1.06 0.998 0.985 0.930 0.947
407.8 556.8 688.2 830.2 980.7
1.11 1.18
(3.9%)
(4. 1%)
33.1
32.8 31.8 30.9 29.9 30.1 28.5 28.7 26.9 26.9 26. 7 26.6
1, 15 1.16 1.15 1.13
56.5 55.6 57.2 58.0 57.9 56.7 56.2 55.9 56.4 55.1 52.3 54.2 50.6 50.5 49.0 51.4 48.8 48.6 46.2 47.0 46.6 45. 7
1.20 1.22 1.25 1.24 1.21 1.18 1.17 1.22 1.16 1.16 1.18
53.8 54. 7 55.9 55.5 54.2 52.8 52.3 54.5 51.9 52. 1 52. 7
V (3 &%)
Mn
50.9 49.3 50.4 49.0 49.0 47.4 47.3 47.0 46.9 47.3 45.0 43.6 92, 1
95.2 95.7 96.9
91.5
92. 1 87.1 83.9 79.4 78.3 74.0 75.3
0, 970 0.976 0.941
706.8 852.6 998.8 1156.0 1302.8 1452.2 1604.2 1746.9 1865.1 1949.0 2028. 7
0.930 0.973 0.990 1.01 1.01 0.969 0.944 0.926 0.909 0.855 0.829 0.825 0.825
80.2 84.0 85.5 87.2 87.2 83.6 81.5 80.0 78.4 73.8 71.6 71.2 71.2
352.4 412.2 523.0 627.6 698.3 777.9 848.8 920. 1 988.7 1102.3 1214.3 1280.6 1398.2 1515.8 1582.6 1690.1 1811.0 1889.1 1962.1
0.807 0.869 0.876 0.934 0.920 0.912 0.928 0.930 0.940 0.885 0.890 0.864 0.856 0.830 0.846 0.805 0.783 0.781 0.792
73.6 79.3 79.9 85. 1 83.9 83.2 84.6 84.8 85.7 80.7
1273.8 1420.2 1571.2 1729.0 1865.1 1955.9
(36%)
"eVc cm')
94.0 99.4 100.1 100.1 96.2 94.5 93.4 89.5 85. 1 82.0 82.5 79.6
1139.6
Cr (3 7%)
(10
416.0 570.4
1, 18
1.18 1.14 1.12 1.10 1.06 1.01
81.2
78.8 78. 1 75.7 77. 1 73 4 71.4
71.2 72.3
ALPHA
—PARTICI E
Twsr. z Stopping material
Energy (keV)
Fe (3.8%)
431.1
Co (3 8%)
Ni (3 9%)
di
856.7 1006.6 1152.3 1300.0 1444. 1 1591.2 1739.6 1885.5 1979.2
0.927 0.977 1.01 1.02 1.00 0.990 0.955 0.925 0.905 0.847 0.837 0.811
435.6 565.4 718.7 856.7 1008.0 1151.6 1291.5 1447.2 1599.7 1738.6 1896.4 1989.1
0.743 0.812 0.838 0.840 0.838 0.821 0.822 0.782 0.772 0.759 0.730 0.719
433.3 587.0 717.4 863.3 1007.2 1163.7 1299.2
0.707 0.762 0.791 0.813
570.3
713.2
0, 795 0.793 0.780 0.777 0.778 0.747 0.727 0,717
1444.3 1592,2 1748.5 1887.0
1987.5 CU
(3 7/o)
Ge (4 o%)
Pd (4 2'Fo)
0.592 0.648 0.669 0.695 0.675 0.697
(10
eV clll )
85.9 90.6
93.1
Stopping material
P(i
788.7
933.5 1071.2 1167.5 1261.1 1364.7 1466.8 1550.8 1627.2 1732.5 1839.9 1922.2 2007. 1
Ag
(3 8%)
80.3 80.4 76.5 75.5 74.2 71.4 70.3 68.9 74 2
77.0 79.2 77.4 77.3 76.0 75.7 75.8 72.6 70.9 69.9
0.701 0, 691 0.708 0.679 0.662 0.647
441.4 591.5 725.4 870.3 1017.9 1169.1 1308.9 1453.3 1599.9 1747.0 1890.3 1984.1
0.765 0.820 0.828 0.820 0.806 0.792 0.777 0.787 0.726 0.721 0.716 0.703
92.2 98.8 99.8 98, 8 97.1 95.4 93.6 94.8 87.4 86.9 86.3 84. 7
0.532 0.579 0.623
94.2 102.5 110.3
parameters A and 8 and the region of validity of the curve are given in Table III for each stopping element.
Energy ( eV)
(4.2%)
88.6 85.7 83.9 78.5 77.6 75.1 72.7 79.5 82.0 82.2 82.0
I N
SOLIOS
ontzntted)
91.7
62.4 68.3 70.6 73.3 71.2 73.5 73.9 72.8 74. 7 71.6 69.8 68.2
449.4 581.3 677. 1
(C.
94.7 93.0
417.7 571.5 686.7 829, 9 966.9 1142.8 1274.8 1420.0 1567.7 1723.0 1863.7 1953.7
.
II
/pdx
(keV cm'/p, g)
CROSS SF CTION
STOPPING
In
(45%)
Sn
(3 &'%%uo)
0.624 0.640
0.643 0.629 0.612 0.614 0.566 0.587 0.551 0.536 0, 529
0.532 0.523
448.4 585.9 721.4 850.5 1009.1 1143.9 1278.0 1420.5 1571.7 1733.8 1862.0 1961.1
0.517 0.571 0.588 0.613 0.615 0.611 0.604 0.590 0.567 0.543 0.534
565.2 693.4 751.0 834.2 891;4 980.0 1038.8 1132.8 1179.1 1274.6 1329.2 1417.8 1471.1 1561.1 1709.3 1846.9 1945.1
0.569 0.602 0.585 0.580 0.566 0.608 0.591 0.599
375.6 436.5 508.5 572.8 652. 1 720.4 796.1 864.2 938, 1 1006.0 1088.0
1156.2 1234.8 1298.3 1389.4 1445.2 1529.7 1590.6 1679.8 1744.0 1825.2 1926.4
In Fig.
dLt, /pds (keV cm'/pg)
0, 509
0, 613 0.595 0.614 0.574 0.594 0.577 0, 555 0, 527 0.521
0.541 0.555 0.577 0.590 0.595 0.589 0.611 0.604 0, 603
0.600 0.592 0.586 0.585 0.578 0.570 0.557 0.566 0.549 0.544 0.526 0.522 0.515
(10
"ev ctn') 110.5 113.4 113.9
111.5
108.4 108.7 100.2 104.0 97.5 95.0
93.7
94.3 92.6 92.4 102.2 105.1 109.7
110.0 109.3 108.1 105.6 101.4 97.1 95.6 91.0 108.4 114.8
111.6 110.6 107.9 115.0 112.6 114.1 116.8 113.4 117.0 109.3 113.2 110.1 105.8 100.5 99.2 106.5 109.3 113.7 116.2 117.2 116.1 120.4 119.0 118.8 118.2 116.6 115.5 115.3 113.8 112.3 109.7
111.5
108.1 107.2 103.7 102.9 101.5
2 the agreement between Whaling's estimate and the present measurements in Be is from 8'Pq at the low-energy end. to 13 j~ at the high-energy (&20%%u~)
K. CHU AND D. POWERS 2.0
—
9— 1.8— l.7—
I
I
I
I
I
I
I
I
I
I
I
I
I
I.6
Be
I.
3—
l. 2—
t1
0.4
I
I
I
II
I
I
I.o
0.8
0.6
l2
ENERGY
—
!
~
I
I
I
I
I
I
I
I
l.6
l
I
I
I
I
I
I
I
I
I
I
oE
1111 11111111 0. l.4 I.O I.2 ENERGY (MeV)
8
l.6
I
2.0
l.8
I
I
I
I
I
0.8
I
l
I
l.2—
4,
I
I
1
I
t
I
I
I
I
I
'
0.9 0.8—
x
0.4
I
I
I
I
I
I
I
I
I
I
I
t
0.8
— 3— 2—
I.4 I.
I
I
I
I
I
I
I
I
4
l.2
l.
(MeV) I
I
I
I
I
I—
I. I.o— 0.9—
I
J
I
I
I
I
II
~ a~
0.7— 0.6—
1111 0
I
0.8
0.6
I
I
I
I
I
I
I
I.6
1. 1.2 I.4 ENERGY (MeV)
I
I
I
2.0
I.8
0.4
I
I
I
I
I
0.8
0.6
o—
I
I
I
I
I
I
I
I
I
I
I
i
I
1
I
I-
Mn
0.9-
0.8-~
44&
0.7 I
I
0.4
I
I-I
I
0.8
0.6
I
~ 1.0—
I
I
I
I I
I
I
I
I
I
I. 2 I.4 ENERGY (MeV)
I
I
I
I
I
1
I
I
I.6
I. 0
I
I
I
— — X I.
I
~
0.9—
111o 11 2 t
0.8
0.6
I
]'
l
I
1
~
~~ ~
I
0.4
I
0.4
I
I
I
I
I
I:
— I
I
0.6
I
I
I
I
I.6
I
I
2.0
I.8
I
I
I
I
I.o
0.8
11
I. 2
I
I
I
I'I
I
I
0.7—
I
I
0.4
0.4
I
I
I
l.6
2-0
0.6
I
0.8
I
I
I
I.O ENERGY
I
I
I.2
I
I.4
(MeV)
I
t
I
I
I.6
I
I
1.8
I
I
2.0
I
t
I
I
I
I
&
I
I
I
I
~
j
~ I ~I
I
I
I
I
I
l
I
I
I
I
I
I
I.6
1.4 (M eV)
I
I
I
I
I
o.7 I 0.6— 0.5
t
I
~ ~
t
0.8 I
I
| I
04
t
e K
I
I
t
t
I
t
1.2 1.4 1.0 ENERGY (M eV) I
I
I
I
I
I
I
l.o
I
I
1
I
0 I
I
0.6
I
I
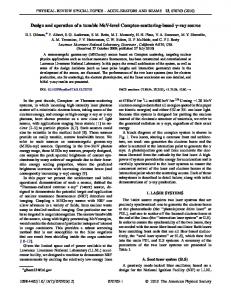
FIG. 3. Energy loss of n particles versus energy in Mn, Fe, Co, Ni, Cu, Ge, Ag, Pd, In, and Sn. The present measurements (+3.6 to 4.9/0 accuracy) are given 2.0 by the dark circles. The triangles are the measurements (~5'Po accuracy) of Porat and Ramavataram. The inverted triangles I(+10j& accuracy) are due to Gobeli, and the squares (+20% accuracy) are estimates by Whaling from proton-stopping— I— cross-section measurements. The dashed 2.0 line is a least-squares curve fit to a portion of the present measurements (the equaj— tion and curve-fitted parameters are given in Table III).
t111111.6
I
I.8
I
I
I
I
I
e.~
I
I
4
I
1
I
~4
I
I
I
I
l.8
l.6
(Me V) t
f
I
- H-t
t
I
I
Sn
~
I.
I
I
g
~
rr
ln
+-~ +~-a.
11
0.8
I
I
I
I.2
~ ~ ~a~
~ ~ ~
~
I2,0
I.8
IF
ENERGY
S: '-I
I—
Te
I.2
I.O
0.8
0.6
0.6— 0.5 g 0.7—
I
2.0
&
I
~
I
I
A II
0.4
O. I
» I
—
—
I
I.8
I
.8
I
~V
0,8
0.6
0.8 0.
05~
I
l.4
I
I-!
'T
7—
(M eV)
1
I
I
0.6— I
I
0.6
07—
I
I
II W
'K
0.6—
Nj e
l
0.4
I
~
0.9 0.8—
r-
Co
ENERGY
I.O
~,
I
e
0.6—
0.9— 0.8— 0.7 —~ 4 0.6—
I
I
I
I
target thicknesses. Between two of the C measurements, an Ag target was inserted in the scattering chamber, and dE/pdx measurements of z particles in Ag were made. lt is seen in Fig. 3 that the Ag measurements by all groups are in excellent agreement. When the C measurement was repeated at all n energies with a di8erent target thickness from that used before the Ag measurement, the same result in C
ENERGY
I. 1. I.4 ENERGY (MeV)
~ ll ~
& O8— ~ LtJ ~ 0.7—
I
I
I, l.6
0.5—
0~-I
I
I
I
I
(MeV)
Cu
0.6—
04
O
I
1
0.7— 0.6 —~
2.0
0.8—
o 07
I
—
08— -
I
I.8
4 0.9— ol
o.9
I
I.4
~
diferent
The present C measurements
I.
I
I.2
«f
~
dE//pdx
among the measurements is unknown. are reproducible with four
the disagreement
I
I
l.o ENERGY
end. Porat and~Ramavataram's measurement in C at 0.4 MeV is 15% higher than the present measurement and at 1.3 MeV is 6% lower than the present measurement, with the crossover occurring at 0.88 MeV. Whaling's estimate of dE/pdh in C are from 9 to 20% higher than the present measurements. The reason for
I
2,0
I
08— 0.4
I
I.8
I
111111111 l. o
0.6
t
I.6
I
I
FIG. 2. Energy loss of o. particles versus energy in Se, C, Al, Mg, Ti, V, and Cr. The present measurements (~3.6 to 4.9% accuracy) are given by the dark circles. I— The X's are the 60'magnetic spectrometer l I I test measurements (see text) of the presV ent experiment in Al. The triangles are the measurements (+5'Pa accuracy) of 4I'~ ~ Porat and Ramavataram. The inverted 0 triangles (+10'Pe accuracy) are due to Gobeli, and the squares (+20% accuracy) I-I I I I 2.0 are estimates by Whaling from protonI.6 I.8 stopping cross-section measurements. The dashed line is a least-squares curve fit to I I a portion of the present measurements Cr (the equation and curve-fitted parameters are given in Table III). I
I
I.4
I.2
I.O
I~
~
—
I.
I
I
1
Mll
ENERGY
I
I
I
~ I. I I.O—
).s-I ~ I.5—
0.6
I
or
&o.~
I
I
0.6
0.4
~I4 —
C
~ I.8-&' 1.7—
0.4
I
ENERGY (MeV)
I
I
I
I
I—
2.0
l.8
L
~ I4—
~ ~ ~ e
(M eV)
I
I
11
I
I.4
e
E o 2.0—
Id
I
~ ~ 0
l.o— 0.9— 0.8—
I4—
1.
2.l
I
I.
l.6— l.5—
.
—
5— !4—e I.5— l.2—
I
1.
I87
I
l.o l. 2 l.4 ENERGY (MeV)
Pd
o-
I
I
l.6
I
'
I
l.8
I
I2.0
ALPHA —PARTI CI. E STOP P I NG CROSS SECTION I I
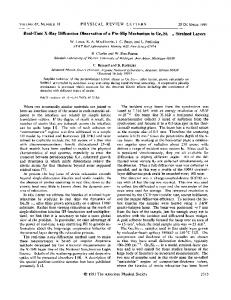
FIG. 4. Stopping cross section ~ of versus the stopping element atomic number Z2 at 8 =2.0 MeV. Present measurements &3.6 to 4.9% accuracy), Porat and Ramavataram's measurements (+; &5% accuracy), Gobeli's data (&; +10% accuracy), and Whaling's estimates (g; &20'% accuracy) from protonstopping measurements. A solid line is used to connect the e measurement in the range Z2 = 22 —29 to show the structure of e in Z2. The dashed line is an empirical formula e, (E,Z2) (see text) obtained from the present measurements. The small 6gure is the proton-stopping cross section e„versus Z~ for E„=0.5 MeV, Z~ =23-32 (see Ref. 22). Units on the ordinate are the same in the small and large figures.
a particles
(;
Ol
O
I
O
I
I
I
I
IO—
IOO—
~
90— 80— 70— 60—
v
I
I
I
I
I
=20
Ea
I
I
I
I
I
I
SOLI DS
IN
I
I
I
I
I
I
I
I
I
I
I
I
Mev
Measurement ('-3.6-4.9%) Porat 8 Ramavataram (+5%) Gobeli (+l0%) Estimate (+ 20%) Whaling's
Present
——- Empirical
Curve
Il
g / /
g
T g/
I'
/
II
/
/
/
I
I
I
Ep a
0,5
Mev
I
0
/~
g /
I
20
9(
l8—
/
5/
/
/
/
r
50— 40—
/
/
/
/
/.
I
I
I
24
a,P'.
I
I
I
52
28 Z2
lIt
20
lO— I
0
I
4
I
I
I
8
I
I
l2
I l
I
I
6
ATOM
was obtained as before the Ag measurement. Porat and Ramavataram's measurements in Al are about 5% higher at the low-energy end and about 3% higher at the high-energy end than the present measurements in Al. At 0.6 MeV Gobeli's measurement in Al agrees with the present measurement, but his data at other energies are 9—14% higher than the present measurements. Whaling's estimate in Al is about 9% lower at the lowenergy end and 8% higher than the present measurements at the high-energy end. The agreement between Whaling's estimate in V and the present measurement in U is within. 3%. In Cr his estimate at 0.79 MeV is about 10% higher and at 2 MeV is 5% higher than the present measurements. In Fig. 3 the agreement between his estimate in Mn and the present measurement in Mn is within 5%. His estimate agrees with the present measurement in Fe to within 5%. In Co the agreement is within experimental
accuracy. The present measurements in Ni agree within experimental accuracy with Porat and Ramavataram's measurements. At 1.2 MeV Porat and Ramavataram's measurement is 5% lower and Whaling's estimate is 10% higher than the present measurement. Gobeli's dE/pdx in Cu agrees with the present measurernenta at 1 MeV but is about 10% higher at 2 MeV. Whaling's estimates are from 4 to 7% higher than the present measurements in Cu. His estimate in Ge is available only above 1.59 MeV and is 6% lower at 2 MeV than the present measurement in Ge.
I
20 I
I
I
I
I
I
I
28 52 NUM 8 ER
C
I
I
40
36
24
44
I
I
48
I
52
Zp
The present measurements of dE/pdx of rr particles in Pd, In, and Sn are plotted in Fig. 3. Whaling's estimate is available only for Sn as a stopping element, and is in good agreement with the present Sn measurements.
VII. DISCUSSIO& An attempt has been made to see whether a systematic relation exists between t. and the atomic number Z2 of the stopping elements in the energy region 0.4 TABLE
III.
Curve-6tted
for
parameters
dE/ada
= (A/E)
Xln(BE) of n particles in solids as a function of energy. Eq~&E~& 2.0 MeV. The 6tted curves are plotted in Figs. 2 and 3. Ep represents the lowest energy for which the curve Qt applies. Stopping material
Se C Mg Al
Tl V Cr Mn
Fe Co Ni CU
Ge
Pd Ag
In
Sn
8
(keV cm'/pg MeV)
1.175 1.290 1.167 1.007 0.955 0.965 0.894 0.836 0.846 0.838 0.872 0.891 0.810 0.568 0.594 0.642 0.572
jv~
(MeV ')
(MeV)
4.12
0.75 0.55 1.00 1.00 0.75 0.80 0.60 0.90 0.70 1.00 1.00 1.15 1.10 0.60 0.80 0.95 0.85
3.98 3.26 2.97
3.45 3.34 3.08 3.01 3.33
2.73 2.53 2. 15 2.73 3.08 2.83 2.55 2.88
W. K. CH
l
I
U
D. POWERS
AN D
0 =-
y
IOO—
&&
l. 6
E~ =
&IO
j ~
MeV II
80—
II
FIG. 5. Stopping cross section ~ of versus the stopping element atomic number Z~ at I' =1.6 MeV. Present measurements +3.6 to 4.9~j& accuracy), Porat and Ramavataram's measurements (+; +5'P~ accuracy), Gobeli's data (+; &10'P& accuracy), and Whaling's estimates &20% accuracy) from proton( stopping measurements. A solid line is used to connect the e measurement in the range Z2 ——22 — 29 to show the structure of e in Z2. The dashed line is an empirical formula e (E,Z2) (see text) obtained from the present measurements.
e particles
/
y /
70—
~/
/
(;
/
/
II / /
60—
/
/
~;
/
50— O
y
30— 20
Present
y/
40—
/
/
/ /
—
('-5. 6 — 4.9%)
Measurement
Porat 8 Ramavataram Gobeti (+l0%}
Estimate (+-20%)
Whaling's
/
Empirical
0'-~~
('-5%)
Curve
10~ I
I
0
4
I
I
I
I
!2
8
I
I
I
I
20
l6
I
I
I
I
28
24
NUMBER
ATOMl C
I
52
I
40
I
I
I
48
52
of the energy, has a value between roughly 1 and 2; (2) the velocity of the u particles is of the order of the velocity of the orbital electrons of the stopping element;
n particles in this energy region the stopping process is complicated by two considerations: (1) The n-particle effective charge, which is a function
I
I
I
44
Z2
&E&2 MeV. For
I
I
I
I
56
I
I
I
!
I
I
T
1111
j
110 Ea
100—
=
2 Mev
I
90~
/
yJ
/
80—
/
y //
70— D
/
II / /
60— 50—
r
/
/
/
(;
/
(+; (+;
/
/
Present Porat
/
I
y
40
y /
o. particles versus
/
~
IA
FrG. 6. Stopping cross section e of the stopping element atomic number Z2 at E~ =1.2 MeV. ~3.6 to Present measurements 4.9'P& accuracy), Porat and Ramavataram's measurements ~5'P& ac&10'Po curacy), Gobeli's. data accuracy), and %haling's estimates +20/~ accuracy) from protonstopping measurements. A solid line is used to connect the e measurement 22 —29 to show the in the range Z~ — structure of e in Z2. The dashed line is an empirical formula e (E,Zq) (see text) obtained from the present measurements.
/
/
/
/
8
v
G
y
Wha ling s
obeIi
I
—---Empirical
/
(g;
Measurement (+&.6-4.9%) Ramavataram(+5%) (+ 0%)
Estimate (+20%) Curve
yX /
20— I
0
~ I
0
I
4
I
I
8
I
I
12
I
I
16
I
I
20
ATOMI C
I
I
I
24
I
I
28
NUM HER
I
I
52
I
56 Z~
I
I
40
I
I
44
I
I
I
48
52
ALPHA —PARTI CLE STOP P I NG CROSS SEC I ION
IN
SOL I DS
20—
l
I
IO—
E&
=0 8
MeV
loo— Fro. 7. Stopping cross section
of n particles versus the stopping element atomic number Z2 at E =0.8 MeV. Present measurements +3.6 to ( 4.9'Po accuracy), Porat and Ramavataram's measurements &5% ac&10'Po curacy), Gobeli's data accuracy), and Whaling's estimates +20% accuracy) from proton( stopping measurements. A solid line is used to connect the e„measurement in the range Z2 —22—29 to show the structure of e in Z2. The dashed line is an empirical formula ~ (E,Z2) (see text) obtained from the present measurements. ~
/
~;
80—
(+; (+;
70— 60—
~;
CV
E O
1A I
O
/
/
/
r /
/
g
/
/
/
/
II
/
/
/
/
/
/
Ir
/
V
/
/0
/
/I
~
50—
~
40—
g
/
/ 11
/
Whaling
——Empirical
—
11/ /
/
/
Pr e sent
Measurement
('3.6-4.9%)
Porat 8 Ramavafaram('5%) v Gobeli (+ l0%)
/
s Estimate (+20%) Curve
/
E"-
20— lO— 0
4
8
i6
t2
AT
in this velocity region neither the adiabatic nor the sudden approximation can be applied for constructing a quantum-mechanical theory of the energy-loss problem. There is no theoretical calculation available at present for n particles in this energy region. e versus Z2 for E = 2.0, 1.6, 1.2, and 0.8 MeV is given in Figs. 4, 5, 6, and 7, respectively. The closed circles are the e either obtained from the curve fit (see Table III) to the present experimental data, or are interpolated from the present experimental measurements. The dotted curve is an empirical formula based on the measurements of this experiment, and will be discussed later. In Figs. 4—7, e increases with the atomic number of the stopping material Z2, except in the region Z2= 22 —29 (Ti to Cu) where a zigzag exists, and where e decreases with increasing Z2 except at Z2= 26, which is higher than neighboring Z2 values. A plot of proton stopping cross section" e„ in Zs=23 —29 (Zs=22 information is not available) reveals a similar dependence of e„with Zs (see, for example, Fig. 4, where e~ is plotted at E„=0.5 MeV; protons of this energy have the same velocity as rx particles at 2.0 MeU). The zigzag and decrease of e with Z2 in the region Z2= 22 —29 is definitely outside the present experimental error, particularly at the lower n energies. The observation of the same effect in proton stopping cross sections, as seen in Fig. 4, gives strong support to the reality of the present 6ndings. It is also seen from Figs. 4-7 that the amplitude of the zigzag and the decrease of e with Z~ in the range Z2=22 —29
"
20 0 Vi C l
24 N
28 52 0 Mi 9 E R
56
40
44
48
52
Z~
are distinctly energy-dependent. Both effects are more pronounced at 800 keV than at 2 MeV, and there appears to be a diminishing of the effect with increasing ion energy. At higher energies (considerably higher velocities Andersen than those of the present measurements) 30 et a/. 23 report the energy loss of protons in the Z2= 20— region for E~=2.25—12 MeV, but the above-mentioned zigzag and the decrease of e„on Z2 are not explicit in their measurements. For proton energies above 5 MeV, Mackenzie' reports a structure in e~ versus Z~, especially in the transition elements from Ca to Ni. Ormrod and Duckworth' noticed that there was a periodic variation of e;,„with the atomic number Z~ of the projectile. Fastrup and co-workers obtained a similar periodic variation of e;,„with the atomic number of the projectiles 6&Zj&20 in C films from 0.1 to 1.0 MeV and from 21&Z~&39 in C films~ from 0.2 to 1.5 MeV, and they also observed that the relative amplitude of the oscillations tended to decrease with increasing particle velocity, which they attributed as possibly due to shell effects averaging out as a result of more close collisions when the electron clouds penetrate each other more deeply. A calculation of the minimum distance of '3
H. H. Andersen, C. C. Hanke, H. Simonsen, H. Sgrensen, and
P. Vajda, Phys. Rev. 175, 389 (1968); H. H. Andersen H. Sgrensen, and P. Vadja, ibid. 180, 373 (1969}. 24K. R. Mackenzie, in Penetration of Charged Particles in
Matter, edited by Edwin A. Uehling (National Sciences National Research Council, Washington,
—
Academy
of
D. C., 1960).
K. K.
CHU
AND
approach in a Coulomb collision, however, reveals that even at very low ion velocities, the electron clouds are already deeply penetrating each other. Ericksson et al. obtained the electronic stopping powers at a constant velocity of 1.SX10s cm/sec for 13 diferent ions in an oriented W single crystal by their range measurements. A periodic differentiating dependence of electronic stopping cross section upon Zq was observed. Eisen' obtained electronic stopping powers for 5& Z~(19 in single Si crystals at V= 1.5&(10 cm/sec and also observed an oscillating dependence of ~;,„with Zg. In the low-velocity region (the region where the of Ormrod, Fastrup, Eriksson, Risen, measurements and co-workers are applicable, and the region of lower velocities than those of the present experiment) Firsov's theory' suggests that the energy transfer during the collision between the incoming ion and the stopping atom depends on the square d' of the potential between the two interacting atoms. p(r) is obtained by the addition of the individual atomic potentials at one-half the separation distance r between the two atoms. The larger the gP, the larger is the energy transfer, and, consequently, the larger the stopping effect. By introducing the effective charge due to shell effects into the Firsov theory, EI-Hoshy and Gibbons" have produced an oscillatory structure of p(r) to give an explanation of the periodic oscillation of the electronic stopping cross section versus Z~ in the low-velocity region. Their calculation agrees well with the W channeling experiment of Kriksson and co-workers. ' Kl-Hoshy and Gibbons" in their Fig. 10 give various types of binary interaction (Thomas-Fermi, Firsov, Hartree-Fock-Slater, and modified Firsov) between an atom of atomic number Z~ and a Si atom at a separation r=3 a.u. They indicate that the Hartree-FockSlater potential is higher in value than the ThomasFermi potential and the Firsov potential, and also that the Hartree-Fock-Slater potential displays a structure missing from the other potentials. They state that the actual physical potential should be similar to the Hartree-Fock-Slater potential in structure but higher in magnitude because of a partial depletion of the electrons in the space between the two atoms. They obtain the modiCied Firsov potential by using the effective charge of the atoms and by varying the interaction radius between the interacting atoms. Unfortunately, the theory of Firsov as modified by El-Hoshy and Gibbons, '3 by Winterbon, '2 or by Cheshire et al. , or the I.indhard theory as modified by to predict the oscillatory deBhalla and Bradford, pendence upon Z~ cannot be applied to the present experiment (where the effect of e upon Zs was studied) because the present measurements are made in a higher velocity region, where the theory does not apply. Also, the present measurements are below, or just into, the even higher velocity region where the Bethe-Bloch formalism applies (as, for example, in the region of
"
"
D. PQWERS
187
Andersen's
The dependence of the measurements). Bethe-Bloch formula upon the interacting potential between the incoming ion and the stopping electron (Zie'/r) leads to a dE//dx proportional to ZtsZs. The Z~' arises from the square of a momentum impulse'5 Zi- J'(Zis'/r)Ckg transferred to the stationary electron, i.e., the square of the integral of the Coulomb potential. The Z2 arises from the fact that there are Z2 electrons per stopping atom. From the above considerations the dependence in the low-velocity region of dE//dx on the potential P in Firsov's theory is through an integral of qP, and the dependence of dE//dx in the high-velocity region on the Coulomb potential Zie'/r is through the square of an integral of Zie'/r. It is then not unreasonable to assume for qualitative discussion that in the intermediatevelocity region the interaction potential enters into the stopping-cross-section calculation in a way similar to that in the other velocity regions. That is to say, the dependence of dE/dx on Zi or Zs is similar to the dependence of the interaction potential on Z~ or Z~ through some power or function of this potential. Changes of the potential with Z~ or Z2 wi11 then show up as changes of dE/dx with Zi or Zs. To connect the structure of the Hartree-Pock-Slater potential to the present experimentaI measurements, we refer to Bohm's statement26 that the energy transfer during a collision will be a maximum at some projectile velocity of the order of the velocities of electrons in the target atoms. In the present experiment the energy E =0.4—2.0 MeV corresponds to an n-particle velocity V =4.4X10' to 9.8X10s cm/sec. The velocity of the electrons in the target atom can be determined from the x-ray energy spectrum for a given atom. For Z= 22— 30, the velocities of the orbital electrons of different shells are V~= 40X10' 60X10' cm/sec, Uz, =12X10'-20X10'crn/sec, and Vsr&SX10' cm/sec. The velocity Vis of the outermost shell is uncertain from x-ray data, but ionization-potential data indicate that VsI = 1./ X 10s cm/sec. If the charge density of the atom is plotted as a function of the radius of the atom, several peaks may be seen in the resulting plot. We have taken the radius of the subshell corresponding to the peak of maximu~ height as an estimate of the radius of each shell. The peak of maximum height is obtained from the HartreeFock-Slater radial-wave-function tabulation of Herman and Skillman. For Z= 22— 30 the radius of each shell is r~=0.03 0.045 a.u. rg=0. 15 0.3 a.u. r~=0.5 1.0 a.u. , and r~=2 3 a.u. We would expect the energy transfer of the n particles of 0.4-2.0 Mev to have a greater significance in the
"
'~ W. %haling, in ENclear Spectroscopy, edited by F. AjzenbergSelove (Academic Press Inc. , New York, 1960), Part A, p. 3. Bohm, Qaanilra Theory (Prentice-Hall, Inc. , Englewood Cli6s, N. J., 1951), p. 506. '7F. Herman and S. Skillman, Atom& Structure Cclczda&ons (Prentice-Hall, Inc. , Englewood Cliffs, N. J., 1963).
"D.
ALPHA —PARTICLE STOP P I NG CROSS SECTION
1111&11I'71 l70— 160-
IN 1
I
I
I
SOL
I~
I
I
DS
&
I
I
I
I
I
I
I
I
I
I
I
I
I
t
I
I
l4-
I50 —, .
140—
l5'0-
c),
I
I
20
8
I
I
I
I
I
I
I
I
I
I
I
26
24
22
9
I
I
I
I
I
30
28
NUMBER
ATOMIC I
I
I
'I
I
I
I
I
24
I
I
I
I
7065-
I
I
I
I
20
l8
I
I
22
I
I
24
ATOMIC
LLI
t'=
04 20— Lsj
t
20
I8
22
ATOMIC
I
I
I
I
I
50
28
NUM BE R
I
I
I
I
I
i
I
I
I
I
I
I
I
I
I
I
I
I
I
I
I
I
I
26 NUM
I
I
32
28 SO 8ER Z
I
I
I
I
I
I
I
I
I
I
I
I
I
I
I
I
I
I
I
I
I
I
I
I
I
I
I
I
I
I
I
I
I
tLJ
52
3.0-
Z
C9 I
I
I
52
Z
0. 6 a. u.
26
24
30
28
26
NUMBER
7.5-
I
t
LLI
I
8.0-
Z I
22—
I-
I
22
8.5-
1
$2
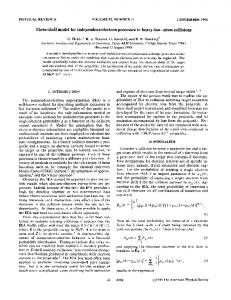
24— FIG. 8. The negative atomic potentia1 energy p(r) (in Ry) versus Z as determined by a Hartree-Fock-Slater calculation (Ref. 27) at various radii (in a.u. ). The solid line is used to connect the points to emphasize the structure.
I
ATOAAIC
I I
I
20
18
120'' IIO —
I
C9 UJ
2.5-
l8—
I
20
18
'
I
22
17—
I
I
&
I
I
I
26
24
ATOMIC I
I
t
I
28
NUMBER
I
I
I
I
I
I
I
I
50
I
I
32
Z
I
t
I
t
I
I
I
I
I
I
I
I
I.8—
l6— l.4— I
I8
I
I
20
I
I
t
22, 24 ATOMIC
M shell for the Z~= 22 —30 region based on a comparison of the incoming n-particle velocity to the velocity of the orbital electrons of the target atoms. This is not to say that the other electrons of the stopping atom have no effect on the stopping process. The binding energy of the electrons plays a part in the stopping process; the outermost electrons are stripped off more easily than the innermost electrons, but the energy transfer is greater to those electrons whose velocity is of the same magnitude of the ion velocity. In Fig. 8 the Hartree-Fock-Slater potentials from Herman and Skillman's tabulation'7 at different radii are plotted as a function of Z. The interacting potential between the n particles and the stopping atoms will have the same Z2 dependence as in Fig. 8, except that the potential will be offset by the potential due to the o, particle. The shape of the Hartree-Fock-Slater potential at r=1.5 a.u. is different from that of Kl-Hoshy and Gibbons (Figs. 5 and 10 of Ref. 11) which we suspect to be due to a plotting mistake in the region of
Z= 26-28.
Comparison can be made between Figs. 4—7 and Fig. 8 as follows: For e at E = 2 MeV, V corresponds to P at r = 0.6 a.u. ; for e at E = 0.8 MeV, V corresponds to P atr=0. 75 a.u. ; and for e at E =1.2 and 1.6 MeV, V„corresponds to p at r=0.67 a.u. The energy E and the stopping electron orbital radius r are related by a
velocity comparison between the projectile and the orbital electrons of the target element. One can see
I
I
I
26
I
I
I
I
50
28
NUMBER
Z
I
1
52
1
:I
I8
I
20
22
24
ATOMIC
26
28
NUMBER
50
32
Z
a similarity in structure between e (E ) versus Z& and g(r) versus Z. That is to say, from Z= 22 to Z= 29 there is a decreasing interaction potential with increasing Z, and our measurements indicate a decreasing ~ with Z~ in the same Z2 region. It is also seen in our Figs. 4—7 that there are always two dips, one at Mn (Z= 25) and the other at Cu (Z= 29). At Z= 24 the Cr measurement is also low, so that it could be a dip within the experimental accuracy. The two dips at Z=24 and 29, as predicted by g(r) in Fig. 8, can be explained, since at Z= 24 and 29 there is only one electron in the 4s shell compared to two 4s electrons for the other elements in the region Z=22 —30. The present experiment gives a peak at Fe (Z= 26), but no peak at Fe is predicted by the Hartree-Fock-Slater two-atom potential. The comparison between e (E„) versus Zs and g(r) versus Z by relating E to r using Bohm's statement gives a qualitative explanation of the cause of the structure in t. versus Z2 and also gives the energy dependence of the amplitude of the structure which decreases with increasing ion energy corresponding to a smaller radius of
interaction. At present a quantitative explanation of our measurements is beyond our reach because of two complications: (1) The real atom does not have a well-defined orbital radius for its shell electrons, and (2) the forInalism for the energy loss in the intermediate-velocity region is not developed to show precisely how p(r) enters into the calculation of t. .
K. CHU AND D. POWERS In Fig. 8, P(r) at. r=2.0, 1.5, and 0.2 a.u. is also plotted. Large r corresponds to maximum interaction with a slow projectile, and the structure of P(r) on Z is more pronounced. Small r corresponds to fast projectiles, and g(r) becomes a monotonic function of Z. At r= 0.2 a. u. (about the radius of the L shell for Z=20 —30), the orbital electrons have velocity about 10—20&(10' cm/sec, which corresponds to E„=2 MeV, the lower limit of Andersen's measurements of e~ (E~=2.25 —12 MeV). No structure is seen in either e„versus Z2 or in g(r) versus Z. This result is not inconsistent with the qualitative discussion given herein. Of course, it should be understood that, in this high-velocity region, the interaction occurs not through a Hartree-Fock-Slater picture of the stopping atom, but rather through the Coulomb force between the incident ion of charge Z~e and one of the Z2 electrons of the stopping atom. The BetheBloch formula based on this Coulomb interaction leads to a linear relation between e and Z~. To conclude the present discussion, we list the following:
(1) The present experiment confirms that there is a structure in e versus Z2, and that the amplitude of this structure is energy-dependent. (2) A structure in e„versus Z2 in the intermediate region is observed (see Bader et al. 2O and Green et al. 20; see also Fig. 4, where e„ is plotted versus Z2, the structure in e„ is actually more pronounced at lower proton velocities, although these e„'s are not directly plotted in Figs. 5—7). (3) A Hartree-Fock-Slater potential can be used to explain the structure of e versus Z and the energy dependence of the amplitude of the structure. At the present time, for convenience in interpolating the stopping cross section for n particles, e, to stopping elements not yet measured, an empirical formula based on the present measurements only is given:
e, =e (E,Z2)= (A'/E) ln(B' E) for 0.8&E&2.0 MeV,
4&Z2&50, where
E is in MeV,
and
e
is in 10
"eV cm'.
The parameter A' and
B'= 5.63-Z, with
8' are
"',
functions of Z~. 4'=--
A. '+ 4,„',
A, ' = —0.0132Z2'+ 2.04Z2+ 3.40, A „'= — 4.0(Zg —26) exp) —(Z2 —26)'/14j.
A, ' is a monotonic function of Z~ and A„' represents a wiggle centered at Z2 —26 with its width an adjusted parameter equal to 14 and its amplitude an adjusted parameter equal to 4.0. This empirical formula is plotted as the dashed curve in Figs. 4—7. In using the above formula the following must be borne in mind: (1) If a target element is measured in the present experiment, Table III is recommended for the e evaluation with an accuracy within the experimental error. (2) All the present measurements are within &15% of the curve, 80% of the present measurements are within &10% of the curve (see Figs. 4—7), and all e measurements by other groups are within 15% of the curve. (3) Knowing that Orrnrod et al. and Fastrup et al. obtain a periodic oscillation of e;,„versus Z~ for Z~& 20 with low-velocity ions, and noticing that e~ versus Z2 has similar structure around Z~ —7 (see Figs. 4—7), one may suspect that there would be oscillations in e versus Z2 for Z2 not included in the present measurement. (4) On the basis of (2) and (3) a 20% accuracy is assigned to the empirical curve. (5) The empirical curve can be improved and modified later as more e -versus-Z2 information becomes available, and if wiggles are observed in some other Z2 region, the empirical formula should be modified to include more terms similar to A„'.
ACKNOWLEDGMENTS We would like to thank Dr. D. L. Hardcastle for several discussions on the application of the HartreeFock-Slater potential to the present problem; Dr. K. H. Wang for discussions on the experimental technique and his help in testing the detecting system; and Roy Brown for constructing and testing the electronics used in this experiment.