BIOMEDtCAL ENGINEERINGAPPLICATIONS. BASIS & COMMUNICATIONS
350 350
AN ADAPTIVE ALGORITHM FOR CANCELING POWER-LINE INTERFERENCE IN BIOPOTENTIAL MEASUREMENT Y U N - L I Liu 1 , N I N - C H U N C H A N G ' , S H E N G - F E N G H S U 2 , D O N G - L O N G L J N ' , Y U E - D E R LIN 1
'Department of Automatic Control Engineering, Feng Chia University, Taichung z School of Chinese Medicine, China Medical University, Taichung Taiwan
ABSTRACT ABSTRACT Biopotential measurements are very important in clinical diagnosis. However, the signal amplitude of is very small and there usually exists stray capacitance between the of biopotenials is electrode leads (or the human body) and the power lines, biopotential measurements are easily contaminated by 60-Hz (or 50-Hz) power-line interference. Analog or digital notch filter filter has been the most popular technique usedfor for power-line interference removal. However, the notch filter performs well only when the power frequency is kept exactly at the stop band of the notch filter. filter. The adaptive filtering technique provides another promising approach. approach, yet there needs another reference channel for for interference recording. The price of of signal measurement is thus increased. The authors present a for canceling the power-line interference in a simple LMS-style algorithm for in biopotential measurement. No reference channel is needed for for adaptive filtration in this proposed algorithm. Compared with another technique serving for the same purpose, the proposed algorithm can remove practical power-line interference more effectively, and can be a a post-acquisition processing remedyfor for biosignals having corrupted by power-line interference. Biomed Eng Appl Basis Comm, Coram, 2004(December); 16: 350-354. Keywords: power-line interference, adaptive filtering technique, technique. LMS-style algorithm, electrocardiogram (ECG)
I. INTRODUCTION Biopotential measurements are of clinical importance and have become popular check item in medical diagnosis at present time. The amplitudes of Received: May 14, 2004; Accepted: Oct 20, 2004 Correspondence: Yue-Der Lin, Professor Department of Automatic Control Engineering, Feng Chia University, 100, Wenhwa Road, Seatwen, Taichung 407 Taiwan E-mail:
[email protected]
-57
original biopotentials are very tiny (in mV or even in ft V range) and there are many events that may cause interference during biopotential recordings. The main e v e n t s include the lead sway of the electrodes £ 1-2j. t n e human body moving close to the patient or patient movement [3], the artifact from other biopotential sources located within the body itself [4], and the electromagnetic source from other likewise electric devices or equivalent [4-5], and so forth. Among these events, the interference from nearby electromagnetic source is usually unavoidable. There are many ways in which an electromagnetic source can cause interference in biopotential recordings. The items are
Vol. 16 No. 6 December 2004
351 listed as follows. (i) The magnetic field from power lines can cause an induced voltage in the loop formed by the electrode leads. (ii) The electric field from power lines can induce a displacement current into the electrode leads which flows through the patient and thus creates an interfering voltage drop across the electrode impedance. (iii) The electric field from power lines can induce a displacement current into the patient and this current may cause an interference voltage between the recording electrodes as it flows through the tissue impedance. (iv) The displacement current induced into the patient also creates a voltage between the patient and the reference ground. (v) Electromagnetic interference (EMI) from nearby highpower radio, television, or radar facilities can be picked up and rectified by the PN junctions of the transistors in biopotential amplifier and sometimes even by the electrode-electrolyte interface on the patient. The lead wires and the patient serve as an antenna. Once the signal is detected, the demodulated signal appears as interference [4]. The EMI can be avoided by taking the electromagnetic sources far away from the measurement equipment. From the above description, items (i) to (iv) are all caused from power lines and such interference is usually unavoidable. If the power-line interference is not removed thoroughly, the infected pattern may lead to erroneous diagnosis. Analog or digital notch filter was the most popular technique used for power-line interference removal [1], [5-10]. As the power frequency is not always fixed at 60 (or 50) Hz, a fixed notch filter can eliminate the interference only when the frequency distribution is exactly centered at the notch frequency for which the filter was designed. An attractive approach to overcome this drawback is the application of adaptive filter. But a reference signal for modeling the interference is usually needed [11-12], and the cost for biopotential measurement is thus increased. So [13] has proposed a least-mean-square (LMS) adaptive algorithm by the iteratively updating the amplitude and phase of power-line interference. In So's algorithm, no reference signal is needed. But the interference frequency should be kept fixed in this algorithm. Lin et al. [14] have modified So's algorithm such that the interference frequency can also be estimated and tracked by chirp Z-transform (CZT). However, the equally spaced frequency resolution of this algorithm limits its filtration performance for the biopotential recording corrupted by practical power-line interference. In this study, the authors present a simple LMS-style algorithm to serve the same purpose. Firstly, the estimated power-line interference is reconstructed from spectrum analysis via fast Fourier transform (FFT), and then the contaminated power-line interference is removed by LMS-style adaptive filter.
Because of the distinct QRS complex feature, ECG is used as the test signal in this study. Comparison between the proposed algorithm and that proposed by Lin et al. [14] is carried out to verify its feasibility. From the test results, the proposed algorithm can remove practical power-line interference more effectively.
2. ALGORITHM Define s[k] = the estimated original signal at time index k, n[k] = the estimated power-line interference at time index k, x[k] = the measured signal at time index k, S[•] =FFT{s[•]}, where FFT denotes fast Fourier transform (FFT), N[•] =FFT{ n[•]}, X[•] =FFT{ x[•]}, a [ ] = the amplitude of power-line interference, 0 [ ] = the phase of power-line interference, f[•] = the power-line frequency, u = the step size parameter of the proposed LMSstyle algorithm, u a= the step-size parameter for the update of a [ ], u o= the step-size parameter for the update of 0 [•] , fs = the sampling frequency, M = the order of the adaptive filter, L= the minimal data length for power-line frequency estimation, W[•] = the M X 1 tap-weight vector. The signals defined above are all arranged in column-vector form.
2.1 The Algorithm Proposed by Lin et al. [14] Assuming (1) n[k] = a [k] • sin(2 n •f[k]•k(fs +0 [k]), and (2) s[k] = x[k] - n[k]. The computation process is as follows: (i) Initialize the value of a [•], 0 [] and f[•]. (ii) Update a [], 0 [•] and f[•] according to the following equation iteratively. a [k+l] = a [k] +u a•s[k]•sin(2 7r •f[k]•k/fs+0 [k]), (3) ' [k+l] _c5 [k] +um•s[k]•cos(2 7r •f[k]•k/fs+q5 [k]), (4) and
-58-
f;,,;t, for k < L, f(k+1)=
the main frequency (5) estimated
by CZT for k s L,
BIOMEDICAL ENGINEERINGAPPLICATIONS, BASIS & COMMUNICATIONS
352
iterations. The parameters are the same as those in Figure 1. Figure 3 shows the filtration results for type II test pattern. The parameters are fp = 49.75 (Hz), n a = 0.05 and v- *= 0.02 for Figure 3(b), and^=0.1, M = 4 and L = 2048 for Figure 3(c). Because the exact pattern of the sinusoidal-like power-line interference cannot be derived, filtration performance is estimated indirectly by spectrum analysis. The results are shown in Figure 4.
fork= 1,2,3 From equations (1) and (2), n[k+l] and s[k+l] can be derived accordingly. The above iterative equations are computed until no residual data.
2.2 The Proposed Algorithm The steps of the proposed algorithm are as follows: (i) Choose proper value for u , M, L and the frequency range of power-line interference. (ii) Initialise the M X 1 tap-weight vector W[-] to be a zero vector, and N[] to be a L X 1 zero vector. (iii)For l
. il.A.. -li.A.... JJLA ILA—JLA—... 1 ^ W ^ I H ^ W H R I I F ^^^nw *^^ntr I ^ ^ » T
W i^WHtr
1.5 1 0.5 0^
^r
-A-_Jpv^J[yv_J|u^—-
^^^WTI 1^
y\ JpwJ^
>
3. RESULTS
E
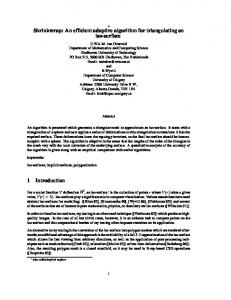
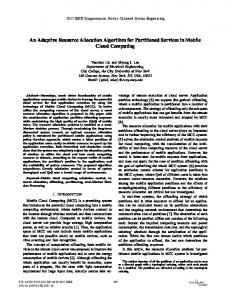
Two types of test pattern were used for performance verification. Type I is the ECG selected from M1T/BIH arrhythmia database with added 60-Hz sinusoid (sampling frequency is 360 Hz), and type II is the practical ECG corrupted by 50-Hz power-line interference (sampling frequency is 128 Hz). Figure 1 shows the filtration results of the two algorithms after numerical convergence for type I test pattern (MIT116 with added 60-Hz sinusoid). The signal-to-noise ratio (SNR) of this test pattern is 30 dB. The parameters are fp = 60 (Hz),j"*= 0.008 and u= 0.002 for Figure 1(c), and ju=0.5, M = 4 and L = 2048 for Figure 1(d). Figure 2 illustrates the learning curves of both algorithms, where the mean-squared error (MSE) between the added sinusoid and the corresponding estimated sinusoid is plotted versus the number of
..,,/\
.A
A
A
A/\
J /\
. IA
\\j
Fig 1. Filtration results for a 30dB-SNR ECG test pattern (type I test pattern). (a) Type I test pattern (MIT116 with added 60-Hz sinusoid), (b) the original ECG pattern (MIT116), (c) the ECG signal estimated by the algorithm proposed by Lin et al., (d) the ECG signal estimated by the proposed algorithm.
-59-
Vol. 16 No. 6 December 2004
353 0.025 0.02 8 0.015 0.01
0
0.005I 0 IL^, 0 0.5 1 1 . 5 2
2.5
3
3.5 x10⁴
0.2
0.025
a
0
0.02 F
0
I 10
20
30
40
50
60
88 0.015 0.4 0.01 0 0.2
0.005 0
0
0.5 1 1.5 2 2.5 3 3.5 Number of iterations x 104
10
20
30 40 Frequency, Hz
50
60
Fig 4. The magnitude spectrum for (a) type II test pattern, (b) the ECG signal estimated by the algorithm proposed by Lin et al. (for type II pattern), (c) the ECG signal estimated by the proposed algorithm (for type II pattern).
Fig 2. The learning curve for (a) the algorithm proposed by Lin et al., (b) the proposed algorithm.
E 0.5
cable shielding and routing, etc. The proposed algorithm can be used as a remedy by post-acquisition processing the biosignals contaminated with powerline interference.
0
0
2
3
4
2
3
4
5
6
7
8
6
7
8
1 E 0.5 a 0
ACKNOWLEDGEMENT
0
2
3
4 Second
5
5
6
7
The authors acknowledge gratefully the financial support from the National Science Council of Taiwan (contract number NSC 89-2213-E-039-002), and China Medical University Hospital (contract number DMR90-128).
8
Fig 3. Filtration results for the ECG signal corrupted by 50-Hz power-line interference (type II test pattern). (a) Type II test pattern, (b) the ECG signal estimated by the algorithm proposed by Lin et al., (c) the ECG signal estimated by the proposed algorithm.
Besides, there is a trade-off between execution speed and frequency resolution for the choice of parameter L (the data length of FFT). Of course, the most effective methods for reducing power-line interference are ensuring that the source signal is of high quality by using low impedance contacts with the patient, good
REFERENCE 1. Metting van Rijn AC, Peper A and Grimbergen CA, "High-quality recording of bioelectric events: Part 1. Interference reduction, theory and practice", Med. Biol. Eng. Comput., 1990; 28: 389-397. 2. Metting van Rijn AC, Peper A and Grimbergen CA, "High-quality recording of bioelectric events: Part 1. Interference reduction, theory and practice", IEEE Trans. Biomed. Eng., 1991; 29: 433-440. 3. Gordan DH, "Triboelectric interference in the ECG", IEEE Trans. Biomed. Eng., 1975; 22: 252-255. 4. Neuman MR, "Biopotential amplifier", in Medical Instrumentation - Application and Design, Second
-60-
BIOMEDICAL ENGINEERINGAPPUCATIONS, BASIS & COMMUNICATIONS
354 354
Edition, J. G. Webster Ed., Houghton Mifflin, 1992: 227-287. 5. Huhta JC and Webster JG, "60-Hz interference in electrocardiography", IEEE Trans. Biomed. Eng., 1973; 27: 91-101. 6. Winter BB and Webster JG, "Reduction of interference due to common mode voltage in biopotential amplifiers", IEEE Trans. Biomed. Eng., 1983; 30: 58-62. 7. Winter BB and Webster JG, "Driven-right-leg circuit design", IEEE Trans. Biomed. Eng., 1983; 30: 6266. 8. Cramer DH, Mcmanus CD and Neubert D, "Estimation and removal of power line interference in the electrocardiogram: A comparison of digital approach", Comput. Biomed. Res., 1987; 20: 12-28. 9. Christov II, and Dotsinsky IA, "New approach to the digital elimination of 50 Hz interference from the electrocardiogram", Med. Biol. Eng. Comput., 1988; 26:431-434.
-61-
10. Pei SC and Tseng CC, "Elimination of AC interference notch interference in in electrocardiogram electrocardiogram using using IIR HK. notcn filter with transient suppression", IEEE Trans. filter with transient suppression", IEEE Trans. Biomed. Eng., Eng., 1995; 1995; 42: 42: 1128-1132. 1128-1132. Biomed. 11. Ferdjallah Ferdjallah M M and and Barr Barr RE, RE, "Adaptive "Adaptive digital digital notch notch 11. filter design on the unit circle for the removal of filter desien on the unit circle for the removal of power line noise from biomedical signals", IEEE Trans. Biomed. Eng., 1994; 41: 529-536. 12. Hamilton PS, "A comparison of adaptive and nonadaptive filters for reduction of power line interference in the ECG", IEEE Trans. Biomed. Eng., 1996; 43: 105-109. 13. So HC, "Adaptive algorithm for sinusoidal interference cancellation", Electron. Lett., 1997; 33: 1910-1912. 14. Lin Y D, Chong FC Chen FJ, Kao ST, Chen BC and Lin JG, "An adaptive power-line interference removal technique for biopotential measurement", Biomed. Eng., - Appl., Basis & Commun., 2000; 12:24-32.