There is a fixed cost for each vehicle dispatch but there is a different holding cost for each ... considered the single link dispatching problem as a batch service queue .... We go further and let Ft be the information sub-field at time t, representing.
An Adaptive Dynamic Programming Algorithm for a Stochastic Multiproduct Batch Dispatch Problem Katerina P. Papadaki London School of Economics Warren B. Powell Department of Operations Research and Financial Engineering, Princeton University, Princeton, NJ 08544 Revised, February, 2003
Abstract We address the problem of dispatching a vehicle with different product classes. There is a common dispatch cost, but holding costs that vary by product class. The problem exhibits multidimensional state, outcome and action spaces, and as a result is computationally intractable using either discrete dynamic programming methods, or even as a deterministic integer program. We prove a key structural property for the decision function, and exploit this property in the development of continuous value function approximations that form the basis of an approximate dispatch rule. Comparisons on single product-class problems, where optimal solutions are available, demonstrate solutions that are within a few percent of optimal. The algorithm is then applied to a problem with 100 product classes, and comparisons against a carefully tuned myopic heuristic demonstrate significant improvements.
The multiproduct batch dispatch problem consists of different types of products arriving at a dispatch station in discrete time intervals over a finite horizon waiting to be dispatched by a finite capacity vehicle. The basic decision is whether or not a batch of products should be dispatched and, in the case that the vehicle is dispatched, determining how many products to dispatch from each type. We assume that the arrival process is nonstationary and stochastic. There is a fixed cost for each vehicle dispatch but there is a different holding cost for each product type, reflecting differences in the values of product types. The single-product batch dispatch problem can be solved optimally using classical discrete dynamic programming techniques. However, these methods cannot be used in the multiproduct case since the state, outcome and action spaces all become multidimensional. In this paper we use adaptive sampling techniques to produce continuous value function approximations. We prove that the optimal solution has a particular structure, and we exploit this structure in our algorithm. These strategies are then used to produce approximate decision functions (policies) which are scalable to problems with a very large number of product classes. The single link dispatching problem was originally proposed by Kosten (1967) (see Medhi (1984), Kosten (1973)), who considered the case of a custodian dispatching trucks whenever the number of customers waiting to be served exceeds a threshold. Deb & Serfozo (1973) show that the optimal decision rule is monotone and has a control limit structure. Papadaki & Powell (2002) considered the single link dispatching problem as a batch service queue with homogeneous customers. They proved monotonicity of the optimal service rules in a finite horizon setting. Weiss & Pliska (1976) considered the case where the waiting cost per customer is a function h(w) if a customer has been waiting time w. They show that the optimal service policy is to send the vehicle if the server is available and the marginal waiting cost is at least as large as the optimal long run average cost. This is termed a derivative policy, in contrast to the control limit policy proved by Deb and Serfozo. We use both of these results in this paper. This basic model is generalized in Deb (1978a) to include switching costs, and has been applied to the study of a two-terminal shuttle system where one or two vehicles cycle between a pair of terminals Ignall & Kolesar (1972); Barnett (1973); Ignall & Kolesar (1974); Deb (1978b); Weiss (1981); Deb & Schmidt (1987). Once the structure of an optimal policy is known, the primary problem is one of determining the expected costs for a given control strategy, and then using this function to find the optimal control strategy. Since the original paper by Bailey (1954), there has developed an extensive literature on statistics for steady state bulk queues. Several authors have suggested different types of control strategies, motivated by different cost functions than those 1
considered above. Neuts (1967) introduced a lower limit to the batch size and termed the result a general bulk service rule. Powell (1985) was the first to introduce general holding and cancellation strategies, where a vehicle departure might be cancelled for a fixed period of time if a dispatch rule has not been satisfied within a period of time (reflecting, for example, the inability to keep a driver sitting and waiting). Powell & Humblet (1986) present a general, unified framework for the analysis of a broad class of (Markovian) dispatch policies, assuming stationary, stochastic demands. Excellent reviews of this literature are contained in Chaudhry & Templeton (1983) and Medhi (1984). The multiproduct problem has received relatively little attention, probably as a result of its complexity. Closest to our work is Speranza & Ukovich (1994) and Speranza & Ukovich (1996) who consider the deterministic multiproduct problem which involves finding the frequencies for shipping product to minimize transportation and inventory costs. Bertazzi & Speranza (1999b) and Bertazzi & Speranza (1999a) consider the shipments of products from an origin to a destination through one or several intermediate nodes. They provide several classes of heuristics including decomposition of the sequence of links, an EOQ-type solution and a dynamic programming-based heuristic. However, both models assume supply and demand rates are constant over time and deterministic. Bertazzi et al. (2000) use neurodynamic programming for a stochastic version of an infinite horizon multiproduct inventory planning problem, but the method appears to be limited to a fairly small number of products as a result of state-space problems. There are a number of other efforts to study multiproduct problems in different settings. Bassok et al. (1999) propose a single-period, multiproduct inventory problem with substitution. Anupindi & Tayur (1998) study a special class of stochastic, multiproduct inventory problems that arise in the flow of products on a shop floor. There is an extensive literature on multicommodity flows, but this work does not consider the batching of different product classes with a common setup or dispatch cost. The methodology we use in this paper is based on adaptive dynamic programming algorithms. Similar types of algorithms are used and discussed by Bertsekas & Tsitsiklis (1996) in the context of neuro-dynamic programming and by Sutton & Barto (1998) in the context of reinforcement learning. Also, Tsitsiklis & Van Roy (1997) investigate the properties of functional approximations in the context of discrete dynamic programs. Further, Papadaki & Powell (2002) use adaptive dynamic programming algorithms to approximate optimal value functions. They illustrate that the use of structural properties of the value functions in adaptive dynamic programming is an improvement. However, they use a discrete representation of the value function which makes the algorithms non-scalable to multidimensional 2
problems. In this paper, we propose a new adaptive dynamic programming algorithm for approximating optimal dispatch policies for stochastic dynamic problems. Our technique is based on developing functional approximations of the value functions which produce near optimal solutions. This is similar to the general presentation of Tsitsiklis & Van Roy (1997) on functional approximations for dynamic programming (see also Bertsekas & Tsitsiklis (1996)) but we set up our optimality equations using the concept of an incomplete state variable, which simplifies the algorithm. We consider both linear and nonlinear functional approximations, and our nonlinear approximation does not fall in the class of approximations considered by Tsitsiklis & Van Roy (1997). We demonstrate our methods on both single product problems, where we can compare against an optimal solution, and a large multiproduct problem with 100 product classes, where we compare against a carefully tuned myopic heuristic. The contributions of this paper are as follows: 1) We propose and prove the optimality of a dispatch rule that specifies that if we dispatch the vehicle, then we should assign customers in order of their holding cost. 2) We prove monotonicity of the value function for the multiproduct case. 3) We introduce a scalable approximation strategy that can handle problems with a large number of products. 4) We propose and test linear and nonlinear approximation strategies for the single product case, and show that they produce solutions that are within a few percent of optimal, significantly outperforming a carefully tuned myopic rule. 5) We demonstrate the algorithm on a multiproduct problem with 100 product classes, and show that it also significantly outperforms a myopic decision rule. We begin by defining the basic model for the multiproduct batch dispatch problem in section 1. Section 2 provides theoretical results on the multiproduct problem including structural properties of the value functions and a proof on the nature of of optimal dispatch strategies. At this point we switch to the single-product batch dispatch problem and we introduce and describe our techniques and experiments in this scalar setting. We revisit the multiproduct problem again in section 6. In section 3 we propose an approximation technique using a forward dynamic programming algorithm. In section 4 we use the technique of section 3 with a linear and a nonlinear approximation. Experiments suggest that both approximation techniques are very effective. The experiments and results are described in section 5. Finally, section 6 shows how the algorithm can be easily scaled to the multiproduct problem and provides experimental results for the multidimensional problem.
3
1
Problem definition
We formally introduce the multiproduct transportation problem and we develop the basic model. The model is revisited and modified in section 2.1 according to the results that we derive about the nature of the optimal policies. In this section we state the assumptions, define the parameters and the functions associated with the model. We consider the problem of multiple types of products manufactured at the supplier’s side and waiting to be dispatched in batches to the retailer by a finite capacity vehicle. We group the products in product classes according to their type and we assume that there is a finite number of classes. The products across classes are homogeneous in volume and thus indistinguishable when filling up the vehicle. The differences between product types could arise from special storage requirements of the products or from priorities of the product types according to demand. In both of the above cases the holding cost of products differs across product classes either because the cost of inventory is different or because the opportunity cost of shipping different types of products is different. Problem applications where products have homogeneous volume but heterogeneous holding cost are as follows: A manufacturer produces a single organic/food product where each unit has an expiry date. In an intermediate step of the supply chain, units of different expiry dates are waiting to be dispatched to the next destination. Another example is a manufacturer that produces a single product for delivery to customers where each customer has several shipping options. In this case, each unit has a different deadline for delivery to the customer and this incurs heterogeneous holding costs. We order the classes according to their holding cost starting from the most expensive type to the least expensive type. In this manner we construct a monotone holding cost structure. The product dispatches can occur at discrete points in time called decision epochs and we evaluate the model for finitely many decision epochs (finite time horizon). There is a fixed cost associated with each vehicle dispatch. Arrivals of products occur at each time epoch and we assume that the arrival process is a stochastic process with a general distribution. Apart from arrivals and variables that depend on arrivals, all other variables, functions and parameters are assumed to be deterministic. The objective is to determine optimal dispatch policies over the finite time horizon to minimize expected total costs. Parameters 4
m = Number of product classes. c = Cost to dispatch a vehicle. hi = Holding cost of class i per time period per unit product. h = (h1 , h2 , ..., hm ) K = Service capacity of the vehicle, maximum number of products that can be served in a batch. T = Planning horizon for the model. α = A discount factor. We assume deterministic and stationary cost parameters of dispatch and holding of products. The holding cost parameter has a monotone structure: h1 > h2 > ... > hm , where products of class i have higher priority than products of class j when i > j. The state variable and the stochastic process We assume an exogenous stochastic process of arrivals. Let ati be the number of products of class i arriving at the station at decision epoch t. Then at = (at1 , ..., atm ) ∈ A is the vector that describes the arrivals of all product classes at time t and A is the set of all possible arrival vectors. We define the probability space Ω to be the set of all ω such that: ω = (a1 , a2 , a3 , ..., aT ), Then ω is a particular instance of a complete set of arrivals. We can now define a standard probability space (Ω, F, P), where F is the σ-algebra defined over Ω, and P is a probability measure defined over F. We refer to F as the information field. We go further and let Ft be the information sub-field at time t, representing the set of all possible events up to time t. Since we have Ft ⊆ Ft+1 , the process {Ft }Tt=1 is a filtration. We define At : Ω → A such that At (ω) = at , to be the random variable that determines the arrivals at time t. The process {At }Tt=1 is our stochastic arrival process. We define the state variable to be the number of products from each class that are waiting to be dispatched at the station. If we let Si = {0, 1, ..} be the the set of all possible discrete amounts of the product of type i that are waiting to be dispatched, then our state space is S = S1 × ... × Sm . Let sti be the number of products of class i that are waiting at the station 5
to be dispatched at time t. Then the state variable at time t is as follows: st = (st1 , st2 , ..., stm ) ∈ S The state of the system is also stochastic due to the stochastic arrival process and so we can write: St : Ω → S and St (ω) = st . The state of the system at time t, st , is measured at decision epoch t. We assume that arrivals at occur at the station just before the decision epoch t and dispatch occurs just after the decision epoch. Policies and decision rules The decision associated with this process is to determine whether or not to dispatch at a specific time epoch and how many units of products from each class to dispatch in the case that we decide to send the vehicle. All of these decisions can be determined by one variable xt = (xt1 , ..., xtm ), where xti is the number of units of product type i to be dispatched at time t. We let X (s) to be the feasible set of decision variables given that we are in state s: ( X (s) =
x ∈ S : x ≤ s,
m X
) m X xi = 0 OR min( si , K)
i=1
(1)
i=1
Note that in our feasible set of decisions we do not allow decisions that dispatch the vehicle below capacity if there are available units at the station. These types of decisions are obviously not optimal since they only incur an additional holding cost. In section 2.1 we prove results on the nature of the optimal decision policies and thus we revise the set of feasible decisions. We define a policy π to be a set of decision rules over the time horizon: π = (X0π , X1π , ..., XTπ−1 ), where we define the decision rules to be: Xtπ : S → X (st ) Xtπ (st ) = xt where X (st ) is our action space given that we are at state st . The decision rules depend only on the current state st , and the policy π, but they are independent of the history of
6
states. The set of all policies π is denoted Π. We also define the dispatch variables which are functions of the decision variables indicating whether the vehicle is dispatched or not: ( P 1 if m xt,i > 0 Zt (xt ) = Pi=1 m 0 if i=1 xt,i = 0 System dynamics Given that at time t, we were at state st and we chose action xt = Xtπ (st ), and given that the arrivals at time t + 1 are at+1 , then we can derive the state variable at time t + 1. Thus the transfer function is as follows: st+1 = st − xt + at+1
(2)
We are now ready to introduce the transition probabilities: pt (i) = P rob (At = i) pst+1 (st+1 |st , xt ) = P rob (St+1 = st+1 |st , xt ) From the transfer function we have: pst+1 (j|s, x) = pt+1 (j − s + x)
(3)
And we also introduce the probability of being in a state higher than st+1 at time t + 1 given that at time t we are in state st and made decision xt : Pt+1 (st+1 |st , xt ) =
X
pst+1 (j|st , xt )
j≥st+1 ,j∈S
Cost functions We use the following cost functions: gt (st , xt ) = cost incurred in period t, given state st and decision xt = cZt (xt ) + hT (st − xt ) gT (sT ) = terminal cost function 7
(4)
F (S0 ) = minπ∈Π E
nP T −1 t=0
o αt gt (St , Xtπ (St )) + αT gT (ST )
We calculate gt in period t, which is the time between decision epoch t and decision epoch t + 1. The objective function F (S0 ) is the expected total discounted cost minimized over all policies π which consist of decision rules from the feasible set of decision rules described in (1). Finally, we define the value functions to be the functions Vt , for t = 0, 1, ..., T , such that the following recursive set of equations holds: Vt (st ) =
min {gt (st , xt ) + αE[Vt+1 (St+1 )|St = st ]}
(5)
xt ∈X (st )
for t = 0, 1, ..., T − 1. These are the optimality equations which can also be written in the form: ( Vt (st ) = min
xt ∈X (st )
)
gt (st , xt ) + α
X
pst+1 (s0 |st , xt )Vt+1 (s0 )
(6)
s0 ∈S
We can also rewrite these equations by using the arrival probabilities instead of the transition probabilities: X Vt (st ) = min gt (st , xt ) + α pt+1 (at+1 )Vt+1 (st − xt + at+1 ) xt ∈X (st )
(7)
at+1 ∈A
To simplify notation we let for t = 0, ..., T − 1: vt (st , xt ) ≡ gt (st , xt ) + α
X
pt+1 (at+1 )Vt+1 (st − xt + at+1 ).
at+1 ∈A
And thus the optimality equations can be written in the form: Vt (st ) = min {vt (st , xt )} xt ∈X (st )
Our goal is to find the optimal value functions that solve the optimality equations, which is equivalent to finding the value of the objective function F (S0 ) for each deterministic initial state S0 = s0 .
8
2
Theoretical Results
This section presents some theoretical results on the multiproduct batch dispatch problem. In section 2.1 we prove a result on the nature of optimal policies and in the process of the proof we establish, what we call, monotonicity with respect to product classes of the optimal value function. In section 2.2 we revisit the definition of our action space and action variables, and we adjust them according to the results of section 2.1. In section 2.3 we establish nondecreasing monotonicity of the optimal value function.
2.1
Optimal Policies
In this section we establish results on the value function which help us determine the nature of optimal policies for this type of problem. We claim and later prove that if we were to dispatch, the optimal way to fill up the vehicle is to start with the class that has the highest holding cost and move to the class with the lowest holding cost until the vehicle is full or there are no more units at the station. Although this is intuitively obvious, we provide a proof of it in this section. To introduce this formally we define a function of the state variable, χ(st ), that we claim is the optimal decision variable given that we will dispatch the vehicle. This function returns an m-dimensional vector whose components χi (st ) for all i = 1, ..., m are described below: st,i P χi (st ) = K − i−1 k=1 st,k 0
P if ik=1 st,k < K P Pi−1 st,k < K ≤ ik=1 st,k if k=1 otherwise
In the following discussion we let ei be an m-dimensional vector with zero entries apart from its ith entry which has value 1. We proceed with the following definition: Definition 1 Let f be a real valued function defined on S. We say that f is monotone with respect to product classes if for all s ∈ S, i, j ∈ {1, ..., m} such that i < j, and i picked such that si > 0, we have: f (s + ej − ei ) ≤ f (s)
The next two results are proven in the appendix: 9
Lemma 1 If the value function at time t + 1, Vt+1 , is monotone with respect to product classes then the optimal decision variable xt at time t given we are in state st is either 0 or χ(st ). The above lemma is used to prove the following proposition: Proposition 1 The value function, Vt , is monotone with respect to product classes for all t = 0, ..., T By lemma 1 and proposition 1 we directly obtain the following property: ∗
Theorem 1 The optimal decision rules Xtπ (s) for all t = 0, ..., T − 1 are either 0 or χ(s). Proof: Lemma 1 states that if Vt+1 is monotone, then xt is either 0 or χ(st ). Proposition 1 states that in fact, Vt (st ) is monotone in st for all t, establishing the precondition for lemma 1. Thus, theorem 1 follows immediately.
�
This result is significant. It reduces the problem of finding an optimal decision to a vector-valued problem to one of choosing between two scalars: z = 0 and z = 1.
2.2
Changing the action space and action variables
In the previous section we established results on the nature of the optimal decision policies (theorem 1). In this section we revisit our problem definition and redefine our action space according to the optimal policies. The action space X (st ) that we defined in section 1 considers all possible combinations of filling up the vehicle from the different classes. We have just proved that χ(s) is the optimal way to fill up the vehicle given that the state is s. Thus our decision reduces to whether or not we should dispatch. We redefine the action space to be {0, 1}. We let our decision variables to be zt ∈ {0, 1}. The transfer function becomes: st+1 = st − zt χ(st ) + at+1
10
The cost functions and optimality equations become: gt (st , zt ) = czt + hT (st − zt χ(st ))
wt (st , zt ) = czt + hT (st − zt χ(st )) + α
X
pt+1 (at+1 )Vt+1 (st − zt χ(st ) + at+1 )
at+1 ∈A
X T Vt (st ) = min czt + h (st − zt χ(st )) + α pt+1 (at+1 )Vt+1 (st − zt χ(st ) + at+1 ) zt ∈{0,1} at+1 ∈A
The transition probabilities also change accordingly.
2.3
Monotone Value Function
In this section we prove nondecreasing monotonicity of the value function. We first prove that the one period cost function, gt (st , zt ), and the cumulative probability function Pt+1 (st+1 |st , zt ) are nondecreasing in the state variable st . Then we use a lemma from Puterman (1994) to prove monotonicity of the value function. We prove the following properties: Property 1 The value function Vt is nondecreasing for t = 0, ..., T . Property 2 The cost function gt (st , zt ) is nondecreasing in the state variable st , for all zt ∈ {0, 1}. Property 3 Pt+1 (st+1 |st , zt ) is nondecreasing in the state variable st , for all st+1 ∈ S, zt ∈ {0, 1}. Proof of property 2 + For st , s+ t ∈ S such that st ≥ st we want to show that:
gt (st , zt ) ≤ gt (s+ t , zt )
(8)
for all zt ∈ {0, 1}. When zt = 0 then (8) reduces to hT st ≤ hT s+ t which is true since all entries of h are nonnegative. 11
When zt = 1, (8) becomes: + hT (st − χ(st )) ≤ hT (s+ t − χ(st ))
so it would be sufficient to prove: + st − χ(st ) ≤ s+ t − χ(st )
(9)
+ So we compare the vectors st − χ(st ) and s+ t − χ(st ). In the case that they are both zero
then (9) is trivial. In the case that one of them is zero then it has to be st − χ(st ) since st is a smaller state and it would empty out faster after a dispatch than s+ t would. In this case + (9) is satisfied since s+ t − χ(st ) ≥ 0. + Now, consider the case that both vectors st − χ(st ) and s+ t − χ(st ) are non-zero. From
the definition of χ there exists an i such that: + + st,k − χk (st ) = 0 + s+ t,i − χi (st ) > 0 + + st,k − χk (s+ t ) = st,k
for k < i for k > i
and there exists a j such that: st,k − χk (st ) = 0 st,j − χj (st ) > 0 st,k − χk (st ) = st,k
for k < j for k > j
Since only K units are dispatched and the entries of st are smaller than s+ t , the dispatch vector χ(st ) will have the capacity to dispatch from lower holding cost classes than the dispatch vector χ(s+ t ). Thus j must be greater than i. Using this and the above equations we get the desired result.
�
Proof of property 3 Pt+1 (st+1 |st , zt ) is the probability that the state in the next time period will be greater than st+1 , given we are in state st and we take decision zt . For larger states st we have a greater probability that the state variable in the next time period exceeds st+1 . Thus the desired result follows from the nature of our problem.
�
We use the following result from Puterman (1994) (Lemma 4.7.3, page 106) to prove property 1. 12
Lemma 2 Suppose the following: 1. gt (st , zt ) is nondecreasing in st for all zt ∈ {0, 1} and t = 0, ..., T − 1 2. Pt+1 (st+1 |st , zt ) is nondecreasing in st for all st+1 ∈ S, zt ∈ {0, 1}. 3. gT (sT ) is nondecreasing in sT . Then Vt (st ) is nondecreasing in st for t = 0, ..., T . Proof of property 1 This follows from lemma 2 and the assumption that the terminal cost function is zero: gT (s) = 0 for all s ∈ S.
3
�
Solution strategy for the Single-product Problem
Until this point in this paper we considered the multiproduct problem where all the variables are multidimensional. In this section and in the next few sections we switch to the scalar single-product problem and we take advantage of the simplicity of this problem to explain our solution strategy and test our algorithms. We revisit the multiproduct problem again in section 6. In this section we introduce a general algorithm for iterative approximations of the value function, that results in the estimation of a dynamic service rule. Our goal is to find z that solves the optimality equations: Vt (St ) = min {gt (St , zt ) + αE[Vt+1 (St+1 )|St ]} , zt
(10)
for t = 0, .., T − 1. For the simplest batch service problem, this equation is easily solved to optimality. Our interest, however, is to use this basic problem as a building block for much more complex situations, where an exact solution would be intractable. For this reason, we use approximation techniques that are based on finding successive approximations of the value function. In section 3.1 we use the concept of an incomplete state variable that aids us in developing and implementing our approximation methods and in section 3.2 we introduce the basic algorithm. 13
3.1
The Incomplete State Variable
We want to consider an approximation using Monte Carlo sampling. For a sample realization ω = (a1 , ..., aT ) we propose the following approximation: n o V˜t (st ) = min gt (st , zt ) + αVˆt+1 (st+1 ) zt
However, st+1 = (st − zt K)+ + at+1 is a function of at+1 and thus when calculating the suboptimal zt in the above minimization we are using future information from time t + 1. To correct this problem we revisit the problem definition. The information process of the model as defined in section 1 is as follows: {S0 , z0 , A1 , S1 , z1 , A2 , S2 , z2 , ..., AT , St }. We want to measure the state variable at time t before the arrivals At . We call this new state variable the incomplete state variable and we denote it by St− . Thus the information process becomes: {S0− , A0 , z0 , S1− , A1 , z1 , S2− , A2 , z2 , ..., ST−−1 , AT −1 , zT −1 , ST− }, where S0− = S0 − A0 , and ST− = ST − AT . Note that St contains the same amount of information as St− and At together; in fact we have St = St− + At . We substitute this into (10): � − Vt (St− + At ) = min gt (St− + At , zt ) + αE[Vt+1 (St+1 + At+1 )|St− + At ] , zt
(11)
The system dynamics also change to: − = (St− + At − Kzt )+ St+1
(12)
Now we take expectations on both sides of (11) conditioned on St− : � � � � � − − − − − − E Vt (St + At )|St = E min gt (St + At , zt ) + αE[Vt+1 (St+1 + At+1 )|St + At ] |St zt
− Since the conditional expectation of Vt+1 (St+1 + At+1 ) is also inside the minimization over − zt , we calculate the expectation of Vt+1 (St+1 + At+1 ) assuming that we know St− + At and
14
− zt . The information contained in St− + At , zt is the same as the information in St+1 . Thus − we can replace the conditional of the expectation to St+1 :
� � � � � − − − − − − E Vt (St + At )|St = E min gt (St + At , zt ) + αE[Vt+1 (St+1 + At+1 )|St+1 ] |St zt
(13) Now let: − − − Vt− (s− t ) ≡ E[Vt (St + At )|St = st ]
gt− (s, at , zt ) ≡ gt (s + at , zt ) = czt + h(s + at − Kzt )+ Then (13) becomes: Vt− (s− t )
� � � − − − − − − = E min gt (St , At , zt ) + αVt+1 (St+1 ) |St = st zt
(14)
for all t = 0, 1, ..., T − 1, where the above expectation is taken over the random variable At . These are our new optimality equations.
3.2
The algorithm
Now we are ready to introduce our algorithm. For a sample realization At = at , we propose the following approximation: n o − − − − ˜ ˆ V (st ) = min gt (st , at , zt ) + αVt+1 (st+1 ) zt
We can estimate Vˆt iteratively, where Vˆtk is the value function approximation at iteration k. Let: n o k − − + k−1 − ˆ ˜ Vt (st ) ≡ min czt + h(st + at − Kzt ) + αVt+1 (st+1 ) zt
(15)
k−1 Given that we are in state s−,k and given the value function estimate Vˆt+1 from the previous t −,k k−1 −,k ˆ iteration, we find st+1 using (12) and then evaluate Vt+1 (st+1 ). Then using (15) we can
calculate V˜tk (s) for any value of s ∈ S.
15
To get the value function estimate for time t iteration k, Vˆtk , we use an updating function ˆ k−1 (for U that takes as arguments the current state s−,k t , the previous iteration estimate Vt smoothing), and the function V˜tk given by (15): Vˆtk = U (Vˆtk−1 , V˜tk , s−,k t ) The function U is specific to the type of approximation used and we define two possible updating functions (linear and nonlinear) in sections 4.1 and 4.2. k−1 Now, given Vˆt+1 , we can find an approximate service rule by solving:
zt (s−,k t )
n o −,k −,k + k−1 + ˆ = arg min cz + h(st + at − Kz) + αVt+1 ((st + at − Kz) ) z∈{0,1}
With a service rule in hand we can find the state variable in the next time period using the transfer function (12). Our algorithm, then, works as follows: Adaptive dynamic programming algorithm = s0 for all k. Set k = 1, t = 0. Step 1 Given s0 : Set Vˆt0 = 0 for all t. Set s−,k 0 Step 2 Choose random sample ω = (a0 , a1 , ..., aT −1 ). Step 3 Calculate: zt (s−,k t ) = arg min
z∈{0,1}
n o −,k k−1 + ˆ gt− (s−,k , a , z) + α V ([s + a − Kz] ) (16) t t t t t+1
and −,k + s−,k + at − Kzt (s−,k t )] . t+1 = [st
(17)
Step 4 Then, from: n o − − k−1 − ˆ V˜tk (s− ) = min g (s , a , z ) + α V (s ) t t t t t t+1 t+1 z
Update the approximation using some update function: Vˆtk = U k (Vˆtk−1 , V˜tk , s−,k t )
(18) 16
Step 5 If t < T then go to step 3; else go to step 6. Step 6 If k < N , then set k = k + 1, t = 0 and go to step 2; else stop here (here N is the number of iterations). The above algorithm goes forward through time at each iteration. This is the single pass k−1 algorithm, which calculates V˜ k as a function of Vˆt+1 . We can redefine V˜ k (s− t ) using: t
t
n o − − k − k − ˆ ˜ Vt (st ) = min gt (st , at , zt ) + αVt+1 (st+1 ) zt
(19)
k k where V˜tk is a function of Vˆt+1 . If we use this approximation, we have to calculate Vˆt+1 before k ˜ calculating Vt , which can be done if we execute a backward pass.
This suggests a two pass version of the algorithm. At each iteration k, given the function Vˆtk−1
for all times, we go forward through time using equations (16) and (17) calculating the
decision variable and the state variable through time. Then we go backwards through time using (19), the update function given in (18), and the state trajectory we calculated in the forward pass. Alternative methods of interest for solving the single product dispatch problem are classical backward dynamic programming and functional neuro-dynamic programming. Backward dynamic programming is an exact algorithm but it suffers from the curse of dimenionality. There are three curses of dimenionality: large state space, large outcome space, large action space. In our problem the action space has been reduced but the state and outcome spaces are large. Thus, classical dynamic programming cannot handle large instances of the multiprodut problem because it evaluates at each iteration throughout the whole outcome, action and state space. The adaptive dynamic programming and neuro-dynamic programming algorithms are an improvement concerning the curse of dimensionality. They both avoid evaluating through the whole state space in step 3 by using functional approximations which only require the estimation of a few parameters to approximate the whole value function. The functional neuro-dynamic programming algorithm updates the value function estimates, at each iteration, by generating several state trajectories using Monte Carlo sampling and solving a least squares regression problems. The adaptive dynamic programming algorithm updates the value function estimates, at each iteration, using the updating function, which calculates discrete derivatives at a single state. In general, both algorithms described above manage to eliminate a significant number 17
of calculations by using Monte Carlo sampling. However, the calculations performed, at each iteration, are significantly smaller in the adaptive dynamic programming algorithm than the neuro-dynamic programming algorithm. We believe that our adaptive dynamic programming algorithm is easier and faster to implement for our problem class and still gives good approximations of the value functions.
4
Approximate dynamic programming methods
In this section we introduce a linear and a nonlinear approximate adaptive dynamic programming method.
4.1
A linear approximation
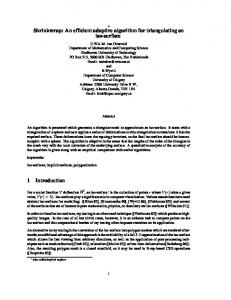
This section motivates and implements a linear functional approximation of the value function. An instance of a typical value function is shown in Figure 1. The shape of the value function is approximately linear. This motivates the use of a linear approximation method. The linear approximation model gives us a simple starting point in implementing the Adaptive Dynamic Programming Algorithm described in section 3. Our approach is to replace Vt− (s− t ) with a linear approximation of the form: − Vˆt (s− t ) = v t st
which then yields a simple dispatch strategy that is easily implemented within a simulation system. Given V˜t (s− t ), we can fit a linear approximation using: v˜t = ∆V˜t (s− t ) i h − − ˜ ˜ ≈ Vt (st + ∆st ) − Vt (st ) /∆st
(20)
Given Vˆtk (s− t ), we can find an approximate service rule by solving: zt (s− t ) = arg min
z∈{0,1}
�
+ − + cz + h(s− t + at − Kz) + αvt+1 (st + at − Kz)
18
5800
5600
5400
Cost
5200
5000
4800
4600
optimal 4400
0
5
10
15
20 25 30 Number of customers at time 0
35
40
45
Figure 1: Sample illustration of a value function which is equivalent to: − 1 st + at ≥ K, K ≥ ut − zt (s− or s− t ) = t + at < K, st + at ≥ ut 0 otherwise
(21)
where ut = c/(h + αvt+1 )
(22)
is our control limit structure. Our updating function U (Vˆtk−1 , V˜tk , s−,k t ) for the case of a linear approximation takes the form of simply smoothing on v˜: v¯tk+1 = (1 − αk )¯ vtk + αk v˜tk+1
(23) 19
50
where αk is a sequence that satisfies
P∞
k k=0 α = ∞ but
P∞
k=0 (α
k 2
) < ∞. To estimate the
linear approximation, we define: � + k−1 − − st+1 vt+1 V˜tk (s− t ) = min czt + h(st + at − Kzt ) + α¯ zt
− We wish to estimate a gradient of V˜tk (s− t ). Let ∆s be an increment of st where we may use
∆s = 1, or larger values to stabilize the algorithm. Given ∆s, let: ∆z(s− t ) =
� − z(s− t + ∆s) − z(st ) /∆s
We now have, for a given change in the state variable, the change in the decision variable. −,k From this, we can estimate the slope of V˜t (s− t ) at iteration k, for a given state st . We substitute into (20) and manipulate the equation to the following expression for v˜tk : v˜tk =
k−1 n o (h + α¯ vt+1 ) −,k −,k −,k + + (s−,k + a + ∆s − Kz (s + ∆s)) − (s + a − Kz (s )) (24) t t t t t t t t ∆s −,k +c∆zt (st ).
The above expression for v˜tk defines the update function U of the algorithm in the case of a linear approximation, because v˜tk , which becomes v¯tk after smoothing, completely defines Vˆ k : t
Vˆtk (s) = v¯tk s.
4.2
A concave approximation
In the previous section we looked at figure 1 which indicated approximately linear behavior over an extended range. However, if we observe the function between states 0 to K (K=20), we see that the function has a piecewise concave behavior. We are mainly interested in the states s ∈ {0, ..., K}, because this is the range that the state variable most frequently appears. Thus we propose a concave approximation of the value function. To proceed we use a technique called Concave Adaptive Value Estimation (CAVE) developed by Godfrey & Powell (2001). CAVE constructs a sequence of concave piecewise-linear approximations using discrete derivatives of the value function at different points of its domain. At each iteration the algorithm takes three arguments to update the approximation 20
of the function: the state variable and the left and right derivatives of the value function at that state. The left and right derivatives are as follows: h i k −,k k −,k ˜ ˜ ∆+ V˜tk (s−,k ) = V (s + ∆s) − V (s ) /∆s t t t t t i h ˜ k −,k − ∆s) /∆s ˜ k −,k ∆− V˜tk (s−,k t ) = Vt (st ) − Vt (st So the update function (U ) of the Adaptive Dynamic Programming Algorithm is the CAVE algorithm − ˜ k −,k Vˆtk = U CAV E (Vˆtk−1 , ∆+ V˜tk (s−,k t ), ∆ Vt (st )).
We use the CAVE technique to approximate T value functions V0 , ..., VT −1 .
5
Experiments for the Single-product problem
In this section we test the performance of our approximation methods. We take advantage of the fact that the single-product batch dispatch problem can be solved optimally, thus giving the optimal solution on the total cost. We design the experiments in section 5.1, construct the format of the algorithms in section 5.2, and finally in section 5.3 we discuss and compare the performance of different approximation methods.
5.1
Experimental Design
This section describes the experiments that test the performance of the dynamic programming approximations. We design the parameter data sets and describe the competing strategies. Data Sets In order to test the linear and concave approximation algorithms on our model, we create data sets by varying the arrival sets (deterministic and stochastic) and some other model parameters. We chose ten different deterministic scenarios of arrivals throughout the time horizon, out of which four are periodic arrival scenarios; the remaining six are aperiodic scenarios 21
generated uniformly either from {0, 1, 2, 3} or {0, 1, 2, 3, 4, 5, 6}. The periodic arrival sets go through periods of zero arrivals, which are what we call ‘dead periods’. This is a natural phenomenon in actual arrival scenarios for some applications. Thus, we also introduce ‘dead periods’ in the aperiodic uniformly generated arrival sets. Figure 2 shows the three types of data sets: periodic, uniformly generated aperiodic without dead periods and with dead periods. In general, we try to design our arrival sets so that they vary with respect to periodicity, length of dead periods, mean number of arrivals and maximum number of arrivals.
Arrivals−set1
6 4 2 0
0
20
40
60
80
100
120
140
160
180
200
0
20
40
60
80
100
120
140
160
180
200
0
20
40
60
80
100 Time
120
140
160
180
200
Arrivals−set2
6 4 2 0
Arrivals−set3
6 4 2 0
Figure 2: Arrival set 1 is a periodic arrival set wtih dead periods; Arrival sets 2 and 3 are aperiodic uniformly generated without dead periods and with dead periods. We fix the following parameters T = 200, ∆s = 1, c = 200, α = 0.99 throughout the data sets. However, we vary the holding cost per unit per time period (h = 2, 3, 5, 8, 10) and the vehicle capacity (K = 8, 10, 15). By varying these two parameters we create 10 situations where the average holding cost per unit is greater than, approximately equal to, or less than 22
the dispatch cost per customer (c/K). Note that we approximate the average number of time periods that a unit waits at the station by (K/2)/λ, assuming that on average the size of dispatch batch is half the vehicle capacity. If we let λ be the average number of arrivals per time period then the average holding cost per unit is h(K/2)/λ. Thus we have a total of 100 data sets (10 × 10). We run the experiments for all 100 data sets but for convenience in reporting results we group them into six groups according to their different features. In table 1 we see that the data sets are grouped according to periodicity and according to the relationship between average holding cost per unit and dispatch cost per unit. We report the performance results of these six groups. We introduce randomness in the arrival process by assuming that the arrivals follow a Poisson distribution with known mean. For the Poisson mean parameters, we use the arrival scenarios that were used in the deterministic case. All other parameters remain the same. Again we group them in the corresponding six groups according to the same criteria. Altogether we have twelve groups of data sets to report (see table 1). The stochastic data sets are a more realistic part of our model because arrivals are never known ahead of time. We will see that randomness does not complicate the algorithms and it actually improves the results. Competing Strategies We categorize different policies by letting: � Π = ΠM Y OP IC , ΠV ALU E , Π∗ The set ΠM Y OP IC contains the set of policies that use only the state variable to make decisions. Π∗ is the set of optimal policies. Our approximation algorithms generate policies that belong to the set ΠV ALU E , which is the set of policies derived from functional approximations of value functions. We can separate the value function approximation policies into the sets: � ΠV ALU E = ΠLV , ΠN LV where ΠLV , ΠN LV are the sets of policies from linear and nonlinear approximations of value functions. We use policies from both sets. The current competition for this type of problem are the myopic policies (ΠM Y OP IC ) because they are most frequently used in practice. So, we design our own myopic heuristic 23
rule for comparison. We dispatch either when the number of units at the station has exceeded the vehicle capacity or when the vehicle has been waiting for more than τ time periods without performing a dispatch. The time constraint τ is a constant which is set at the beginning of the decision process. However, to make the heuristic more effective we ran the problem for all τ = 0, ..., 30, for each data set, and picked the one that performs the best for that specific data set. To improve it even more, we stop the time constraint counter when the state variable is zero so that we do not dispatch an empty vehicle. We call this heuristic “Dispatch When Full with a Time Constraint” (DWF-TC). DWF-TC is a heuristic that finds the best time constraint to hold until performing a batch dispatch. However, it is still a stationary heuristic. It globally chooses the best time constraint but it is not as efficient as a dynamic service rule.
5.2
Calibrating the Algorithm
In this section we find the number of iterations to run the algorithms and we decide on a stepsize rule. Number of Iterations Our stopping rules are based on determining the required number of iterations to run the algorithm, in order to achieve the appropriate performance levels for each approximation method. In general, experiments have two types of iterations: training and testing. Training iterations are performed in order to estimate the value approximations. Testing iterations are performed to test the performance of a specific value function approximation. At each training iteration we randomly choose an initial state from the set {0, 1, ..., K − 1}. This allows the algorithm to visit more states. Also, we perform the testing iterations for different values of the initial state (s0 = 0, ..., K − 1) and we average costs accordingly. For the deterministic data sets we use one testing iteration which is the last training iteration. For the stochastic data sets we test for 100 iterations and we average the values over iterations. To determine the appropriate number of training iterations, we ran a series of tests. Out of the 100 data sets we picked 10 that are a representative sample in terms of average demand and holding/dispatch cost relationships. Then we ran the linear and concave algorithms on these data sets and calculated their error fraction from optimal for different number 24
percentage error from optimal
Deterministic concave linear
0.2 0.15 0.1 0.05 0
0
50
100
150 iterations
200
250
300
percentage error from optimal
Stochastic concave linear
0.15
0.1
0.05
0
0
50
100
150 iterations
200
250
Figure 3: Number of training iterations versus error fraction from optimal for deterministic and stochastic arrivals of iterations. We plot the graphs of error fraction from optimal versus number of training iterations in figure 3. The linear approximation method seems to stabilize after 100 iterations. We choose to run it for 25 since we are interested in checking its performance on a small number of iterations and we also run it for 50, 100 and 200 training iterations for better results. The performance of the concave approximation method stabilizes after 150 iterations and for comparison we choose to run it for 25, 50, 100, and 200 iterations. Stepsize Rule In the linear approximation we use a stepsize rule of the form α/(β + k) for smoothing discrete derivatives, where k is the number of iterations. We tested different values of α and β on several data sets and found that the stepsize 9/(9 + k) worked best. 25
300
Method Iterations
cave (25)
cave (50)
cave (100)
cave (200)
linear linear linear linear DWF(25) (50) (100) (200) TC
0.190 0.121 0.209 0.125 0.098 0.060 0.144 0.117 0.069 0.039 0.058 0.037
0.140 0.131 0.111 0.078 0.060 0.043 0.104 0.066 0.056 0.032 0.045 0.030
0.063 0.079 0.068 0.034 0.040 0.035 0.071 0.052 0.038 0.026 0.039 0.028
0.048 0.073 0.050 0.024 0.028 0.029 0.056 0.018 0.027 0.014 0.036 0.019
0.165 0.130 0.175 0.087 0.080 0.049 0.110 0.048 0.055 0.033 0.059 0.037
0.166 0.130 0.175 0.090 0.068 0.044 0.103 0.050 0.043 0.018 0.052 0.028
0.159 0.129 0.167 0.090 0.064 0.041 0.101 0.054 0.046 0.026 0.057 0.033
0.154 0.131 0.171 0.085 0.066 0.042 0.113 0.050 0.038 0.014 0.054 0.032
0.856 0.494 0.681 0.350 0.271 0.108 0.205 0.125 0.069 0.047 0.068 0.054
Average
0.128
0.086
0.053
0.041
0.107
0.101
0.099
0.099
0.358
periodic std. dev. aperiodic std. dev. periodic std. dev. aperiodic std. dev. periodic std. dev. aperiodic std. dev.
0.255 0.171 0.199 0.126 0.075 0.039 0.062 0.038 0.030 0.012 0.029 0.014
0.130 0.096 0.098 0.075 0.040 0.025 0.034 0.022 0.023 0.010 0.016 0.009
0.061 0.045 0.042 0.033 0.021 0.012 0.022 0.014 0.017 0.009 0.013 0.003
0.032 0.028 0.018 0.013 0.013 0.006 0.015 0.009 0.017 0.008 0.010 0.002
0.082 0.055 0.071 0.034 0.040 0.017 0.057 0.030 0.029 0.013 0.031 0.012
0.070 0.053 0.050 0.024 0.031 0.011 0.035 0.020 0.025 0.012 0.019 0.009
0.058 0.046 0.045 0.019 0.024 0.011 0.023 0.008 0.019 0.009 0.015 0.005
0.062 0.056 0.038 0.018 0.024 0.014 0.024 0.012 0.019 0.009 0.013 0.005
0.856 0.428 0.691 0.337 0.270 0.085 0.195 0.111 0.067 0.037 0.059 0.046
Average
0.108
0.057
0.029
0.017
0.052
0.038
0.031
0.030
0.356
Deterministic hold/dispatch Periodicity h > c/K periodic std. dev. aperiodic std. dev. h ' c/K periodic std. dev. aperiodic std. dev. h < c/K periodic std. dev. aperiodic std. dev.
Stochastic h > c/K
h ' c/K
h < c/K
Table 1: Fraction of total costs produced by each algorithm over the optimal cost: averages and standard deviations within each group.
5.3
Experimental Results
In this section we report on the experimental results and discuss the performance of each approximation. The results of our experiments for each method and each data group are 26
listed in table 1. The entries in the table are group averages and standard deviations of the total costs relative to the optimal cost. Value Approximation Performance The dynamic programming approximation methods perform significantly better than the stationary heuristic. Their error fractions from optimal are relatively small for a higher number of training iterations and at the same time they perform reasonably well for a small number of training iterations. The satisfying performance of the value function approximation methods is consistent throughout the data sets and this is confirmed by the relatively low standard errors. This is not true for DWF-TC, whose error fractions fluctuate highly between data sets. Overall our algorithms perform much better with stochastic data sets. This is encouraging because in practice arrivals are usually stochastic. With Monte Carlo sampling the arrivals are different at each iteration and as a result the algorithm visits a wider range of states over time. Thus the value functions are evaluated at a larger number of states which gives us a better approximation. The improvement in the linear approximation when jumping from deterministic to stochastic data sets is much larger than in the concave approximation. This is because the value function is smoother in the stochastic case as a result of taking expectations over all possible states (see equation (5)). Thus the shape of the value function becomes closer to linear when we are dealing with stochastic arrivals (see figure 4). The performance of DWF-TC is the same for deterministic and stochastic data sets. Another general observation is that the linear and concave approximation methods have the highest errors when the average holding cost per customer is greater than the dispatch cost per customer. This suggests that the approximation methods incur a higher total holding cost than the optimal, which means that their dispatch decision rules have the vehicle idle longer than the optimal dispatch rules. This phenomenon is apparent in the linear approximation method even for a large number of training iterations. However, in the case of the concave approximation the error fractions for these high holding cost data sets tend to even out after many training iterations. In the case of the stationary heuristic, the relative error of high waiting cost data sets is very high (85%) and it gradually decreases (to 6%) as the holding cost decreases. This suggests that DWF-TC usually performs dispatches at vehicle capacity and this incurs high total holding cost. Even if the time constraint τ is optimized, DWF-TC cannot avoid the high holding costs because it is a stationary rule. Our approximation methods in the deterministic case perform better with periodic data sets than with aperiodic. This is not the case with stochastic data where periodicity does not 27
3000 2950 2900 2850
value
2800 2750 2700 2650 2600 2550 2500
deterministic stochastic 0
1
2
3
4
5 state
6
7
8
9
10
Figure 4: The value function is smoother with stochastic arrival sets affect the results. In the deterministic case the algorithms learn about the periodic arrival patterns during the training iterations, whereas in the stochastic case the periodicity is only expressed in the means of the arrival distributions and not in the actual arrivals.
6
Experiments for the Multiproduct Problem
Until this point we discussed solution methodologies for the the single-product batch dispatch problem which resulted in a scalar state variable. This allowed us to compare our approximations to the optimal solution. In this section we consider solution strategies for the multiproduct problem. In the following discussion we describe the extension of the algorithm from section 3.2 to the multidimensional case and present the experimental results. Approximation methods We test our linear adaptive dynamic programming functional approximation algorithm in the multiproduct batch dispatch problem . The algorithm is very similar to the one introduced in section 3. Here all the calculations are performed with vectors instead of 28
scalars. The differences appear in step 3 and 4 of the algorithm in the calculation of the multi-dimensional discrete derivatives ∆V˜ . The discrete derivatives are calculated for each customer class. Thus ∆V˜ is an mdimensional vector. In the linear approximation method, which is our current consideration, the discrete derivatives are the slopes vˆt of the linear approximation value function estimate Vˆt : Vˆt (s) = vˆtT s
The revised steps of the algorithm are as follows: Step 3: Calculate ztk = arg min
�
zt ∈{0,1}
czt + hT (st + at − zt χ(st + at )) + α(ˆ vtk−1 )T (st + at − zt χ(st + at ))
and skt+1 = (skt + at − ztk χ(skt + at )) Step 4: Using: V˜tk (s) = min
zt ∈{0,1}
�
czt + hT (s + at − zt χ(s + at )) + α(ˆ vtk−1 )T (s + at − zt χ(s + at )) ,
update the approximation as follows. For each i = 1, ..., m, let: vˆtik =
V˜tk (skt + ei ) − V˜tk (skt ) ∆s
where ei is an m-dimensional vector with ∆s in the ith entry and the rest zero. Experiments A set of experiments was performed with different holding cost per customer class. In this case we cannot compare the results to the optimal solution but we still compare them to a myopic rule. We use a myopic rule similar to the one we described in section 5.1. The only difference is that when it takes a decision to perform a dispatch the products are picked from each product class according to the function χ.
29
Our experiments use the same stochastic and deterministic data sets that we described in section 5.1. The initial number of customers (s0 ) and the arrivals at time t (At ) are distributed between customer classes uniformly. We run the experiments for 100 customer classes, in order to display the performance of our algorithm in a problem with a huge state space. The holding cost values for the different product classes are picked uniformly from the set [h − h/3, h + h/3], where h is the single holding cost value of the equivalent data set in the single-product case. All other parameters and arrival sets remain the same. The results of these experiments are displayed in table 2. The entries of table 2 are group averages and standard deviations of the total expected cost of the linear approximation method as a fraction of the total expected cost of the DWF-TC heuristic. For comparison purposes, we include in the table the equivalent fractions for the scalar case (that come from the experiments of table 1). Although the results of our approximation are not compared to the optimal results, they still outperform the results of the myopic rule. The performance of the linear algorithm relative to the DWF-TC heuristic in the multidimensional problem is slighly worse but quite similar to its performance in the scalar problem. This is true for both group averages and standard deviations. This gives us reasons to believe that the linear adaptive dynamic programming algorithm performs in the multidimensional case as well as in the scalar case. The linear approximation method performs considerably better with stochastic data sets. The competition with the myopic rule arises in data sets of low holding cost. However, even for these data sets the myopic rule does not outperform our algorithm. In table 3 we see that the running times of our approximation are higher than the ones of the myopic rule but they are quite reasonable. The problem that we are solving here has a state space of size greater than K 100 . Solving this problem using backward dynamic programming is impossible. In practice stationary myopic rules are used that are less sophisticated than the one we designed in this paper. Overall our approximation methods are scalable to multi-dimensional problems which cannot be solved optimally, and they outperform myopic rules that are often used in practice.
30
Method
linear linear linear linear scalar scalar scalar scalar (25) (50) (100) (200)
linear linear linear linear mult. mult. mult. mult. (25) (50) (100) (200)
Deterministic hold/dispatch Periodicity h > c/K periodic std. dev. aperiodic std. dev. h ' c/K periodic std. dev. aperiodic std. dev. h < c/K periodic std. dev. aperiodic std. dev.
0.650 0.104 0.722 0.122 0.854 0.073 0.927 0.069 0.989 0.036 0.993 0.039
0.650 0.105 0.721 0.120 0.845 0.070 0.922 0.062 0.977 0.032 0.987 0.036
0.646 0.101 0.717 0.123 0.842 0.065 0.920 0.072 0.979 0.031 0.991 0.033
0.643 0.099 0.719 0.122 0.843 0.064 0.930 0.069 0.972 0.033 0.988 0.029
0.681 0.103 0.732 0.116 0.878 0.062 0.943 0.064 1.003 0.027 1.003 0.024
0.680 0.109 0.730 0.117 0.874 0.066 0.929 0.063 0.992 0.024 0.995 0.023
0.678 0.107 0.726 0.115 0.869 0.058 0.929 0.061 0.984 0.023 0.990 0.025
0.676 0.104 0.729 0.115 0.873 0.058 0.932 0.062 0.980 0.024 0.995 0.026
Average
0.856
0.850
0.849
0.849
0.873
0.867
0.863
0.864
0.602 0.097 0.655 0.115 0.822 0.053 0.891 0.069 0.966 0.026 0.976 0.033
0.597 0.099 0.642 0.115 0.815 0.052 0.873 0.068 0.962 0.027 0.964 0.035
0.591 0.102 0.639 0.115 0.809 0.051 0.863 0.072 0.957 0.029 0.960 0.038
0.592 0.100 0.635 0.115 0.809 0.049 0.863 0.070 0.956 0.030 0.959 0.037
0.633 0.100 0.668 0.119 0.850 0.051 0.909 0.073 0.977 0.021 0.985 0.023
0.626 0.103 0.660 0.116 0.839 0.049 0.893 0.065 0.968 0.024 0.976 0.028
0.619 0.101 0.654 0.119 0.835 0.049 0.883 0.066 0.965 0.025 0.971 0.028
0.619 0.101 0.650 0.119 0.835 0.047 0.881 0.065 0.964 0.024 0.969 0.031
0.819
0.809
0.803
0.802
0.837
0.827
0.821
0.820
Iterations
Stochastic h > c/K
h ' c/K
h < c/K
Average
periodic std. dev. aperiodic std. dev. periodic std. dev. aperiodic std. dev. periodic std. dev. aperiodic std. dev.
Table 2: Group averages and group standard deviations of the (expected) cost of the linear method as a fraction of the cost of the DWF-TC myopic heuristic: for both the scalar problem (presented in table 1) and the multidimensional problem.
31
Method Iterations
linear linear linear linear DWFmult. mult. mult. mult. TC (25) (50) (100) (200)
Running times in seconds deterministic stochastic
91 93
155 158
283 286
540 543
21 23
Table 3: Running times for the linear approximation method and the DWF-TC heuristic for the multiproduct problem with 100 product classes
Acknowledgement This research was supported in part by grant AFOSR-F49620-93-1-0098 from the Air Force Office of Scientific Research.
The authors also wish to thank the reviewers for the careful
and constructive comments provided during the review.
32
A
Appendix: Proofs
Proof of lemma 1 We will prove that it is always better to dispatch from more expensive classes when faced with the decision to choose units for dispatch from several classes. This proves that χ(st ) is the optimal decision variable, given that the vehicle is dispatched and we are in state st . From the definition of our action space (1), this type of decision comes up when:
K≤
m X
sti ,
(25)
i=1
This occurs when the vehicle cannot be filled with all the products at the station and a decision has to be made on how many products to dispatch from each class. Assume that we are at state st such that (25) holds. Let xt be a nonzero feasible decision possibility such that xt ∈ X (st ) and xt + ej − ei ∈ X (st ) for i < j. Note that the decision xt + ej − ei dispatches one less unit from a class with higher holding cost and one more unit from a class with lower holding cost. We want to show that: vt (st , xt ) ≤ vt (st , xt + ej − ei ),
(26)
which in turn proves that it is always better to dispatch from more expensive classes and thus the best way to dispatch is according to the function χ. To prove (26), we start by showing that: gt (st , xt ) ≤ gt (st , xt + ej − ei ), which is equivalent to: c + hT (st − xt ) ≤ c + hT (st − xt − ej + ei ) This reduces to: hT ej ≤ hT ei which is true since j is a cheaper class in terms of holding cost. 33
Then we show that: X
X
pt+1 (at+1 )Vt+1 (st − xt + at+1 ) ≤
at+1 ∈A
pt+1 (at+1 )Vt+1 (st − xt − ej + ei + at+1 )
at+1 ∈A
Since Vt+1 is assumed to be monotone with respect to product classes the above inequality holds. Thus we have (26) which proves that xt performs better than xt + ej − ei . Thus the optimal decision variable is either 0 or χ(st ).
�
Proof of proposition 1: We prove this by induction on t. We assume that the terminal value function, VT , is zero and thus satisfies the monotonicity assumption. We assume that Vt+1 is monotone with respect to product classes and we want to prove the same for Vt . By lemma 1 we know that the optimal decision variable at time t is either 0 or χ(st ). Thus we can rewrite the value function recursion as follows: X Vt (st ) = min cz + hT (st − zχ(st )) + α pt+1 (at+1 )Vt+1 (st − zχ(st ) + at+1 ) z∈{0,1} at+1 ∈A
where now the decision is whether or not we should dispatch. At this point we define a new cost function wt : wt (st , zt ) = czt + hT (st − zt χ(st )) + α
X
pt+1 (at+1 )Vt+1 (st − zt χ(st ) + at+1 )
at+1 ∈A
Monotonicity with respect to product classes of Vt is equivalent to showing that for i < j and i picked such that st,i > 0, we have: min wt (st + ej − ei , zt ) ≤ min wt (st , zt )
zt ∈{0,1}
zt ∈{0,1}
(27)
We prove that for all zt ∈ {0, 1} we have: wt (st + ej − ei , zt ) ≤ wt (st , zt )
(28)
When zt = 0 then (28) is trivial from the induction hypothesis and the monotone holding cost structure. 34
When zt = 1, we consider the relationships of the vectors χ(st ) and χ(st + ej − ei ). Let l be such that the following inequalities hold: l−1 X
st,k < K ≤
k=1
l X
st,k
k=1
This means that according to the χ(st ) decision variable all classes from 1 to l − 1 are dispatched along with some units from class l. When the state is st and we take decision χ(st ), we consider the following three cases: Case 1: i < j ≤ l In this case units from classes i and j are dispatched. Thus from the definition of χ we have: χ(st + ej − ei ) = χ(st ) + ej − ei using the above equation (28) becomes trivial. Case 2: l < i < j In this case units from classes i and j are not dispatched and thus we have: χ(st + ej − ei ) = χ(st ) using the above equation (28) becomes trivial. Case 3: i ≤ l < j In this case units of class i are dispatched but not units of class j. Since the state variable st has one more unit in class i than st + ej − ei , the decision variable χ(st ) will dispatch one more unit from class i and one less from class l than the decision variable χ(st + ej − ei ): χ(st + ej − ei ) = χ(st ) + el − ei using the above equation and the fact that hT el ≤ hT ei , (28) is easily verified. We have proved (28) for all zt which implies (27) which in turn is equivalent to the fact that the value function at time t, Vt , is monotone with respect to product classes. This completes the induction proof.
�
35
References Anupindi, R. & Tayur, S. (1998), ‘Managing stochastic, multiproduct systems: Model, measures and analysis’, Operations Research 46(3), S98–S111. 2 Bailey, N. (1954), ‘On queueing processes with bulk service’, J. Royal. Stat. Soc. B16, 80–87. 1 Barnett, A. (1973), ‘On operating a shuttle service’, Networks 3, 305–314. 1 Bassok, Y., Anupindi, R. & Akella, R. (1999), ‘Single-period multiproduct inventory models with substitution’, Operations Research 47(4), 632–642. 2 Bertazzi, L. & Speranza, M. G. (1999a), ‘Inventory control on sequences of links with given transportation frequencies’, International Journal of Production Economics 59, 261–270. 2 Bertazzi, L. & Speranza, M. G. (1999b), ‘Minimizing logistic costs in multistage supply chains’, Naval Research Logistics 46, 399–417. 2 Bertazzi, L., Bertsekas, D. & Speranza, M. G. (2000), Optimal and neuro-dynamic programming solutions for a stochastic inventory trasportation problem, Unpublished technical report, Universita Degli Studi Di Brescia. 2 Bertsekas, D. & Tsitsiklis, J. (1996), Neuro-Dynamic Programming, Athena Scientific, Belmont, MA. 2, 3 Chaudhry, M. & Templeton, J. (1983), A First Course in Bulk Queues, Wiley, New York. 2 Deb, R. (1978a), ‘Optimal control of batch service queues with switching costs’, Advances in Applied Probability 8, 177–194. 1 Deb, R. (1978b), ‘Optimal dispatching of a finite capacity shuttle’, Management Science 24, 1362–1372. 1 Deb, R. & Schmidt, C. (1987), ‘Optimal average cost policies for the two-terminal shuttle’, Management Science 33, 662–669. 1 Deb, R. & Serfozo, R. (1973), ‘Optimal control of batch service queues’, Advances in Applied Probability 5, 340–361. 1 Godfrey, G. A. & Powell, W. B. (2001), ‘An adaptive, distribution-free approximation for the newsvendor problem with censored demands, with applications to inventory and distribution problems’, Management Science 47(8), 1101–1112. 20 Ignall, E. & Kolesar, P. (1972), ‘Operating characteristics of a simple shuttle under local dispatching rules’, Operations Research 20, 1077–1088. 1 Ignall, E. & Kolesar, P. (1974), ‘Operating characteristics of an infinite capacity shuttle: control at a single terminal’, Operations Research 22, 1003–1024. 1 Kosten, L. (1967), The custodian problem, in R. Cruon, ed., ‘Queueing Theory, Recent Developments and Applications’, English Press, Ltd, London, pp. 65–70. 1 Kosten, L. (1973), Stochastic Theory of Service Systems, Pergamon Press, New York. 1 Medhi, J. (1984), Recent Developments in Bulk Queueing Models, Wiley Eastern Limited, New Delhi. 1, 2 36
Neuts, M. (1967), ‘A general class of bulk queues with Poisson input’, Ann. Math. Stat. 38, 759–770. 2 Papadaki, K. & Powell, W. B. (2002), ‘A monotone adaptive dynamic programming algorithm for a stochastic batch service problem’, European Journal of Operational Research 142(1), 108–127. 1, 2 Powell, W. B. (1985), ‘Analysis of vehicle holding and cancellation strategies in bulk arrival, bulk service queues’, Transportation Science 19(4), 352–377. 2 Powell, W. B. & Humblet, P. (1986), ‘The bulk service queue with a general control strategy: Theoretical analysis and a new computational procedure’, Operations Research 34(2), 267– 275. 2 Puterman, M. L. (1994), Markov Decision Processes, John Wiley and Sons, Inc., New York. 11, 12 Speranza, M. & Ukovich, W. (1994), ‘Minimizing trasportation and inventory costs for several products on a single link’, Operations Research 42, 879–894. 2 Speranza, M. & Ukovich, W. (1996), ‘An algorithm for optimal shipments with given frequencies’, Naval Research Logistics 43, 655–671. 2 Sutton, R. & Barto, A. (1998), Reinforcement Learning, The MIT Press, Cambridge, Massachusetts. 2 Tsitsiklis, J. & Van Roy, B. (1997), ‘An analysis of temporal-difference learning with function approximation’, IEEE Transactions on Automatic Control 42, 674–690. 2, 3 Weiss, H. (1981), ‘Further results on an infinite capacity shuttle with control at a single terminal’, Operations Research 29, 1212–1217. 1 Weiss, H. & Pliska, S. (1976), Optimal control of some Markov processes with applications to batch queueing and continuous review inventory systems, Discussion paper no. 214, The Center for Mathematical Studies in Economics and Management Science, Northwestern University. 1
37