Jul 3, 2009 - fields for search and rescue simulated robots. In this paper we ... University College London, Gower Street, London WC1E 6BT, UK. { p.saeedi ...
Proceedings of the World Congress on Engineering 2009 Vol I WCE 2009, July 1 - 3, 2009, London, U.K.
An Algorithmic Approach to Generate After-disaster Test Fields for Search and Rescue Agents Panteha Saeedi
and
Abstract—Autonomous navigation in unknown cluttered environments is one of the main challenges for search and rescue robots inside collapsed buildings. Being able to compare different search strategies in various search fields is crucial to attain fast victim localization. Thus we discuss an algorithmic development and proliferation of realistic after–disaster test fields for search and rescue simulated robots. In this paper we characterized our developed search environments by their fractal dimensions. This index has shown to be a discriminative index for narrow pathways inside confined and cluttered spaces in our simulation test fields. In this approach a simulation of challenging parts of NIST red course is constructed and a benchmark for search strategies has been evaluated. Index Terms—exploration algorithms, Fractal tortuosity, Search and Rescue operations, Multi agent.
path
I. INTRODUCTION Inside unstructured and partially collapsed buildings in disaster areas, there are dangerous, unknown, and cluttered parts known as life safe voids [1]. These voids are the first place which rescue team should search for trapped victims inside the pancake collapses, since the chance of finding live victims is very high. However traditional tracked robots are not always able to crawl inside small voids and look for survivors (size limitation). Our approach is to evaluate the performance of multi-robot search techniques, for limited sensing mini robots, by reproducing various cluttered test courses. The introduction of discriminative indices, which defines search fields complexity and providing reference problems with metric of performance, allows the researchers create synthetic fields with which to compare their search strategies. Voshell et al. [15] studies ascertain that traditional performance measures are inadequate and incomplete for analyzing control and exploration tasks, especially inside complex environments. Therefore they introduced a novel analysis approach based on fractal path tortuosity. This index shows (from robot’s movement path) how well a robot can handle the difficulties in the environment. For instance robot’s movement path inside an environment with a high density of obstacles and closed passages (dead ends) has a large fractal path tortuosity comparing to an open space environment with a few obstacles. Thus in this paper we verify that, fractal dimension [2] of pathways (tortuosity)
Manuscript received March 19, 2009 P. Saeedi, and S. Sorensen, Computer Science Department University College London, Gower Street, London WC1E 6BT, UK { p.saeedi | s.sorensen}@cs.ucl.ac.uk
ISBN: 978-988-17012-5-1
Soren A. Sorensen inside the search fields, can also apply to characterize test courses for search robots. In entomology, scientists distinguish tortuosity of insect trails by their fractal dimension. This has been known as long memory Brownian motion, an example of random process that incorporates both statistical self-similarity and tortuosity. There are several tortuosity indices, however fractal dimension of Brownian motion has been known as a quantitative discriminator with which to characterize tortuosity of the trails in a comparative approach [6]. In this paper we deploy basic Ant algorithm, which follows long memory Brownian movement, on our simulated agents to generate various confined search fields (from their trails). Our contributions in this paper are: The development of an algorithmic approach to the generation of realistic after– disaster test fields (map generator) for multi agent search and rescue system. Also introducing an index to differentiate simulated search terrains and defining their complexity. This index is tested on various after – disaster maps, which was developed by our map generator. Finally we were able to predict the average discovery time of Ant algorithm according to search field’s power spectral density (our evaluated benchmark). This paper is organized as follow: Section II contains the motivation of this approach while we have an overview of the research area. Section III presents how we are modelling the multi-agents and their capabilities. In section IV the algorithmic approach for 2D map generating is discussed. Section V introduces our discriminative index and test its effect on random developed search strategies, and in section VI the benchmark is presented. Simulation experimental results are also available in both sections V and VI to show the effectiveness of our novel index and finally we conclude in section VII. II. MOTIVATION The National Institute of Standards and Technology (NIST) defines three distinct areas of increasing verisimilitude and difficulty [7][8]. However they have not defined any exact indices for each test course (three scenarios of progressive difficulty: yellow, orange and red courses) to describe its level of complexity. Using discriminative indices will simplify the development and proliferation of test arenas for urban search and rescue robot systems. The most complex and challenging arena among defined test courses is the red course. It is essentially a
WCE 2009
Proceedings of the World Congress on Engineering 2009 Vol I WCE 2009, July 1 - 3, 2009, London, U.K. rubble pile with assorted debris, which is very difficult for mobile robots to sense and manoeuvre. There are also pancaked collapses (floors collapsed onto the lower floors) with confined voids inside [9]. These narrow pathways and small tunnels (multi connected cavities), which define life safe voids, are the most demanding parts for exploration robots in the red course. An appropriate search technique for multi robots will minimize the overall victim(s) discovery inside these voids. Lewis et al. [10] have developed the simulations test fields of NIST as a reference facility for search and rescue robots. In their approach a simulation of the Orange arena was constructed to evaluate rapidly prototyped interfaces and Robots-Agents-People (RAP) team coordination and control strategies prior to the construction and testing of physical robots. However in orange arena there are no cluttered and confined voids in which mobile robots to manoeuvre. In addition search and rescue operation in complex terrains of the red arena is for collaborative autonomous multi robots. To validate an optimum search strategy, for the red arena, we should test its functionality inside several different simulation environments with various level of complexity, prior to physical tests. III. SIMULATION MULTI-AGENT In this section we define our simulated agents by describing their functionality and setup tasks. There are two main tasks defined for our modelled robots. Firstly they are in charge of creating life safe voids. For this task they are performing a random walk and looking for victims (ant algorithm). Their trail on the field will be marked and defined as the pathways and unexplored cells will be selected as obstacles. Secondly they are modelling our search robots inside the simulation environment. Thus they are able to test the performances of our developed search strategies. A. Ant Random movement
! !
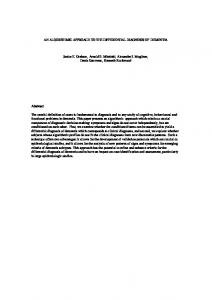
Ant algorithm is one of the most popular exploration techniques and it performs random behaviour; therefore in this paper Ant algorithm has been selected to generate simulation environments as well as testing the developed fields to introduce discriminative index. When agent ants are released at the entrance of the confined simulation search field, they immediately start their random walk inspired by “Brownian movement” [11]. These mobile agents follow a straight line headed to some initial random direction. When they reach the end of this segment, a new direction is chosen according to equation (1). Note that we assume the random function returns a uniform random number (2) in the range of {0...n-1}. Here n = 8, since our agent can randomly select any of eight cells around it. (1) " (t + # ) = " (t) + $ (2) " = 45° # (Random(8) + 1) As indicated in figure 1 there are boundaries defined to limit the environment and set the bounded field for agents to navigate within. Agents should change direction every time
ISBN: 978-988-17012-5-1
they meet the borders or any other obstacle. This is also known as the end of their initial segment. However there is a selected time limit for all ant agents ( " ). Every time an agent reaches its time limit it should choose a random direction according to equation (1) and reset its time limit. To avoid any collision either with other agents or obstacles they are equipped ! with sufficient number of sensors to observe their surroundings (8 Infrared limited sensor range).
Goal
Obstacle
" sec. Start Fig. 1. Random Walk trails in bounded field
! the goal it should randomly choose Every time an ant meets another direction as discussed above. Then it should return back to the start point and report its finding. A Brownian Bridge is a Brownian trail that returns to its starting point. When each ant, which localized victim, creates a Brownian Bridge it has accomplished its task. The execution time to create the Brownian Bridge is called discovery time. This is selected as our metric to measure the performance of multirobot search strategies: discovery time = exploration time +exploitation time
Figure 1 illustrates an agent performing a random Brownian movement to explore a goal. Our simulation agent is able to detect human’s head from its temperature. While we assumed victim is fully dressed so IR sensors can only detect its head. To distinguish live victims with other possible warm objects, our simulated agent is also equipped with NDIR (non dispersive infrared absorbance) sensor, which is able to monitor the amount of CO2 emission, and for human this is highly selective. Furthermore we assumed that the agent detects the victim’s body as an obstacle. B. Modelling search and rescue robots All agents are equipped with a ring of simulated Infrared (IR) sensors. A ring of eight IR elements spaced 45 degrees apart of each other. An IR range reading provides information concerning empty or occupied volumes in the space subtended by the beam (45º cone for the present sensors that covers 8 cells around) in front of the sensor. Light waves from an IR sensor project in a cone-like manner from the point of its origin. It has been considered that each robot has the view of eight cells in its surrounding area. Cells can be empty or occupied (either by other robots or by obstacles). Mobile agents also can move one cell only in any direction, if the selected cell is empty. Mobile agents are aware of their direction (e.g. North, South...) with their equipped gyroscope. More over agents are able to communicate with each other. They interact with each other
WCE 2009
Proceedings of the World Congress on Engineering 2009 Vol I WCE 2009, July 1 - 3, 2009, London, U.K. by sending visual information through their eight triangular RGB (Red, Green, and blue) LEDs. Agents should communicate visually while wireless communication (RF) is unreliable in indoor environments. Visual communication as well is restricted to one cell only in each direction. When simulated agent localized a victim it starts to inform other agents (by changing its LEDs colour) however its task is to create a Brownian bridge and report back its discovery. Other agents that visualize this event will start to speed up the operation. Therefore they change their LEDs colour and perform their search strategy this time their goal is to reach their start point (entrance). However in this approach our agents are not yet able to tag the environment. In future an extra ability will be added to our simulated agents to leave a trail and use the environment as a medium for indirect communication. IV. SIMULATION SEARCH ENVIRONMENT Our simulated agents, by performing Ant Brownian movement, can develop various 2D simulated environments. In this section we describe the algorithmic approach to introduce an after –disaster map generator. As discussed before we use discriminative index to differentiate these generated test fields. This index will be discussed later in this paper. A. Modelling 2D Search Field The simulation environment is divided into several equal regions (square cells with a length of 100 mm), and each cell is covered by simple robot motion (e.g. turn left). In real search and rescue scenarios, for a fast observation larger robots are applied. They are able to avoid obstacles, move over rubbles, and have a larger line of sight comparing to small robots. However they are not able to squeeze inside small gaps and voids. Due to limitation in their functionality they can deploy mini robots whenever it is required to perform an exhaustive search operation. Thus in our scenario there is a Master robot sitting at the start point and sending in smaller robots (we assumed larger robots discovered these narrow voids), one by one inside the search field to perform the second stage of the search operation. There are borders defined for all search fields. These boundaries limit the exploration area. Agents should only perform their search operation within those defined borders and all search fields are limited with boundaries (walls). As discussed above, there are four types of cells in our simulation grid map: 1) Occupied by obstacle, or human body 2) Occupied by human’s head (human cells occupies 2 cells) 3) Occupied by another agent (agent occupies one cell) 4) Empty The first three kinds of cells are un-traversable by agents. We assumed that each agent occupied only one cell every time it moves. Every cell that is explored by any agent will be indicated on the simulation field. Therefore unexplored cells are white, while explored cells by the agents are illustrated with grey colour. This feature demonstrates the
ISBN: 978-988-17012-5-1
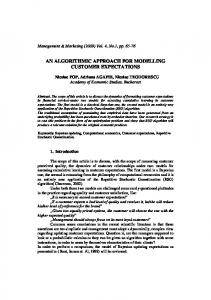
agent’s behaviour visually (e.g. how well the applied search strategy is able to spread its agents inside the search field). B. Map Generator To generate various confined and cluttered 2D simulation environments we follow these steps: Step 1: Locate a victim randomly inside an empty search field. The victim is a combination of green cells (obstacle as its body), and blue cells (warm object as its head). We define three sizes for simulated victims (small, Medium, and Large). Step 2: We select a narrow restricted entrance in the corner (start point). Step3: We send in an Ant agent, at the entrance, to perform a random Brownian search to locate victim’s head (goal). The paths that agent takes to find the victim will be selected as free cells (white cells) and the remaining cells are selected as obstacles (e.g. rubbles inside the void). Step 4: Randomly change the victim’s location or size and go to step 3. We change the number of victims and robots from 1 to 3 and follow the steps above to generate various simulation environments. For instance we have 3 robots and one small victim, at least one mobile agent will find the victim thus the algorithm terminates immediately. All the paths taken by all the agents (was recorded as grey cells) will be considered as pathways and untouched free cells will become obstacles. In this case we might have multiple paths, which only one path leads to victim and others to dead ends (all the free cells are reach able by our agents). In result by generating different random numbers and running our random Ant algorithm we can generate various search paths (therefore various search fields) through our algorithmic map generation. Also we are able to increase the size of the search field (frame size) up to 10000 grid cells.
Un-explored cells
Pathway
Victim
Entrance
Fig. 2. An image of our simulation map (each cell: 100 mm x 100 mm)
Figure 2 shows an overhead (bird’s-eye-view) of an example environment. In search field development, Ant agents (for map generation) are not required to create any Brownian bridge. It only performs exploration task. In the next stage, testing generated fields, each search agent should
WCE 2009
Proceedings of the World Congress on Engineering 2009 Vol I WCE 2009, July 1 - 3, 2009, London, U.K. move inside the void from restricted entrance path to explore the unknown search environment, with its various branches in different lengths. Brownian motion is produced while the random steps taken by each agent are correlated in equally spaced spatial. Ant agent has been sent inside the developed fields, which has been generated by the ant agent itself. The average time steps that single agent takes to create Brownian Bridge in each field, has been recorded. Shortly, in this paper we investigate search field complexity index. This discriminative factor differentiates both pathways and obstacles located inside 101 confined life safe voids.! We will show that there is a correlation between this index and mobile Ant agent’s discovery time steps. V. FRACTAL DIMENSION
!
Fractal dimension [4] provides an objective means for quantifying the fractal properties of an object and distinct it from other fractals. One of the important characteristics of fractals is the concept of self-similarity. However for natural phenomena self-similarity refers to the statistical properties of the outline, trail or surface. Many natural phenomena, like discharges of rivers and outline forms of coastlines filled with seemingly complex irregular shapes and random variations [3]. In ecology several discriminative indices have been introduced that is able to differentiate landscape patterns. In this regard fractal dimension is an index of complexity of shapes on landscapes. For instance if the landscape is composed of simple geometric shapes its fractal dimension is small while for the landscape contains many patches with complex and convoluted shapes the fractal dimension is much larger. In literature fractal dimensions have been used in various applications to indicate fractal figure complexity [5]. Every fractal has a numeric fractal dimension that can be used to indicate fractal figure complexity. There are several methods to calculate fractal dimension. The box dimension method has used in various applications such as graphic image processing [13]. In Grid Method (Box-Counting) we superimpose a regular grid of cells of length δ (in our map: δmin=100 mm) on the object and count the number of occupied cells (ni) in every kind of cells. Therefore we follow the power law relationship defined by Voss et al to calculate the fractal dimension of our simulation map. Power–law relationship is: (3) n i (" ) = K" #D K is the total number of cells available on our map (image) of all kind. N (4) K = # n (" ) i
i=1
!
We have N kind of cells where ni is the number of individuals belonging to the ith types of cells ( i " I = {1,2,L,N} ) with the size of δ. Here we consider only two types of cells (occupied and free, N=2), and to estimate the fractal dimension of obstacles on the map, we calculate
!
ISBN: 978-988-17012-5-1
the noc (number of cells of length δ which are occupied on our map, either by victims or obstacles). Also we estimate the fractal dimension of pathways (path tortuosity). npath is the number of free cells inside our map that are used as pathways for agents. From equation (3) we can calculate fractal dimension (D) of our map as: logK " log n i (# ) D= = Log#
K ) n i (# ) log #
log(
(5)
D is a metric dimension; therefore its definition depends on metric scaling properties. Figure 3 illustrates the correlation between agent’s discovery time and fractal dimension. 101 simulated number of search fields (generated by our map generator) have been chosen to select the most suitable index for search terrain complexity. These environments are differentiated by their FDO (Fractal Dimension of Obstacles) and FDP (Fractal Dimension of Pathways). Fractal dimension, considering the obstacles, has a negative correlation to time steps (with little fluctuations), in other words to search field complexity. While between fractal dimensions, considering the pathways, and exploration terrains there is a positive correlation. In ascending order of a single ant discovery time, FDP is selected as our best discriminative index (with a less fluctuation) for the search field complexity. The larger is the FDP the more complex (for the random behaviour) is the generated search terrain.
Fig. 3. Fractal dimension of obstacles and pathways (one time step=36 sec.)
Each point (time steps) in our graphs (fig. 3) is the average of running the ant algorithm (random walk) 100 times. The default values in our experiments are: a map of 1089 (33×33) cells, and as discussed above we vary the environment according to their fractal dimension of pathways and obstacles. The number of the agents in this experiment was set as the best performance (in discovery time) for Ant algorithm. Thus we selected 3 agents to run the experiment. Our simulation tool (map generator) is based on the objected–oriented CLOWN formalism that controls the agent’s search technique performance in addition to search field development. In the result of this experiment we were convinced to deploy fractal dimension of path tortuosity in our map generator, this index is able to differentiate random
WCE 2009
Proceedings of the World Congress on Engineering 2009 Vol I WCE 2009, July 1 - 3, 2009, London, U.K. developed environments according to their complexity of their paths, since Brownian movement of our agents has developed them. FracLac [16] is image-analyze software, developed for image J tool. This tool is used for objectively analyzing complexity and heterogeneity as well as some other measures of binary digital images. It has a global binary grid scan option that applies box-counting technique over an image. This tool calculates the fractal dimension of our complex search environments as same as our presented mathematical procedure, it automatically calculates the most suitable δ value. Thus all users are able to produce the maps by our algorithmic approach and save their images as a binary image (zero for obstacles and 1 for pathways) and scan them by image J and it calculates their fractal dimension. Another index that we deploy in this paper is the power spectral density of random movement. By this index we are able to evaluate a benchmark that allows us to compare it with other search strategies. Furthermore our developed environments, with different fractal dimension, have been used to test other search algorithm (e.g. Tree search algorithm), which has been developed particularly for complex search fields (multi branch paths).
these data as our benchmark to compare it with the performances of our future developed search techniques. Figure 4 indicates the performance of ant algorithm (for three agents). Their performances have been tested on 101 search fields. Black dots on the graph indicate the average of running the ant algorithm (random walk) 100 times.
Fig. 4. Power spectral densities of developed search fields (one time step = 36 sec.)
The red lines indicate the maximum time steps and minimum time steps to discover the victim in each search field (error bars). The search fields are set according to power spectral in ascending order. As it is indicating Power spectral density has a negative correlation to time steps (discovery time). The larger is the power spectral the smaller is the time to discover the victim. Further more, in figure 5, we compared the estimated discovery time steps (continues black line) with average time steps that actually were taken by our ant agents (red doted line). From this result we are easily able to predict the average discovery time for the ant algorithm, according to search field power spectral density. We estimated the Hurst exponent for our Ant algorithm as H=0.82. Ant benchmark (discovery times according to pathways spectral density) will be automatically estimated for all the random developed search fields by our algorithmic map generator.
The fractal dimension of random movement is directly related to the Hurst exponent for a statistically self-similar data set. Power spectral densities characterize the random movements of mobile agents, which produce pathways for our simulation environments. Brownian motion has a spectrum of [14]: P( f ) = Kf "2 H "1 (6) Fractal dimension of a fractional Brownian motion is simply related to Hurst exponent (H): D = 2 " H We calculated the fractal dimension of our pathways, ! among 101 generated fields as: 1.12 " Dpath " 1.25 Brownian walks can be ! generated from a defined Hurst exponent. If the Hurst exponent is 0.5 < H < 1.0, the random walk will be a long !memory process. If we calculate the frequency according to Bernoulli’s theorem the probability of obtaining a particular outcome in a single trial if it is known to be P the relative frequency of occurrence of that outcome in a large number of trials converges to P. Therefore spatial frequency is defined as f = n path K The fractal dimension of pathways should be estimated as discussed before (section V). Figure 4 indicates that power spectral density of pathways is ! inversely proportional to agent’s time steps. We are able to calculate the Hurst exponent and provide some estimate of the amount of predictability in our noisy data set (i.e., random movement). Spectral density is proportional to
f " # , where
" = 2H + 1. For
H = 0 we have the spectrum of the 1 noise.
Time steps
VI. SPECTRAL DENSITY
Power Spectral Density
Fig. 5. Estimated and average power spectral densities (1 time step=36 sec.)
According to above figure when x " 0 then y " # , also when y " 0 then x " # , therefore we define an equation as
“ y = A ” to depict the estimated graph in figure 5. In a ! x Brownian movement of ant algorithm ! ! will be used as an concise explanation, that is how we are estimating the evidence to predict a data!set for our map generator. We use ! ! discovery time and deploying Ant algorithm as our ! f
!
!
ISBN: 978-988-17012-5-1
WCE 2009
Proceedings of the World Congress on Engineering 2009 Vol I WCE 2009, July 1 - 3, 2009, London, U.K. benchmark: 101.2 * H 82.4 discoverytime = = P( f ) P( f )
(7)
(Average of 100 runs of discovery times for each field) A = t Min *H dis cov erytime
!
The minimum average discovery time recorded for Ant algorithm is 101.2 time steps ( P( f ) " H ). This time step has considered in the numerator (part of our constant A). By inserting the P(f) of each search field inside above equation (7), its discovery time! by Ant Brownian movement will be estimated. We test basic Tree algorithm [17], an existed algorithm, on our agents inside the generated test fields. In this search technique we are expecting to speed up victim localization, comparing to our benchmark (Ant algorithm, random performance) in the modelled life safe voids inside collapsed buildings. The experiment setup is as the same as discussed before (same as Ant algorithm). However in Tree algorithm we changed the head of the victim randomly 10 times inside the search field (same field just 2 cells, head, were randomly moved) and we calculated the average time to find the goal. In non-random algorithms discovery time is highly dependent on goal’s state. While FDP value is independent of the goal’s position (counted as occupied cell, like obstacles). However fractal dimension is still a discriminative index to characterize our generated search fields. Tree search algorithm is a cooperative multi-agent technique. In future we introduce this algorithm in detail (outside the scope of this paper) and compare it with different novel search strategies developed by the author.
REFERENCES [1] [2] [3] [4] [5] [6] [7] [8] [9]
[10]
Time steps
!
areas) parts of NIST red course in a simulation environment. To develop these confined search terrains there is a discriminative index estimated in this paper. By deploying fractal path tortuosity, map generator is able to differentiate its random generated confined fields. In future we introduce our novel path planning for narrow pathways and small tunnels. This collaborative search technique will be tested in various complex and ambiguous test fields generated by our map generator. We compare our work to existing algorithms, as well as our evaluated benchmark, Ant algorithm, which is a well-known search technique for autonomous multi robots.
[11] [12] [13] FDO
Fig. 6. Tree search algorithm performances compared to benchmark (one time step = 36 sec.)
VII. CONCLUSION AND FUTURE WORK By learning new cooperative behaviours, multi-robot system is able to minimize the overall victim’s discovery time, inside the narrow gaps and small voids of a collapsed building. However there is no such a map generator available to generate various random after–disaster maps to allow researchers for detailed testing of their exploration techniques, prior to physical tests. We have discussed how to model the dangerous, cluttered and confined (challenging
ISBN: 978-988-17012-5-1
[14] [15]
[16] [17]
R.R Murphy, “Activities of the rescue robots at the world Trade Centre from 11-12 September 2001”, IEE Robotics and Automation magazine, 11(3): 851-864, September 2004. J.R. Krummel, R.H. Gardner, G. Sugihara, R.V. O’Neill, and P.R. Coleman. Landscape pattern in a distributed environment. 48:321324, Oikos,1987. P.A. Burrough, Fractals and geochemistry: In The Fractal approach to the chemistry of distorted systems, ed. By D. Avnir, Wiley and Sons, New York, 1988. B.B. Mandelbrot, The Fractal Geometry of Nature, Freeman, San Francisco, 1983. Voss, R.F. Fractals in nature: from characterization to simulation. In: Peitgen, H. -O. and D. Saupe (eds.) The science of fractal images pp. 21-70, Springer, New York, 1998 M. Dicke, and P.A. Burrough, “Using fractal dimension for characterizing tortuosity of animals”, Physiological Ecology, Physiol Entomol, 13,pp 393-398, 1988. A. Jacoff, E. Messina, and J. Evans, “A reference test course for autonomous mobile robots”, In proceeding of SPIE-AeroSense Conference, Orlando, FL, 2001. A. Schultz, The 2000 AAAI Mobile Robot Competition and Exhibition”, AI Magazine, 22(1), spring 2001, AAAI. A. Jacoff, E. Messina, B.A. Weiss, S. Tadokoro, and Y. Nakagawa, “Test arenas and Performance Metrics for Urban Search and Rescue Robots”, In proceeding of the IEEE/RS international conference on intelligent Robots and Systems, Las Vegas, NV, October 27-31,2003. M. Lewis, K. Sycara, and I. Nourbaksh, “Developing a Testbed for studying Human-Robot Interaction in Urban Search and rescue”, In proceeding of 10th International Conference on Human-Computer Interaction (HIC03), Crete, Greece, 2003. P.E. Merloti, and J. Lewis, “Simulation of artificial Ant’s Behavior in a Digital Environment”, in proceeding of international conference on Artificial Intelligence (ICAI05), Las Vegas, Nevada, USA, 2005. A.L. Jones, Image Segmentation via Fractal Dimension, Master theises, Dec. 1987. JP. Zhang, H. Barad, and A. Martinez, “Fractal Dimension of Fractional Brownian Motion”, IEEE Southeastcon '90,pp 934-939 vol.3, New Orleans Lousiana, 1990. Andrew W. Lo and A. Craig MacKinlay, Long-Term Memory in Stock Market Prices, Chapter 6 in A Non-Random Walk Down Wall Street by, Princeton University Press, 1999. A.W. Martin Voshell and D. D. Woods, “Overcoming the keyhole in human-robot coordination: Simulation and Evaluation”, Proceedings of the Human Factors and Ergonomics Society 49th Annual Meeting, 2005. http://rsb.info.nih.gov/ij/plugins/frac-lac.html, FracLac tool, accessed [10.06.2008]. N. Agmon, N. Hazn, and G. A. Kaminka, “Constructing spanning trees for efficient multi-robot coverage”, in ICRA06: Proceeding of the International Conference on Robotics and Automation IEEE press, 2006.
WCE 2009