SPIE Vol 5021, Storage and Retrieval for Media Databases, Santa Clara, 22-24 Jan. 2003.
An attention based similarity measure with application to contentbased information retrieval Fred W M Stentiford* UCL@Adastral Park, Martlesham, Ipswich, Suffolk, UK IP5 3RE
ABSTRACT Whilst storage and capture technologies are able to cope with huge numbers of images, image retrieval is in danger of rendering many repositories valueless because of the difficulty of access. This paper proposes a similarity measure that imposes only very weak assumptions on the nature of the features used in the recognition process. This approach does not make use of a pre-defined set of feature measurements which are extracted from a query image and used to match those from database images, but instead generates features on a trial and error basis during the calculation of the similarity measure. This has the significant advantage that features that determine similarity can match whatever image property is important in a particular region whether it be a shape, a texture, a colour or a combination of all three. It means that effort is expended searching for the best feature for the region rather than expecting that a fixed feature set will perform optimally over the whole area of an image and over every image in a database. The similarity measure is evaluated on a problem of distinguishing similar shapes in sets of black and white symbols.
Keywords: visual attention, saliency, similarity, metadata, content, CBIR, image retrieval, image analysis 1. INTRODUCTION The volume of digital images has increased dramatically in recent years and as a result a crisis is now taking place within a broad range of disciplines that need and use visual material. Whilst storage and capture technologies are able to cope with the huge numbers of images, poor image retrieval is in danger of rendering many repositories valueless because of the difficulty of access. These problems have motivated much research into content based image retrieval [1,2,3,4] and many commercial and laboratory systems are described in the literature [5-12]. It is the job of an image retrieval system to produce images that a user wants. In response to a user’s query the system must offer images that are similar in some user-defined sense. This goal is met by selecting features thought to be important in human visual perception and using them to measure relevance to the query. Colour, texture, local shape and layout in a variety of forms are the most widely used features in image retrieval. One of the first commercial image search engines was QBIC [5] which executes user queries against a database of pre-extracted features. VisualSEEk [8] determines similarity by measuring image regions using both colour parameters and spatial relationships and obtains better performance than histogramming methods that use colour information alone. NeTra [9] also relies upon image segmentation to carry out region-based searches that allow the user to select example regions and lay emphasis on image attributes to focus the search. Region-base querying is also favoured in Blobworld [7] where global histograms are shown to perform comparatively poorly on images containing distinctive objects. Similar conclusions were obtained in comparisons with the SIMPLIcity system [13]. The Photobook system [6] endeavours to use compressed representations that preserve essential similarities and are “perceptually complete”. Methods for measuring appearance, shape and texture are presented for image database search, but the authors point out that multiple labels can be justifiably assigned to overlapping image regions using varied notions of similarity. The system described by Kato [14] makes use of various features based on specific functions of pixel values such as run length frequencies, edge pixel counts, and local contrast values. The Star system [15] relies upon a manual process of segmentation into components before being represented as features based on Fourier descriptors, moment invariants, and projections. The ARTISAN [16] system bases similarity measures upon perceptually significant regions that are determined automatically. An initial segmentation stage breaks the image into components using standard-edge detection techniques. Each image is characterised for retrieval using a variety of features including edges, aspect ratio,
*
[email protected]; http://picard.ee.ucl.ac.uk/~fstentif
Page 1 of 12
SPIE Vol 5021, Storage and Retrieval for Media Databases, Santa Clara, 22-24 Jan. 2003.
right-angleness, and straightness. An example is given of how features designed for segmentation can be sensitive to irrelevant detail, and serves to illustrate the danger of relying upon pre-specified heuristics to identify similarities. Jain and Vailaya [17] employed colour histograms and edge direction histograms for image matching and retrieval. Other research using different techniques for image retrieval, but still firmly based upon a judicious choice of features for optimum performance, has been carried out by Kim [18]. These conventional approaches suffer from some disadvantages. Firstly there is a real danger that the use of any form of pre-defined feature measurements will preclude solutions in the search space and be unable to handle unseen material. Secondly the choice of features in anything other than a trivial problem is unable to anticipate a user's perception of image content. This information cannot be obtained by training on typical users because every user possesses a different subjective perception of the world and it is not possible to capture this in a single fixed set of features and associated representations. Analytical segmentation techniques are sometimes seen as a way of decomposing images into regions of interest and semantically useful structures [19]. However, object segmentation for broad domains of general images is considered difficult, and a weaker form of segmentation that identifies salient point sets may be more fruitful [2]. Relevance feedback is often proposed as a technique for overcoming many of the problems faced by fully automatic systems by allowing the user to interact with the computer to improve retrieval performance [20]. In Quicklook [21] and ImageRover [22] items identified by the user as relevant are use to adjust the weights assigned to the similarity function to obtain better search performance. PicHunter [23] has implemented a probabilistic relevance feedback mechanism that predicts the target image based upon the content of the images already selected by the user during the search. This reduces the burden on unskilled users to set quantitative pictorial search parameters or to select images that come closest to meeting their goals, but it does require the user to behave consistently as defined by the machine. Retrieval should not require the user to have explicit knowledge of the features employed by the system and users should not have to reformulate their visual interests in ways that they do not understand. This paper proposes a robust similarity measure that imposes only very weak assumptions on the nature of the features used in the recognition process. This approach does not make use of a pre-defined distance metric plus feature space in which feature values are extracted from a query image and used to match those from database images, but instead generates features on a trial and error basis during the calculation of the similarity measure. This has the significant advantage that features that determine similarity can match whatever image property is important in a particular region whether it be a shape, a texture, a colour or a combination of all three. It means that effort is expended searching for the best feature for the region rather than expecting that a fixed feature set will perform optimally over the whole area of an image and over every image in the database. By generating thousands of random features and applying them on a trial and error basis as an integral part of the calculation of the similarity value, it is shown that a consistent measure is obtained that is not dependent upon any one or group of specific pattern measurements or representative training sets. The similarity measure is applied to the problem of distinguishing similar shapes in a set of black and white symbols.
2. COGNITIVE VISUAL ATTENTION The model of Cognitive Visual Attention (CVA) described in this paper is a generalization of an earlier model of Visual Attention [24,25] and relies upon the similarity of pairs of neighbourhoods taken from patterns A and B. Let a set of measurements a on pattern A correspond to a location x in A in bounded n-space (x1, x2, x3, …, xn) where x = (x1, x2, x3, …, xn) and a = (a1, a2, a3, ... , ap) Define a function F such that a = F(x) wherever a exists. It is important to note that no assumptions are made about the nature of F eg continuity. It is assumed that x exists if a exists. Consider a neighbourhood Nx of x where {x' ∈Nx iff |xi - x'i| < εi ∀ i} Select a set of m random points Sx in Nx where Sx = {x'1, x'2, x'3, ..., x'm} and F(x'i) is defined. Select a location y corresponding to the set of measurements b on pattern B for which F is defined where |xi - yi|≤ ≤s
Page 2 of 12
SPIE Vol 5021, Storage and Retrieval for Media Databases, Santa Clara, 22-24 Jan. 2003.
Define the set Sy = {y'1, y'2, y'3, ..., y'm} where x - x'i = y - y'i and F(y'i) exists. The neighbourhood of x is said to match that of y if |Fj(x) - Fj(y)| < δj and |Fj(x'i) - Fj(y'i)| < δj
∀ i,j.
In general δj is not a constant and will be dependent upon the measurements under comparison ie. δj = fj(F(x), F(y)) In the case of two-dimensional visual patterns the CVA score of a pixel x in the pattern A should be high if a high proportion of randomly selected Sx match Sy for a fixed y in pattern B. 1
y x
Figure 1 Neighbourhood at location x matching at location y
The CVA score of a location x is incremented each time one of the set of M neighbourhoods Sx matches a neighbourhood Sy surrounding some y in pattern B. This means that pixels x in A that achieve large numbers of matches between a range of M neighbouring pixel sets Sx and pixel neighbourhoods around y in B are assigned high CVA scores. In Figure 1, m = 3 pixels x' are selected in the neighbourhood of a pixel x in pattern A and matched with 3 pixels in the neighbourhood of pixel y in pattern B. Each of the pixels might possess three colour parameters, so F(x') = a = (r, g, b) and the neighbourhood of the second pixel y matches the first if the colour parameters of all m + 1 corresponding pixels have values within δj of each other. A parameter s is introduced to limit the area in pattern B within which the location y is randomly selected. S=2 defines the dotted region in figure 1. This improves the efficiency of the algorithm in those cases where it is known that corresponding objects in the two images are shifted by no more than s pixels. In effect s represents the maximum expected mis-registration or local distortion between all parts of the two images. Some image analysis techniques carry out comparison calculations between images using patches that are contiguous neighbourhoods in which values from all the pixels are employed in the calculation. Patches match when a measure of correlation exceeds a certain threshold. This approach is unable to make best use of detail that is smaller than the size of the patch except in the case in which the correlation measure is designed to identify specific features. The random pixel neighbourhoods Sx described here do not suffer from this disadvantage.
1
It is worth noting that the Visual Attention score of pixel x in pattern A is high if Sx mismatches Sy and where y is not fixed but is randomly selected from pattern A. Whereas Visual Attention requires no memory of the content of other images (other than image A), CVA locates relevant information contained in pattern B to measure the degree of similarity.
Page 3 of 12
SPIE Vol 5021, Storage and Retrieval for Media Databases, Santa Clara, 22-24 Jan. 2003.
3. APPLICATION TO BLACK AND WHITE IMAGES In the case of black and white images F(x) = {0,1} and we take ε=0 so that a match occurs only if all m+1 pixels in a neighbourhood in A match exactly those in B. Define the CVA score of pattern A with respect to B as
C AB = ∑ (
∑ (1 | S matches S , 0 | otherwise) ∑ black pixels x
y
x∈ A M , y∈ B
A
CAB is normalised to be independent of image size. Furthermore the score is not incremented if any neighbourhood Nx contains solely black pixels because such Sx would tend to attach value to matching large expanses on black in A and B. It is worth noting that the CVA score does not possess the following properties: (i) CAB = CBA (ii) Dist(A,B) + Dist(B,C) ≥ Dist(A,C) (iii) Dist(A,A) = Dist (B,B) where Dist(A,B) = M – CAB However, to be useful the measure must satisfy Dist(A,B)>Dist(A,A) The measure does not satisfy self-similarity (iii) or the triangular inequality (ii) and is therefore not a metric. In practice there is no requirement for the triangle inequality to be satisfied in measures of human perception. A pattern B may contain components in common with A and C thereby generating high values of CAB and CBC, However, A and C may have no features in common at all and no conclusion regarding A and C can necessarily be inferred from the similarities of AB and BC (Figure 2).
Figure 2
Symmetry is also not a requirement as is seen for example, in the case of pattern A containing a circle and pattern B containing a circle and a square; it is reasonable that pattern A is more similar to B than B is to A because B contains A. It is also significant that although the measure of self similarity CAA will take a high value because the probability of matches between Sx and Sy will be highest for identical pairs of patterns, it will not necessarily obtain the same value for all patterns. However, the value of CAA will always be greater than CAB provided M is large enough. Tversky [26] showed that measures of similarity that conform to human perception do not satisfy the usual properties of a metric, such as the triangular inequality. He proposed a feature contrast model relevant to human perception, but still required a set of pre-specified features for its definition. The gain of the scoring mechanism is increased significantly by retaining the pixel location y if a match is detected, and reusing y for comparison with the next of the M neighbourhoods. It is likely that if a matching pixel configuration is generated, other configurations will match again at the same point, and this location y once found and reused, will accelerate the rise of the CVA score provided that the sequence is not subsequently interrupted by a mismatch. If however, Sx subsequently mismatches at that location, the score is not incremented, and an entirely new location y in pattern B is randomly selected ready for the next comparison. In this way competing locations in pattern B are selected against if they contain little commonality with the neighbourhood of x in pattern A.
Page 4 of 12
SPIE Vol 5021, Storage and Retrieval for Media Databases, Santa Clara, 22-24 Jan. 2003.
In addition efficiency may be further improved by exploiting potential continuity following a high CVA score at x = (x1, x2) in A after comparisons with y = (y1, y2) in B. For example, the first neighbourhood in B to be selected and compared with (x1+1,x2) would be (y1+1,y2) as it would be very likely that these would still be corresponding points from the same visual object in patterns A and B. The first few (typically init=20) comparisons during the calculation are not scored to give the process a chance to identify a high scoring location y in pattern B before the sequence of M comparisons is commenced. This strategy improves the gain of the score by removing non-scoring comparisons during the initial casting about for a matching location. If a perfectly similar location y is found during this initial stage all subsequent M comparisons will match and yield a maximum CVA score. The size of neighbourhoods is specified by the maximum distance (εi) of configuration components to the pixel in A being scored. The neighbourhood is compared with the neighbourhoods of M other randomly selected pixels in pattern B that are more than a distance epsilon from the boundary of the pattern. Typically εi = 2 and M = 50, with m = 3 neighbouring pixels selected for comparison. Larger values of s and the εi are selected according to the scale and distortion in the patterns being analysed. Increasing the value of M reduces the variability in the CVA scores.
4. CLUSTERING The CVA scores were computed for all pairs in a set of 100x100 pixel patterns. A number of clusters emerged and two examples are shown in Figure 3 with scores tabulated in Table 1.
Figure 3 Two pattern clusters [27]
Page 5 of 12
SPIE Vol 5021, Storage and Retrieval for Media Databases, Santa Clara, 22-24 Jan. 2003.
4 1 2 3 5 6 7 8 9 10 1 40.2 17.5 21.2 30.1 23.3 24.3 26.9 22.4 26.8 24.3 2 19.9 36.0 27.0 27.7 27.0 22.5 28.2 18.7 29.6 27.6 3 16.0 17.0 40.7 27.1 25.9 21.0 21.9 20.4 21.0 22.3 4 20.1 22.3 26.7 41.4 26.6 25.6 25.6 20.3 27.0 22.2 5 19.5 20.6 26.8 28.7 38.5 22.2 23.4 20.3 22.8 22.4 6 19.9 18.8 24.3 29.1 23.0 40.1 23.8 27.9 24.7 22.5 7 26.7 21.0 23.6 27.7 24.6 21.5 35.3 27.9 32.0 27.8 8 28.1 21.4 25.0 27.8 25.0 23.3 30.6 37.6 32.1 26.8 9 26.4 22.2 24.1 28.5 25.3 24.2 31.2 29.6 36.3 27.3 10 27.2 22.1 27.8 29.2 27.7 25.0 30.6 27.1 31.2 38.8 Sum 203.8 182.9 226.5 256.0 228.2 224.6 242.3 214.7 247.1 223.2
1 2 3 4 5 6 7 8 9 10 11 12 13 14 15 16 17 18 19 20 Sum
1 41.0 28.7 30.7 35.2 28.4 29.3 32.5 27.7 30.3 26.3 31.8 29.1 26.5 27.6 27.1 29.4 29.8 27.7 28.3 28.6 555.1
2 27.3 40.3 27.1 28.7 26.2 27.9 27.6 27.2 29.0 25.7 28.9 28.9 25.8 27.1 24.8 30.5 26.2 26.3 23.9 25.0 514.2
3 31.5 29.5 41.5 33.2 31.9 30.3 32.6 29.8 36.1 29.2 37.4 30.1 29.5 29.8 31.0 33.2 31.9 30.6 31.6 32.2 601.3
4 33.4 26.3 27.9 42.1 25.4 29.6 33.1 25.8 28.3 26.7 28.8 28.8 21.6 27.4 26.9 26.5 28.5 24.7 27.3 25.6 522.4
5 29.0 29.2 31.4 30.6 41.0 31.0 30.4 29.7 34.3 28.6 35.6 28.6 26.3 26.1 28.5 29.4 30.3 31.1 29.0 28.4 567.8
6 31.9 29.9 30.6 36.2 31.7 41.5 36.5 30.1 30.6 32.4 30.9 30.1 26.7 31.5 27.5 31.4 29.0 31.8 24.4 26.7 579.7
7 32.0 29.9 33.5 36.6 30.9 35.2 44.7 29.7 31.5 30.3 33.1 30.8 28.2 28.9 29.4 34.3 29.9 29.0 28.3 32.6 593.9
8 31.2 30.2 30.8 33.5 29.2 30.6 31.2 39.4 34.5 29.5 34.4 32.3 28.3 27.8 28.4 31.3 28.9 29.5 26.6 29.0 577.2
9 28.3 28.2 30.8 28.3 29.5 26.8 27.1 30.6 42.1 26.4 32.3 27.3 24.5 24.3 29.4 28.0 26.5 29.1 24.5 25.8 527.7
10 28.8 26.4 29.8 32.4 29.3 33.9 31.5 27.8 32.2 40.3 31.6 26.5 24.1 28.2 27.0 28.8 26.5 26.5 21.0 27.4 539.6
11 31.7 30.8 34.8 33.3 33.8 29.5 31.3 31.4 35.3 29.0 42.6 30.2 27.8 27.6 29.7 31.6 32.0 29.5 33.1 31.6 594.0
12 29.8 29.9 29.7 33.4 26.6 28.1 31.1 28.9 29.6 26.4 29.6 38.9 28.6 29.4 25.3 29.1 28.8 27.3 24.7 27.4 543.7
13 25.7 25.4 29.9 26.3 23.3 24.5 26.1 21.7 26.5 21.6 25.5 30.5 40.3 27.9 28.6 26.1 23.7 24.0 25.9 28.4 491.7
14 22.4 22.7 24.0 24.3 19.6 27.3 24.2 22.5 20.2 23.0 21.1 23.5 23.2 43.4 19.3 20.9 29.4 25.1 25.5 23.4 441.7
15 30.0 27.7 32.1 30.4 29.2 27.1 30.0 28.9 35.5 27.4 32.6 28.6 26.8 24.6 41.6 29.6 28.7 28.1 25.9 26.8 549.9
Sum 216.7 228.2 192.5 216.4 206.7 254.1 232.8 240.0 238.8 247.8
16 27.9 26.0 29.1 30.1 25.0 26.6 29.6 25.9 28.1 25.1 29.0 26.2 25.1 24.9 26.8 41.6 26.2 26.6 24.7 26.0 509.0
17 24.3 23.5 24.5 26.3 24.6 23.6 22.4 21.2 21.2 21.1 24.6 22.5 20.3 24.9 22.7 21.9 38.6 27.8 31.1 27.1 455.7
18 26.6 26.5 28.1 28.0 28.8 28.1 26.0 26.6 30.3 25.1 27.5 27.5 24.5 28.2 25.4 27.9 31.4 39.2 26.8 28.0 521.4
19 24.1 21.4 24.7 24.2 23.1 20.7 21.7 20.6 20.5 18.5 25.3 20.4 20.5 22.9 21.4 19.5 32.9 26.0 43.9 28.0 436.5
20 29.2 27.1 31.2 30.4 27.0 26.8 31.2 27.4 27.8 25.5 29.5 28.4 29.1 27.1 25.2 27.7 32.4 30.7 31.8 39.3 545.4
Sum 544.9 519.4 560.7 581.5 523.5 537.0 556.1 513.5 561.8 497.9 569.4 530.0 487.6 516.2 504.4 536.9 553.1 531.4 514.4 528.1
Table 1 Pattern similarity scores for two pattern sets
In all cases the self similarity score CAA is greater than CAB for all B≠A. The greatest sum maxi(∑jCij) of the scores in each row indicates the pattern that is the most similar to the others (pattern 6 in set 1), and the highest column sum maxj(∑iCij) indicates the pattern to which most other patterns are the most similar (pattern 4 in set 1). The asymmetry of the CVA score is apparent from the fact that the pattern that is closest to the others is not the same as the pattern to which the others are closest. In this case pattern 4 can be considered the ‘centre’ of the cluster when judging whether new patterns are members of the same group. The similar concept of ‘vantage’ patterns has been used for efficient image retrieval in work by Vleugels et al [28]. Candidate patterns would be members of the cluster if the CVA scores with pattern 4 were greater than the minimum score already in the cluster (pattern 3 score = 27.1). By the same token pattern 3, being the most peripheral pattern in the cluster, would be the first member to be displaced. Overlaps between clusters are determined by an arbitrary threshold and the degree of commonality between patterns and cluster centres. In this case pattern 10 in cluster 1 is pattern 17 in cluster 2.
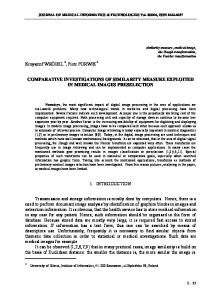
Figure 4 Similarity arrays for patterns 1 and 4 when compared with each other
Page 6 of 12
SPIE Vol 5021, Storage and Retrieval for Media Databases, Santa Clara, 22-24 Jan. 2003.
Figure 4 illustrates the strengths of the similarity scores for each pixel in pattern 1 when compared with pattern 4, and pattern 4 when compared with pattern 1, where higher scores are indicated by darker grey levels. The vertical and horizontal edges contribute most to the respective overall similarity scores, however, the large central area in pattern 4 fails to match with pattern 1 which leads to a lower score (20.1) than in the reverse direction (30.1). This example clearly demonstrates the asymmetry in the CVA similarity measure.
5. EVALUATION The effects of translation, rotation, scaling and noise on the CVA score are illustrated by transforming pattern 5 in cluster 1 in various ways and observing changes in the score relative to the centre of the cluster (pattern 4). It is then possible to identify the level of distortion which causes the pattern to move outside the bounds of the cluster. The parameter values used throughout were M=50, m=3, ε=2, init=20, s=7 unless stated otherwise. 5.1 Translation Six versions of pattern 5 were generated by a series of 5 pixel upward shifts. These were scored against pattern 4 for a range of values of the parameter s (Figure 5). The scores remained sufficiently high (>27.1) for pattern 5 to remain in the cluster provided the magnitude of the translation did not exceed the size of s. 5.2 Rotation The scores of pattern 5 rotated in 1° increments are shown in Figure 6. Pattern 5 leaves the cluster after a rotation of between 4° and 5°. The scores then decrease fairly continuously until 45° and then rise again towards 90° where the square shape of pattern 5 aligns again with pattern 4. 5.3 Scaling Pattern 5 was reduced in size in 5% increments down to 50%. Scores were generated for s=7,10,15 (Figure 7). Scores were approximately the same for each value of s until the scale reduction gave rise to an effective shift for a substantial number of corresponding pixels that exceeded the value of s. With s=15, a 75% reduction in size still left pattern 5 within the cluster (using values in Table 1 recalculated for s=15). 33 31 29 s=7 s=10 s=15 s=20 s=25 s=30
score
27 25 23 21 19 17 15 0
5
10
15
20
25
30
vertical shift Figure 5 Translated pattern scores
Page 7 of 12
SPIE Vol 5021, Storage and Retrieval for Media Databases, Santa Clara, 22-24 Jan. 2003.
29.0 27.0 23.0 21.0 19.0 17.0 15.0 1 7 13 19 25 31 37 43 49 55 61 67 73 79 85 91 rotation (degrees) Figure 6 Rotated pattern scores
35.0 30.0 25.0 score
Score
25.0
s=7 s=10 s=15
20.0 15.0 10.0 5.0 0.0 100
95
90
85
80
75
70
65
60
55
50
% reduction Figure 7 Scaled pattern scores
Page 8 of 12
SPIE Vol 5021, Storage and Retrieval for Media Databases, Santa Clara, 22-24 Jan. 2003.
5.4 Noise Various categories of noise were applied to pattern 5 to determine the effect on scores. First a succession of Gaussian blurs were applied followed by thresholding. Rather surprisingly the scores improved to a peak at two blurrings and all the distorted patterns remained within the cluster - Figure 8. In this case the blurring process smoothed some of the edges which led to better matches with pattern 6 and higher scores in these regions.
35 34
32 31 30 29 28 0
1
2
3
4
5
6
blur level Figure 8 Blurred patterns
35 33 31 29 score
score
33
27 25 23 21 19 17 15 0
1
2
3
4
5
6
noise level Figure 9 Effect of additive noise on scores
Page 9 of 12
SPIE Vol 5021, Storage and Retrieval for Media Databases, Santa Clara, 22-24 Jan. 2003.
Next additive noise was applied and again an improvement was obtained – Figure 9. Three levels of noise were applied before pattern 5 left the cluster. The white noise pixels enabled the CVA score to operate over what should have been unscored expanses of black in pattern 5 and gave rise to an increase in score following the first application of noise. Finally pattern 5 was subjected to increasing levels of structural distortion and the resulting scores are displayed in Figure 10. Pattern 5 leaves the cluster after four successive distortions.
30 29
score
28 27 26 25 24 0
1
2
3
4
5
6
distortion level Figure 10 Structural distortion
6. CONCLUSIONS The CVA similarity measure has been tested on very small sets of patterns and further investigations are planned on larger datasets in other applications. The measure enables associations to be set up between regions within sets of patterns that reflect their degree of similarity and thereby exposes a clustering structure within the data which can be usefully employed during retrieval. Experiments indicated that the measure is robust and capable of identifying similarities despite distortions arising from translation, rotation, scaling and other disturbances. Bounds on the magnitude of the distortions influences the volume of computation (M) required to obtain consistent results. Increasing the value of the relative shift parameter s allows similar regions in different patterns to be related, but at the expense of more computation. The approach avoids the use of intuitively designed features that are normally selected to characterise the space of solutions being analysed. Moreover no filters or normalisation processes are employed. This strategy therefore does not preclude solutions that would have been chosen had a different set of feature measurements or filters been chosen. Instead features are selected during the measurement of similarity and may vary across images and across databases according to their performance. In a similar manner the distance measure used is not constrained by axioms of symmetry or the triangle inequality to behave in a way that is inconsistent with experience. Although only black and white patterns have been investigated in this paper, the approach is being applied to colour images with the added scope of a richer source of visual data in which to detect similarities.
Page 10 of 12
SPIE Vol 5021, Storage and Retrieval for Media Databases, Santa Clara, 22-24 Jan. 2003.
Acknowledgements are due to BTexact Technologies for their support in this work and to Oh Wee Jun from the National University of Singapore for implementing the algorithms and user interface for the development system.
REFERENCES 1 2 3 4 5 6 7 8 9 10 11 12 13 14 15 16 17 18 19 20 21 22
Y. Rui, T. S. Huang, and S. F. Chang, “Image retrieval: current techniques, promising directions and open issues,” Journal of Visual Communication and Image Representation, Vol 10, No 1, pp39-62, March 1999. A.W.M. Smeulders, M. Worring, S. Santini, A. Gupta and R. Jain, “Content-Based Image Retrieval at the End of the Early Years,” IEEE Trans PAMI, Vol 22, No 12, pp 1349-1379, December 2000. C. C. Ventners and M. Cooper, “A review of content-based image retrieval systems,” JISC Technology Applications Programme, http://www.jtap.ac.uk/reports/htm/jtap-054.html. R. C. Veltkamp and M. Tanase, “Content-based image retrieval systems: a survey,” March 2001, http://www.aa-lab.cs.uu.nl/cbirsurvey/cbir-survey/. M. Flickner, H. Sawhney, W. Niblack, J. Ashley, Q. Huang, B. Dom, M. Gorkani, J. Hafner, D. Lee, D. Petkovic, D. Steele, and P. Yanker, “Query by Image and Video Content: The QBIC System,” IEEE Computer, 1995. A. Pentland, R. W. Pickard, and S. Sclaroff, “Photobook: Content-Based Manipulation of Image Databases,” SPIE Storage and Retrieval of Images and Video Databases II, No 2185, Feb 6-10, San Jose, 1994. C. Carson, S. Belongie, H. Greenspan, and J. Malik, “Blobworld: Image Segmentation using ExpectationMaximisation and its Application to Image Querying,” IEEE Trans. Pattern Analysis and Machine Intelligence, Vol 24, No 8, pp 1026-1038, August 2002. J. R. Smith and S-F. Chang, “VisualSEEk: a fully automated Content-Based Image Query System,” Proc. ACM Int. Conf. Multimedia, pp 87-98, Boston MA, November 1996. W-Y. Ma and B. S. Manjunath, “NeTra: a Toolbox for Navigating Large Image Databases,” Multimedia Systems, Vol 7, pp 184-198, 1999. A. Gupta and R. Jain, “Visual Information Retrieval,” Communications of the ACM, Vol 40, No 5, pp 70-79, May 1997. J. Dowe, “Content Based Retrieval in Multimedia Imaging,” Proc SPIE Conf. Storage and Retrieval for Image and Video Databases, 1993. J. Bach, C. Fuller, A Gupta, A. Hampapur, B. Gorowitz, R. Humphrey, R. Jain, and C. Shu, “Virage image search engine: an open framework for image management,” Proceedings of the SPIE, Storage and Retrieval for Image and Video Databases IV, San Jose, CA, pages 76-87, February 1996. J. Z. Wang, J. Li, and G. Wiederhold, “SIMPLIcity: Semantics-Sensitive Integrated Matching for Picture LIbraries,” IEEE Trans on Pattern Analysis and Machine Intelligence, Vol 23, No 9, pp 947-963, September 2001. T. Kato, “Database architecture for content-based image retrieval,” in Image Storage and Retrieval Systems (Jambardino A and Niblack W eds), Proc SPIE 2185, pp112-123, 1992. J. K. Wu, C. P. Lam, B. M. Mehtre, Y. J. Gao, and A. Narasimhalu, “Content-based retrieval for trademark registration,” Multimed Tools Applic, 3, pp 245-267, 1996. J. P. Eakins, J. M. Boardman, and M. E. Graham, “Similarity retrieval of trademark images,” IEEE Multimed, 5(2), pp 53-63, 1998. A. K. Jain and A. Vailaya, “Image retrieval using color and shape,” Patt Recogn, 29(8), pp 1233-1244, 1996. Y. S. Kim, Y. Kim, W. Kim and M. Kim, “Development of content-based trademark retrieval system on the world-wide web,” ETRI J, 21(1), pp 39-53, 1999. J. Fan, M. Body, X. Zhu, M-S. Hacid, and E. El-Kwae, “Seeded Image Segmentation for Content-Based Image Retrieval Application,” Proc SPIE, Storage and Retrieval for Media Databases, 2002. Y. Rui, T. S. Huang, M. Ortega, and S. Mehrotra, “Relevance Feedback: A Power Tool for Interactive Content-Based Image Retrieval,” IEEE Trans on Circuits and Video Technology, pp 1-13, 1998. G. Ciocca and R. Schettini, “A multimedia search engine with relevance feedback,” Proc SPIE, Vol 4672, San Jose, 20-26 Jan, 2002. L. Taycher, M. La Cascia, and S. Sclaroff, “Image digestion and relevance feedback in the ImageRover WWW search engine,” Proc. 2nd Int. Conf. on Visual Information Systems, San Diego, pp 85-94, December 1997.
Page 11 of 12
SPIE Vol 5021, Storage and Retrieval for Media Databases, Santa Clara, 22-24 Jan. 2003.
23 24 25 26 27 28
I. J. Cox, M. L. Miller, T. P. Minka, T. V. Papathomas, and P. N. Yianilos, “The Bayesian image retrieval system, PicHunter: theory, implementation, and Psychophysical experiments,” IEEE Trans. On Image Processing, vol 9, No 1, January 2000. F. W. M. Stentiford, “An estimator for visual attention through competitive novelty with application to image compression,” Picture Coding Symposium, Seoul, 24-27 April, 2001. F. W. M. Stentiford, N. Morley and A. Curnow, “Automatic identification of regions of interest with application to the quantification of DNA damage in cells,” Proc SPIE Vol 4662, San Jose, 20-26 Jan 2002. A. Tversky, “Features of similarity”, Psychol Rev, 84(4), pp 327-352, 1977. A. Frutiger, Signs and Symbols, Ebury Press, London, 1997. J. Vleugels and R. C. Veltkamp, “Efficient image retrieval through vantage objects,” Pattern Recognition, vol 35, pp 69-80, 2002.
Page 12 of 12