An Automatic Threshold-Based Scaling Method for. Enhancing the Usefulness of Tc-HMPAO SPECT in the. Diagnosis of Alzheimer's Disease. Pankaj Saxena I ...
An Automatic Threshold-Based Scaling Method for Enhancing the Usefulness of Tc-HMPAO SPECT in the Diagnosis of Alzheimer's Disease Pankaj Saxena I, Dan G. Pavel 2, Juan Carlos Quintana 3 and Barry Horwitz 4 I Biomedical Visualization Laboratory, Department of Neurosurgery, University of Illinois at Chicago, 912 S. Wood Street, Chicago, IL 60612 2Nuclear Medicine, Department of Radiology, University of Illinois at Chicago. 3 Catholic University, Santiago, Chile 4 Laboratory of Neurosciences, National Institute of Aging, NIH, Bethcsda, MD 20892
Abstract. Functional imaging of the brain can aid in the diagnosis of Alzheimer's disease. Tc-HMPAO SPECT is widely available and relatively inexpensive to use. Combined with computer-based analysis of images, SPECT is a powerful tool in detecting decreases in brain perfusion caused by AIzheimer's disease. However, analysis can falsely elevate the perfusion of normal areas and diminish the perfusion of atrophic areas in the Alzheimer's brain when used with conventional scaling methods. In this paper, we present a technique for scaling images that overcomes the problems associated with conventional scaling methods. Our technique was successful in eliminating or attenuating the false increases in pcrfusion shown in probable AIzheimer's patients in over 90% of cases (n=17), and in enhancing the sensitivity of detection of degenerative changes by Statistical Parametric Mapping.
1
Introduction
Alzheimer's Disease (AD) is typically diagnosed through a process of exclusion [1]. A diagnosis of probable AD is made after excluding other possibilities in the differential diagnosis of dementia. Since the process of diagnosing AD is complex, and sometimes uncertain, there is a need for new tools and techniques that can aid in diagnosis, especially in its early stages, when the most benefit can be derived from drugs that may slow the progression of the disease. Imaging is a relatively simple, non-invasive procedure that can provide useful structural and functional information about the brain. Anatomically, AD is characterized by the degeneration of cortical and subcortieal structures. This is accompanied by a reduction in brain volume [2], which occurs globally, but is somewhat more marked in structures particularly affected by AD, such as the hippocampus, temporal and parietal lobes, and
624
amygdala [2]. Functionally, AD is characterized by a reduction in cerebral metabolism, selectively targeting areas such as the posterior parietal, temporal and frontal cortex, while often sparing the primary sensorimotor and occipital cortex [3]. This reduction in metabolism is correlated with a decrease in blood supply to the affected areas of the brain, and usually appears before structural changes are observed [3]. Functional imaging techniques such as Positron Emission Tomography (PET) and Single Photon Emission Computed Tomography (SPECT) can detect changes in regional metabolism and blood flow. However, it is often difficult to distinguish the changes that accompany AD from normal aging, and from other causes of dementia and degeneration.
1.1
FunctionalImagingin Alzhelmer's Disease
PET has been used to study the reduction of cerebral metabolism in AD [8]. Because of the limited availability and high cost of PET, attention has focused on SPECT to provide a low cost alternative to PET. SPECT provides data on regional blood flow that correlates with the metabolic data provided by PET in patients with AD, such as decreases in blood flow to temporo-parietal areas [3], and is considered a useful tool to aid in the diagnosis of AD [9, 10]. Some investigators have found that the degree and extent of decreased cerebral blood flow correlates with severity [12] of AD. The synergistic use of SPECT with other imaging modalities adds a new dimension of anatomical-functional correlation, and is likely to further enhance the usefulness of SPECT in AD [11]. Computer-based techniques can extend the usefulness of SPECT. Statistical Parametric Mapping (SPM) [13] is a univariate approach based on the general linear model. A tstatistic is calculated in parallel for each voxel, and an image of this statistic is assembled (the SPM(t) map), which is transformed to a Gaussian Field (the SPM(Z) map). Regional variations of SPM(Z) can be used for statistical inference based on distributional approximations derived from the theory of Gaussian Fields. Corrected p-values can be calculated for clusters of voxels exceeding some given threshold [13, 14]. Although initially developed for PET and subsequently JMRI, SPM has been successfully adapted for SPECT [18]. We have previously used SPECT to evaluate motor activation, diamox and balloon occlusion tests, as well as paroxysmal psychiatric events. Voxel intensities in SPECT images represent perfusion levels in the brain. There are several sources of variation among SPECT scans. Global variations may be caused by differences in the dose of radioactive tracer, scanner sensitivity, or the positioning of the head in the scanner. Local variations may occur normally as differences among patients, or within the same patient at different times, and/or as the result of brain pathology. These differences must be accounted for in order for statistical comparisons to be made, and is typically done by scaling the images to each other, or to some standard.
625
SPM provides several models to do the scaling. ANCOVA assumes a local linear model, for a small range of global values of CBF. It assumes that variance is constant, and that activations are additive. Therefore, ANCOVA best models the local non-linear relationship between regional CBF and global CBF, in the absence of sources of global variance and gross pathology. The proportional model (followed by ANOVA) assumes that there is a proportional relationship between global and regional changes, that is, activations are proportional to the underlying global blood flow, and that the variance increases with global CBF. If global counts vary greatly due to scanner sensitivity or dosage, and noise increases proportionally with the signal, the proportional sealing model is appropriate.
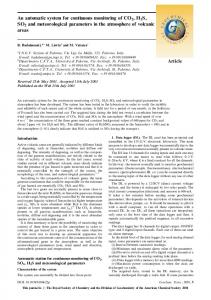
Figure 1: Histograms showing the global distribution of voxel intensities in (A) control image, and (B) image from an AD patient. Both images are normalized to Talairach space (see Methods section below) and represent approximately identical volumes. The images were thresholded at a number proportional to their global means in order to remove extra-cerebral voxels and the highest voxels were scaled to a value of 500. The marked flattening of the peak in the AD image indicates a reduced blood supply to cortical areas.
We use SPECT to diagnose Alzheimer's patients by comparing their scans to those of a control group. The decrease in blood flow in AD is large enough to depress the global mean of voxel intensities (rCBF equivalent) significantly below the control group, making ANCOVA a poor choice for scaling, since it assumes that there is little or no global variance. The proportional scaling model is also inappropriate, because it scales the global means of the images to each other. Since the global mean of the AD images is depressed, these images are scaled up to match the global means of the controls. This scaling-induced elevation of counts in the AD images has unfortunate effects. First, areas which had normal counts before the scaling (areas that are generally spared by AD, such as the primary sensorimotor cortex) are scaled up to an extent that they appear as "better than normal perfusion" areas in the SPM results. Second, the sealing-induced global elevation of counts in AD also affects areas that show atrophy from the disease. Scaling up these areas produces a loss of sensitivity seen when the AD images are subtracted from the controls.
626 It has been suggested that in PET images [19], the problems of these scaling methods can be avoided by choosing areas unaffected by the disease to do a proportional scaling. An average calculated from such unaffected areas should be resistant to the false hyperperfusion and loss of sensitivity seen with SPM-based proportional scaling. Since selecting "normal" areas manually is a time-intensive and subjective process, we developed a method to automatically scale the images based on normal areas for the routine evaluation of SPECT images from AD patients.
2
Methods
SPECT images of 17 patients with a clinical diagnosis of probable AD, and 17 controls were taken according to the protocol described below: For each patient or control, rCBF was assessed with technetium-99m-D L-hexamethylpropylene amine oxime (Tc-99m HMPAO), a lipophilic radiotracer that readily crosses the blood brain barrier after IV injection, and is trapped inside the brain in proportion to blood flow. Images were acquired using a triple-head camera system (Picker Prism 3000XP). Each camera head is equipped with a low-energy ultra-high-resolution fan beam collimator. Raw projection images were acquired in a 128x128 matrix using a protocol with 5 rapid acquisition scans; each with 40 steps per camera head at 7 seconds per step, for a total acquisition time of 23.3 minutes. The summed data was reconstructed using a Parzen filter, and the resulting transverse slices post-filtered using a low-pass (order=6, cutoff=0.26) filter. An attenuation correction map was applied to the filtered data sets, and orthogonal slices were obtained in preparation for SPM-based analysis. After doing a roll-yaw correction on a single scan, all other scans were aligned to it using the Automated Image Registration (AIR) program [ 15]. A subsequent alignment was repeated in SPM95 [16], following which the images were edited to remove the skull and extra-cerebral tissues. This is necessary in SPECT Tc-HMPAO images since scalp/skull are promincnt, and will affect the subsequent normalization unless they are removed. In order to compare images from different subjects, all images were then normalized in SPM95 to the standard anatomical space described by Talairach and Tournoux [17]. A smoothing kernel (FWHM 20x20x12) was applied to the normalized images (which had anisotropic voxcls, larger along the z-axis. These images were scaled as described below: 1. The average of the top 1% (in terms of intensity) voxels for each image was calculated in our control and AD groups. Our assumption was that the voxels with the highest intensities (denoting highest levels of perfusion) would be in those areas that are relatively unaffected by AD. 2. Every voxcl in each image was divided by the top 1% average for that image. 3. In order to retain more significant digits, we multiplied all voxels by a factor of 100.
627 4. These scaled images were provided to SPM95 for analysis using a single-subjectreplication-of-conditions design. SPM(Z) statistics were calculated using different thresholds and a p-value of 0.05 was chosen as statistically significant. We experimented with other levels of averaging, ranging from the top 30% average to the top 0.25% average. Results continued to improve on both contrasts (in terms of attenuating the false increase in contrast A and sensitizing contrast B) as we progressed from 30% towards 0.25%. The 0.5% and 0.25% averaging did not consistently improve results compared to the 1% averaging. Because of this, and because we suspected that outliers might exert a substantial effect on averages taken from a small number of voxels, we picked 1% as the standard. We plotted frequency histograms of the voxel intensities for each image (Figure 1). We were able to distinguish between a normal and an AD-type frequency distribution of voxel values. The AD histogram is characterized by a flattening of the peak in the upper-middle range, which represents degenerated cortical areas. Of our 17 probable AD patients, 4 did not show this characteristic flattening of the peak. The numbers for kurtosis and skewness showed that of these 4 probable AD patients, 3 were intermediate between the control and probable AD group, while one was indistinguishable from the control group.
3
Results
We compared results of processing a clinically diagnosed probable AD patient with and without our scaling procedure. Figure 2 illustrates the different types of scalings.
Figure 2: SPM(Z) maps comparing an AD patient to the control group using ANCOVA type scaling (A) & top I% averaging (B). Contrast I shows areas that are better perfused in the AD patient than the controls. Contrast 2 shows areas with reduced perfusion in AD compared to the control group.
628
We fused the SPM image maps to a Talairach-normalized, co-registered MR image in order to better locate the affected areas (Figure 3). Visual inspection of the SPECT images, which shows no significant increase in perfusion on the left side in the areas corresponding to the hot spots in Figure 3 (A(I)), supports the conclusion that the areas eliminated by our top 1% average scaling method were false positives. The second contrast (areas that are less perfused in the AD patient compared to the control group) underestimates, in most cases, the extent and significance of the affected areas. Of the 17 patients in the Alzheimer's group, 9 showed elimination, and 5 an average 80% attenuation of the false positive effect in Contrast A. These patients also showed an average 70% increased sensitivity in Contrast B when using our top 1% average scaling. Three patients showed a minor improvement in contrast A, but no gain in sensitivity in contrast B.
Figure 3: SPM processing results superimposed on patient's MRI. The slices are displayed in the Radiological Convention (Left is Right). Images on the left (Contrast A) show areas better perfused in the patient than the controls, according to ANCOVA [A(1)'] and 1% averaging [A(2)]. The areas found in the ANCOVA processing are mainly located in the subcortical region, sensorimotor areas, and cerebellum. While these areas are indeed least affected in AD, they are unlikely to be better in the AD patient than the control group. Images on the right (Contrast B) show areas with less perfusion in the patient than in the controls, according to ANCOVA [B(I)] and 1% averaging [B(2)]. The areas most affected are located in the right parieto-temporal area and, to a lesser extent, in the left parietal region. These areas are typically affected by Alzheimer's disease.
4
Discussion
Our scaling method appears to be effective in countering the effects of globally decreased counts seen in AD patients processed with SPM. In the majority of cases, it attenuated or eliminated the false positive effect of better-than-control pcrfusion in AD patients, and significantly increased the sensitivity in terms of number of voxels affected and/or their associated Z-value in detecting the perfusion deficits in AD patients. In eases where the top 1% averaging method failed to produce any improvement over the ANCOVA processing results in contrast B, we found that the histograms of the AD patient's data resembled our control group more than they resembled the other AD patients. The arithmetic of scaling indicates that there is no advantage to scaling to the top 1% average rather than the global average in these cases. In other words, the patient's image is scaled up approximately equally in both cases. This indicates that either (1) the global
629
average for these patients is not as depressed as it is for the other AD patients, and/or (2) the top 1% average for these patients is more depressed for these patients than for the other AD patients, relative to the control group. Since the top 1% pixels represent the areas that are generally spared by AD, (1) above is the more likely explanation. This is further supported by the fact that histograms of their image data resemble the control group more than they resemble other Alzheimer's patients, and by the actual values of the global averages, which are unusually high. It is possible that these patients represent an atypical presentation of AD, or misdiagnosis. In principle, this type of scaling should be useful for any pathological state which involves a substantial decrease in peffusion, such as other types of cerebral degeneration and large focal deficits caused by infarction or trauma. We are presently evaluating the utility of this technique in such eases. The differential diagnosis of probable AD requires an extension of this method to a large group, and further correlation with definite cases of AD.
References 1. 2. 3. 4. 5. 6.
7.
Murden, R.A.: The diagnosis of Aizheimer's Disease. Adv. Exp. Med. Biol. 282 (I 990) 59-64 Fox, N.C., Freeborough, P.A,, and Rossor, M.N.: Visualization and quantification of rates of atrophy in Alzheimer's Disease. Lancet. 348 (1996) 94-97 Mayberg, H.S.: Clinical correlates of PET- and SPECT-identified defects in dementia. J. Clin. Psychiatry. 55 (i 994) Supplement i 2-2 I Frccborough, P.A., Woods, R.P. and Fox, N.C.: Accurate registration of serial 3D MR brain images and its application to visualizing change in neurodegenerative disorders. J. Comp. Assisted Tomography. 20(6) ( ! 996) 1012-1022 Freeborough, P.A., and Fox, N.C.: The boundary shift integral: An accurate and robust measure of cerebral volume changes from registered repeat MRt. IEEE Trans. Med. lmag. 16(5) (1997) 623-629 Fox, N.C. and Freeborough, P.A.: Brain atrophy progression measured from registered serial MRi: validation and application to Alzheimer's Disease, J. Magn. Reson. lmag. 7(6) (1997) 1069-1075 Aylward, E.H., Rasmusson, D.X., Brandt, J., Raimundo, L,, Folstein, M., and Pear/son, G.D.: CT measurementofsuprasellar cistern predicts rate of cognitive decline in Alzheimer's Disease.
J. Int. Neuropsychol. Soc. 2(2) (I996) 89-95 8. Azari, N.P., Pettigrew, K.D., Schapiro, M.B., Haxby, J.V., Grady, C.L., Pietrini, P., Salerno, J.A., Heston, L,L., Rapoport, S.I., and Horwitz, B.: Early detection of Alzheimer's Disease: a statistical approach using Positron Emission Tomographic data. J. Cereb. Blood Flow and Metab. 13 (1993) 438-447 9. McMurdo, M.E., Grant, D.J., Kennedy, N.S., Gilchrist, J., Findlay, D., and McLennan, J.M.: The value of HMPAO SPECT scanning in the diagnosis of early AIzheimer's Disease in patients attending a memory clinic. Nucl. Med. Commun. 15(6) 0994) 405-9 10. Golan, H., Kremer, J., Freedman, M., and lchise, M.: Usefulness of follow-up regional cerebral blood flow measurements by Single Photon Emission Computed Tomography in the differential diagnosis of dementia. J. Neuroimaging. 6(i) (1996) 23-28 I I. D'Asseler, Y.M., Koole, M., Lemahieu, l., Achten, E., Boon, P., De Deyn, P.P., and Dierckx, R.A.: Recent and future evolutions in neuroSPECT with particular emphasis on the synergistic use and fusion of imaging modalities. Acta Neurol. Belg. 97(3) (1997) 154-62
630
12. Eagger, S., Syed, G.M.S., Bums, A., Barette, J.J., and Levy, R.: Morphological (CT) and functional (rCBF SPECT) correlates in Alzheimer's Disease. Nucl. Med. Commun. 13 (1992) 644-647 13. Friston, K.J., Holmes, A.P., Worsley, K.J., Poline, J.P., Frith. C.D., a0d Frackowiak R.S.J.: Statistical Parametric Maps in Functional Imaging: A General Linear Approach. Human Br. Mapping. 2 0995) 189-210 14. Friston, K.J.: Statistical Parametric Mapping: Ontology and Current Issues. J. Cerebral. Blood Flow. 15 0995) 361-370 1.5. Woods, R.P.: Automated Image Registration software for Unix, version 3.0. Available through the Interact at the URL: http://bishoow,loni.ur162 (I 995-98) 16. Friston, K., Ashbumer, J., Heather, J., Holmes, A., Poline, J-B., et al.: SPM Software. Wellcome Department of Cognitive Neurology. URL: http://www.fil.ion.ueLac.uk/spm/. (1994-1998) 17. Talairach, P. and Toumoux, J.: A stereotactic coplanar atlas of the human brain. Thieme, Stuttgart, Germany. (I 988) 18. Pavel, D.G., Thompson, D., Patel, B., Lin, Q., Brint, S., Dujovny, M., and Ibanez, V.: Evaluation of brain SPECT changes using Statistical Parametric Mapping following diamox challenge. J. Nucl. Med. 38 (1997) 280 19. Pavel, D.G., Horwitz, B., Saxena, P., Schapiro, M.B., Pietrini, P., and Ibanez, V.: Quantification of Alzheimer's PET Images using a special scaling method and Statistic Parametric Mapping. Soc. For Neurosei. Ann. Meeting. New Orleans. Vol 23 (1997), 563