AbstractâThis paper presents an easily-configurable robot audition system using the Histogram-based Recursive Level. Estimation (HRLE) method. In order to ...
The 2010 IEEE/RSJ International Conference on Intelligent Robots and Systems October 18-22, 2010, Taipei, Taiwan
An Easily-configurable Robot Audition System using Histogram-based Recursive Level Estimation Hirofumi Nakajima, G¨okhan Ince, Kazuhiro Nakadai and Yuji Hasegawa Abstract— This paper presents an easily-configurable robot audition system using the Histogram-based Recursive Level Estimation (HRLE) method. In order to achieve natural humanrobot interaction, a robot should recognize human speeches even if there are some noises and reverberations. Since the precision of automatic speech recognizers (ASR) have been degraded by such interference, many systems applying speech enhancement processes have been reported. However, performance of most reported systems suffer from acoustical environmental changes. For example, an enhancement process optimized for steady-state noise, such as fan noise, yields low performance when the process is used for non-steady-state noises, such as background music. The primary reason is mismatches of parameters because the appropriate parameters change according to the acoustical environments. To solve this problem, we propose a robot audition system that optimizes parameters adaptively and automatically. Our system applies linear and non-linear enhancement sub-processes. For the linear sub-process, we used Geometric Source Separation with the Adaptive Step-size method (GSS-AS). This adjusts the parameters adaptively and does not have any manual parameters. For the non-linear sub-process, we applied a spectral subtractionbased enhancement method with the HRLE method that is newly introduced in this paper. Since HRLE controls the threshold level parameter implicitly based on the statistical characteristics of noise and speech levels, our system has high robustness against acoustical environmental changes. For robot audition systems, all processes should be perfomed in realtime. We also propose implementation techniques to make HRLE run in real-time and show the effectiveness. We evaluate performance of our system and compare it to conventional systems based on the Minima Controlled Recursive Average (MCRA) method and Minimum Mean Square Error (MMSE) method. The experimental results show that our system achieves better performance than the conventional systems.
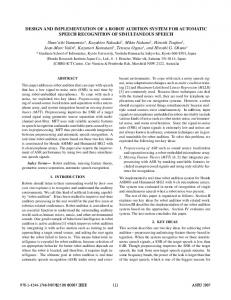
Input: Speech signal
Linear enhancement sub-process
Non-linear enhancement sub-process
Automatic Speech Recognizer (ASR)
Output: Speech text
Speech enhancement process
Fig. 1.
A robot audition system
thresholding operation. This means that MCRA implicitly assumes that the minimum level of the noise spectrum does not change. Therefore, if the noise is not steady-state and the minimum level changes, it is very difficult to set the threshold parameter to a fixed value. Moreover, even if a fine tuned threshold parameter for a non-steady-state noise works properly, the process will fail easily for other noises, even for usual steady-state noises. A similar issue exists in the step-size parameter for the Geometric Source Separation (GSS) method [6]. To balance separation precision and process stability the step-size parameters should be adjusted depending on the environment. Because a robot should be used in various environments, to select the best parameter set covering all possible environments is practically impossible. Therefore, it is important to create methods that control their parameters automatically or do not require any parameters at all. In this paper, we propose an easily-configurable robot audition system using the Histogarm-based Recursive Level Estimation (HRLE) method that does not require a levelbased threshold parameter and has high robustness for noise environment changes. II. S PEECH ENHANCEMENT FOR ROBOT AUDITION
I. I NTRODUCTION In order to avoid performance degradation of automatic speech recognizers (ASR) due to interferences such as background noise, many speech enhancement processes have been applied to robot audition systems [1], [2], [3], [4]. Most reported systems have adaptive functions to cope with environmental changes, however, there are adaptable range limits because of several assumptions. For example, [1], [2], [3] apply the Minima-Controlled Recursive Average (MCRA) method [5] for noise spectrum estimation. MCRA tracks the minimum level spectra and judges whether the current input signal is voice active or not (inferring noise) based on the ratio of the input energy and the minimum energy after applying a consequent H. Nakajima, G. Ince, K. Nakadai and Y. Hasegawa are with the Honda Research Institute Japan Co., Ltd, 8-1, Honcho, Wako-shi, Saitama 3510188, Japan. (email: {nakajima, nakadai, yuji.hasegawa}@jp.honda-ri.com)
978-1-4244-6676-4/10/$25.00 ©2010 IEEE
Voice Activity Detection (VAD)
Fig. 1 shows a system configuration for robot audition systems. To recognize input speech signals precisely, the speech enhancement process is applied prior to ASR. The combination of linear and non-linear sub-processes is a popular configuration for the speech enhancement process [1], [2], [7], [8]. The linear sub-process is mainly used for noise reduction and source separation, and the non-linear sub-process is applied for further noise reduction for the remaining noise and other interferences, because the linear sub-process can not cancel interference perfectly mainly due to the mismatch between propagation models and real-world propagation patterns of acoustical waves. A. Linear speech enhancement sub-process Since a linear sub-process does not cause non-linear distortion, most systems use it as the initial enhancement process. Classical BeamForming (BF) and adaptive BF are
958
very common methods [9] and are used for basic speech enhancement systems [10]. For further performance improvement, recently reported systems often use Blind Source Separation (BSS)-based methods. For example, [8] uses Independent Component Analysis (ICA) and [1], [2] employ the Geometric Source Separation (GSS) method [11]. General BSS-based methods require the adjustment of a stepsize parameter which controls adaptation speed and stability. Since inadequate step-size parameters degrade or destroy (in the worst case) the enhancement process, the step-size adjustment should be done carefully. B. Non-linear speech enhancement sub-process Most non-linear sub-processes are executed in the spectral power domain, which ignore phase information. [4], [7], [8] apply Spectral Subtraction (SS) method, which is a traditional enhancement process used in many applications because of its simplicity. [1], [2] use the Minimum MeanSquare Error (MMSE) method [12], which is popular for speech signal enhancement and causes lower musical noise compared to SS, although it requires much higher computational cost than SS. Both SS and MMSE require a function to estimate interference spectra, for which MCRA [5] is common because of its low computational cost. Generally, most non-linear enhancement processes use many parameters, which require adjustments. For example, the speech enhancement process of our previous system called postfilering [1] has 38 parameters. Similar to the step-size parameter in linear BSS processes, several parameters in a non-linear process strongly affect its performance. Therefore, the parameters should be adjusted according to the environment. C. Issues for practical robot applications The main issue is parameter adjustment for practical robot applications. Differently from systems for stable environments, robot audition systems are used in dynamically changing environments. Even if the room used is fixed and the background noise spectrum is almost stable, signal-tonoise ratio (SNR) changes dynamically according to various factors: position and voice loudness of a human speaker, position, head orientation, action states of a robot, etc. To achieve high enhancement performance, parameters should be adjusted to the optimum values. Since, the optimum values change according to the environments, it is difficult to achieve high performance in all possible environments. Preparing multiple parameter sets and switching to the parameter set depending on the current environment may solve this problem. However, it requires a lot of measurements and adjustments. For example, our previous system requires more than 3 days to optimize 10 important parameters of a postfilter using Genetic Algorithm (GA). Another related problem is how to detect the current environment properties.
Cumulative Frequency S(L) [# of cnts.] Frequency N(L) [# of counts]
Speech
Smax
Noise
Noise Cumulation Speech L100
L0
0
Power Level L [dB]
Fig. 2. level
x [%] =x/100*Smax
Lx Power Level L [dB]
Histogram (left) and Cumulative histogram (right) of input power
audition. This enhancement process uses few parameters, which do not require fine tuning. Similar to conventional speech enhancement approaches, this process consists of linear and non-linear sub-processes. For the linear subprocess, we applied the GSS-AS [13] method that requires no parameter adjustment. For non-linear sub-process, we applied an SS-based noise reduction process with a new method: the Histogram-based Recursive Level Estimation (HRLE) method that requires 5 parameters, of which only 2 parameters are to be optimized. A. GSS-AS Geometric Source Separation (GSS) [11] is a popular source separation method having high performance with low computational cost. GSS has been improved to an incremental method by J. Valin, et. al. for a real-time robot system [2]. GSS-AS is a further improved method of incremental GSS with an adaptive step-size technique. This technique performs automatic adjustments of the step-size parameters in time and frequency domain, and achieves high performance without any manual parameter selection [13]. B. Histogram-based Recursive Level Estimation (HRLE) We propose to apply an HRLE method for adaptive noise estimation. HRLE estimates input noise levels by taking the Lx value from an input power level histogram. Fig. 2 shows the HRLE’s diagram. The x in Lx indicates the position of the cumulative histogram. For example, L0 means the minimum level, L100 denotes the maximum and L50 is the median. This Lx value is commonly used in environmental noise measurement using sound-level meters. The difference of our proposed method to the method used in a sound-level meter is the average calculation. Since HRLE uses recursive averages, HRLE can calculate time-continuous histogram in real-time. Therefore, the estimated noise level can adapt smoothly and quickly to the environmental changes while a sound-level meter is unable to do it because of a fixedperiod average. The HRLE method can be represented by the following equations:
III. E ASILY- CONFIGURABLE SPEECH ENHANCEMENT PROCESS
To solve the parameter adjustment problem, we propose an easily-configurable speech enhancement process for robot
959
YL (t) = 20 log10 |y(t)|, Iy (t) = ⌊(YL (t) − Lmin )/Lstep ⌋, N (t, i) = αN (t − 1, i) + (1 − α)δ(i − Iy (t)), i ∑ S(t, i) = N (t, k), k=0
(1) (2) (3) (4)
] [ x argmin S(t, Imax ) − S(t, I) , 100 I Lx (t) = Lmin + Lstep · Ix (t), Ix (t) =
(5)
A. Direct level conversion table (T1)
(6)
The level conversion process decsribed in Eqs. (1) and (2) requires logarithms and square-roots. This calculation cost can be reduced by introducing a conversion table. Since the absolute calculation for complex variables requires squareroot, a conversion table from power value to dB-level index is efficient. By preparing a conversion table that describes the power boundary values for each dB-level indices, the level index can be obtained without any errors. However, this conversion table requires an index search for finding which section between the boundaries the input power value belongs to. To avoid this search process, we propose to make an approximated direct conversion table from the input power (floating point variable) to the level index (integer variable). A direct conversion table is a table that defines all the converted values for all possible input values. For example, if we can assign 233 bytes of memory for this table, we can store all combinations from single-precision floating point values (32 bits, ’float in C’) to 16 bit-precision integer (2 bytes, ’short in C’). Since 233 bytes are too large, we propose an approximation by truncating some fine fraction bits of the input variable. To truncate 15 fraction bits and 1 sign bit (since power is non-negative) from the input power, we can make the conversion table with only 64Kbyte of memory with very few boundary errors.
where t shows the current time step, y(t) represents an input signal that has complex values for processes in timefrequency domain. Lmin , Lstep and Imax are the minimum level, the level width of 1 bin and the maximum index of the histogram, respectively, x indicates the percentage position of the cumulative frequency, α is the time decay parameter that is calculated from time constant Tr and sampling frequency Fs as α = 1 − 1/(Tr Fs ), Lx (t) is the estimated level (output), δ(t) shows the Dirac delta function and ⌊·⌋ is the flooring function. In these equations, we used digital histograms N (t, i) and S(t, i) with integer index i for practical implementation, while Fig. 2 uses analog argument histograms N (L) and S(L) for simplicity. This method uses 5 parameters. However, most of them are fixed and do not need to be adjusted according to the environment. The first 3 parameters: Lmin , Lstep and Imax determine the range and sharpness of the histogram, they do not affect the estimated results, if we set proper values to cover the input level range with few errors. The typical values are Lmin = −100, Lstep = 0.2 and Imax = 1000 (We suppose the maximum spectral level is normalized to 96dB(1Pa) ). The last 2 parameters, x and α, are primary parameters that influence the estimated level. However, parameter x is not so sensitive to the estimated Lx value, if the noise level is stable. For example, in Fig. 2, Lx indicates the same mode value even if parameter x changes by roughly 30–70 %. For unstable noise, x determines the estimated level in the noise level range. Practically, since the speech signals are sparse in the time-frequency domain, the speech occurrence frequency is mostly less than 20% of the noise occurrence frequency and the value (20%) is independent of both SNR and (vibration) frequency. Therefore, we can set this parameter only according to the preferred noise level that we want to estimate and not to SNR or vibration frequency. For example, if the speech occurrence frequency is 20%, we set x = 40 for the median noise level, and x = 80 for the maximum. This is HRLE’s main advantage compared to other level-based estimation methods. For example, MCRA requires a threshold parameter for the discrimination of noise and signal, that should be adjusted according to SNR, which changes with frequency. Also, the last parameter Tr does not need to be changed according to neither SNR nor to frequency. This parameter controls the equivalent average time for histogram calculation. Tr should be set to allow sufficient time for both noise and speech periods. For typical interaction dialogs, such as question and answer dialogs, the typical value of Tr is 10s, because the period of most speech utterances is less than 10s. IV. I MPLEMENTATION TECHNIQUES FOR HRLE
B. Direct cumulative calculation (T2) The histogram N (t, i) in Eq. (4) is only used as a temporary function to calculate the cumulative histogram S(t, i). Therefore, we can reduce the calculation cost by calculating S(t, i) directly without N (t, i). In Eq. (3), N (t, i) is updated by multiplying α for all indices and adding (1−α) for only index Iy (t). For S(t, i), these are equivalent to also multiplying α for all indices and adding (1 − α) for indices from Iy (t) to Imax . C. Exponentially incremented value addition (T3) The multiplication of α for S(t, i) causes one of the highest calculation cost. This process is performed to add the exponentially-decayed weight ατ (|α| < 1) for pasttime data Iy (t − τ ). Since S(t, i) is used to search only the relative x% value (= 100 · S(t, I)/S(t, Imax )), we can avoid the α multiplication process for all indices by adding the exponentially-incremented value (1 − α)α−t for indices from Iy (t) to Imax instead of (1 − α). This reduces the calculation cost, because no multiplications are required for this process. However, this process causes exponential increases of S(t, I). Therefore, a magnitude normalization process of S(t, i) is required when S(t, Imax ) approaches the maximum limit value of the variable. The frequency of this normalization process can be reduced to set the normalization factor that changes from almost the maximum limit value to the minimum limit value. D. One direction search using previous values (T4)
We propose four techniques (T1-T4) to reduce the calculation cost of HRLE.
The index search process for the Lx value described in Eq. 5 requires a large calculation cost in the HRLE method.
960
Calculation Time [%]
100
2%
T1
80 60
Total 94% reduction
40
T3
20 0
T2 71%
4% 16% 6% With T1~T4 T4
Without T1~T4
Fig. 3.
Loudspeaker for noise
Reduction by T1 (Log. & sqrt.) Reduction by T2 (Cumulation) Reduction by T3 (Multiplication) Reduction by T4 (Search) Calc. Time.
1m
S2
Robot head 30°
1m S1
Loudspeaker for target speech
Microphone
Fig. 4.
Calculation time with/without four techniques
Experimental setting TABLE I
PARAMETER SETTING
The naive implementation would use a for-loop process from I = 1 to Imax and judge in the for-loop whether the current |S(t, Imax ) − S(t, I)| is the minimum or not. To reduce the number of decisions, we propose the use of the previously detected index I˜ and one direction search. Since S(t, I) is a non-negative monotonically increasing (non-decreasing) function of I, finding the index Ix that minimizes |S(t, Imax ) − S(t, Ix )| is equivalent to finding the nearest index to the intersection point between monotonically decreasing function y = S(t, Imax ) − S(t, I) and horizontal axis line y = 0 in the (Ix , y) plane. Therefore the one direction search suffices if we start searching from a nonterminal point I (1 < I < Imax ). Also, since I is supposed ˜ to start the search index from I˜ to be a neighbor index to I, is the most effective. E. Effectiveness of proposed techniques Fig. 3 shows the normalized calculation time with and without proposed techniques. We used a laptop computer having Intel Atom 1.6GHz CPU and 1GByte of memory. The original calculation time (100%) is 35 seconds for 5 seconds of input data with 16kHz sampling. Therefore, the original calculation can not be performed in realtime (Realtime factor: RTF = 7). We can find that our proposed techniques reduced the calculation time by 94%. Since the RTF = 0.42, this calculation can be performed in realtime. Regarding the contribution of the techniques to the calculation time reductions, the direct cumulative calculation (T2) is most effective, because the required memory is reduced by 50% and all operations for N (t, i) are eliminated. On the other hand, direct level conversion table (T1) does not contribute to the overall calculation time reduction, because the level conversion process is required only one time for each time-frame while other processes are computed Imax times. However, T1’s effectiveness (2%) is not neglegible considering that the real calculation time takes only 6% of the total caaculation time. Because the overhead processes (File I/O, windowing, FFT, etc.) are included in the final calculation time, the load for HRLE’s process is small. V. E VALUATION We evaluate noise estimation performance of HRLE in VB and the total system performance with ASR in V-C after describing the common experimental settings in V-A.
System parameters Sampling Rate Fs 16kHz Window length 512 Window shift 128 Window type hanning HRLE parameters Lmin = −100 dB Lstep = 0.2 dB Imax = 1000 x = 50 % / 20 % Tr = 10s (Sct. 4.1 / 4.2) MCRA parameters αd = 0.95 αp = 0.2 L = 125 αs = 0.8 w=1 δth = 5
A. Common experimental settings Fig. 4 shows the microphone and sound source positions. To control SNR and to measure the true noise level, we measured noise signal and impulse responses and synthesized the input signals with the speech signals recorded in a silent environment. The impulse responses were measured using a head embedded microphone in a humanoid robot developped by Honda with loudspeakers (S1 and S2 ) in front. We used speech signals extracted from an ATR phoneticallybalanced Japanese word dataset as source signals. This dataset includes 216 words for each speaker. We used a measured robot noise (mainly fan noise) as a steady-state noise and a music signal as a non-steady-state noise. All experiments were performed in a time-frequency domain, for which Table I listed the system parameters. To show HRLE’s effectiveness, we compared it to the MCRA method. The parameters for HRLE and MCRA were also described in Table I. The MCRA parameters were identical to the parameters described in MCRA’s original paper ([5]), with which we supposed that MCRA yields the best performance. B. Noise estimation performance We evaluated noise estimation performance with a special focus on the robustness against environmental changes. We assumed that the background noise changes from a steadystate noise into a non-steady-state noise. Since the HRLE and the MCRA parameters are tuned for steady-state noises, estimation performance for non-steady-state noises will show the robustness. We used a robot fan noise and a classical music of strings as the steady-state and non-steady-state noises, respectively. Fig. 5(a) shows the input spectrogram
961
4
30
3
20
2 10
1 1
2 3 Time [s]
4
5
4
30
3
20
2 10
0 0
1
2 3 Time [s]
4
5
60
7
40
5 4
30
3
20
2 10
1 4
Fig. 6.
30
3
20
2 0 0
10 1
5
0
5
50 40
5 4
30
3
20
2 1 2 3 Time [s]
4
5
40 30 20
2 10 1
2 3 Time [s]
4
5
0
(a) Fan
10 1
2 3 Time [s]
4
5
0
60
7
50
6 40
5 4
30
3
20
2 10
1 0 0
1
2 3 Time [s]
4
5
0
(b) Music Fig. 8.
Noise signal spectrograms
20
2
8
50
3
0 0
30
3
0 0
60
4
0
4
(b) Music
5
1
40
5
1
0
6
10
50
6
Estimated spectrograms by HRLE
7
6
1
4
8
60
7
0 0
2 3 Time [s]
Fig. 7.
(b) Music
(a) Fan
4
(a) Fan
8
50
6
2 3 Time [s]
5
Input signal spectrograms
8
1
40
60
7
50
6
1
0
(b) Music Fig. 5.
Frequency [kHz]
5
1
0
(a) Fan
0 0
40
Frequency [kHz]
0 0
50
6
8 Frequency [kHz]
5
60
7
Frequency [kHz]
40
8
60
7
Frequency [kHz]
Frequency [kHz]
50
6
8
Frequency [kHz]
60
7
Frequency [kHz]
8
Estimated spectrograms by MCRA
environmental changes compared to MCRA. for steady-state noise (fan) and Fig. 5(b) is non-steadystate noise (music). In Fig. 5(a), we can see the horizontal stripes for steady-state fan noise and four separated bright parts for speech sentences. In Fig. 5(b), there are many fine vertical lines for music noise. Both SNR of the input signals were 20dB. Fig. 6(a) and Fig. 6(b) show the steady-state and non-steady state noise spectrograms, respectively. Since estimating very fine fluctuation of noises is impossible, to estimate a time-averaged smooth spectrogram is the target for both noise estimation methods. Fig. 7(a) shows the estimated noise levels (spectrogram) using HRLE for the steady-state noise. We found that the spectrogram converges very quickly. 8(a) shows the estimated spectrogram using MCRA. Different from HRLE, MCRA requires at least 1 second for convergence because of block-based processes. This means that MCRA can not enhance the first speech sentence uttered in 0.5 - 1.2 s for slow convergence while HRLE can. Fig. 7(b) shows the estimated spectrogram using HRLE for non-steady-state noise. The estimated spectrogram is almost the same as the one for the steady-state condition (Fig. 7(a)). On the other hand, the estimated spectrogram using MCRA in Fig. 8(b) shows deteriorated convergence speed and smoothness compared to the steady-state condition (Fig. 8(a)). Fig. 9(a) shows the estimated errors obtained for steady-state condition. The horizontal and vertical axes show the time and error levels, respectively, the solid and dotted lines represent MCRA and HRLE, respectively. The estimation errors are small for both methods after 1 second and there is little difference between HRLE and MCRA levels. However, for a non-steady-state condition shown in Fig. 9(b) the estimation error for HRLE is lower than the one for MCRA by 2-5dB and the convergence speed for HRLE is also faster than the one for MCRA. From these results, we can conclude that HRLE has robustness against noise
C. Total system performance We evaluated our proposed system through a robot audition system: HARK [1]. The system integrates sound source localization, voice activity detection, speech enhancement and ASR. We used a word correct rate (WCR) for the evaluation metric using ATR216 and Julius [14] for ASR. The acoustic model for ASR was trained with enhanced speeches using only GSS-AS process applied on a large data corpus: Japanese Newspaper Article Sentences (JNAS)1 . We evaluated 4 systems: Baseline, Postfilter, MCRA and HRLE. Linear sub-process by GSS-AS was applied to all systems. Baseline is a system without any non-linear enhancement sub-processes. Postfilter is our previous version using a MMSE-based non-linear enhancement sub-process. MCRA uses a non-linear enhancement sub-process based on SS and MCRA. HRLE is the proposed enhancement process using HRLE. First, we adjusted only the x parameter of HRLE because we did not know its value for the optimum suppression intensity for ASR. To be fair, we newly introduced a gain parameter G for MCRA that magnified the estimated noise power of G. The other parameters are the same as given in the set in V-A. Fig. 10 shows the WCR scores obtained using these parameters. We can see lower suppressions than median or average are suitable for our system. The reason is that the acoustic model matches to noisy speeches better than clean speeches, since the training dataset includes the resideual background noises and non-target speeches using GSS-AS. We used the best parameters, namely x = 20 for HRLE and G = 0.4 for MCRA. For postfilter, we optimized 10 parameters using a genetic algorithm to yield the best ASR
962
1 http://www.mibel.cs.tsukuba.ac.jp/
090624/jnas/instruct.html
15 10 5 1
2 3 Time [s]
4
5
(a) Fan
HRLE MCRA
15 10 5 0 0
1
2 3 Time [s]
4
5
70 60 50 40 30
(b) Music Fig. 9.
GSS AS (baseline) MCRA HRLE
80
20
Word Correct Rate [%]
20
0 0
90
25
HRLE MCRA
Estimation error [dB]
Estimation error [dB]
25
20 0
Error levels
10
TABLE II E NVIRONMENTAL NOISE CONDITIONS
Label Fan Music Speech
Noise conditions BGN (diffuse noise from robot) Music (θ = 30◦ ) + BGN Speaker (θ = 30◦ ) + BGN
SNR [dB] 0 2 2
Baseline
performance in a similar acoustical condition. We evaluated WCR scores for 3 different noise types (Fan, Music, Speech) as described in Table II. The main speaker was located 1m in front of the robot. The input data was 236 isolated utterances and the estimated noises were initialized by every utterances. Since robot systems make new estimations when a new speaker emergences and restart the initialization, when the speaker vanishes, we assumed a dynamic environment is created, in which the speaker changes frequently. Fig. 11 shows the WCR for each condition. We found out that our previous system (postfilter) was the worst in almost all conditions because of the lack of robustness against environmental changes. HRLE has higher scores compared to MCRA under all conditions. For Fan and Music conditions, the HRLE’s scores were highest in all methods. For the Speech condition, all enhancement methods’ scores were lower than the Baseline. We suppose this is because statistical characteristics of noise and speech are the same, all enhancement methods failed to estimate the noise level precisely. VI. C ONCLUSION This paper proposes a robot audition system using the Histogram-based Recursive Level Estimation (HRLE) method. Since our system controls primary parameters adaptively according to the environment, the system has high adaptivity against acoustical environmental changes. Also, we proposed implementation techniques for HRLE and demonstrated that the HRLE can perform in realtime. Experimental results showed that our system can achieve better performance than conventional systems. R EFERENCES [1] K. Nakadai, et. al., “An open source software system for robot audition HARK and its evaluation,” in 2008 IEEE-RAS Int’l. Conf. on Humanoid Robots (Humanoids 2008). IEEE, 2008. [2] J. Valin, et. al., “Enhanced robot audition based on microphone array source separation with post-filter,” in IROS2004. IEEE/RSJ, 2004, pp. 2123–2128.
70
Word Correct Rate by parameter x and G
Fig. 10.
Word correct rate [%]
No. 1 2 3
20 30 40 50 60 x [%] in HRE, G*50 in MCRA
Postfilter
MCRA
HRLE
100 90 80 70 60 50 40
Fan
Fig. 11.
Music Noise conditions
Speech
Word Correct Rate for each condition
[3] S. Yamamoto, et. al., “Making a robot recognize three simultaneous sentences in real-time,” in IROS2005. IEEE/RSJ, 2005, pp. 897–892. [4] N. Mochiki, et. al., “Recognition of three simultaneous utterance of speech by four-line directivity microphone mounted on head of robot,” in 2004 Int’l Conf. on Spoken Language Processing (ICSLP2004), 2004, p. WeA1705o.4. [5] I. Cohen and B. Berdugo, “Speech enhancement for non-stationary noise environments,” Signal Processing, vol. 81, pp. 2403–2481, 2001. [6] H. Nakajima, et. al., “High performance sound source separation adaptable to environmental changes for robot audition,” in IROS 2008. IEEE, 2008, pp. 2165–2171. [7] M. Delcroix, et. al., “Static and dynamic variance compensation for recognition of reverberant speech with dereverberation processing,” IEEE Trans. on Audio, Speech, and Language Processing, vol. 17, no. 2, pp. 324–334, 2009. [8] Y. Takahashi, et. al., “Real-time implementaion of blind spatial subtaction array for hands-free robot spoken dialogue system,” in IROS2008. IEEE/RSJ, 2008, pp. 1687–1692. [9] L. J. Griffith and C. W. Jim, “An alternative approach to linearly constrained adaptive beamforming,” IEEE Trans. on Antennas and Propagation, vol. 30, no. 1, pp. 27–34, 1982. [10] I. Hara, et. al., “Robust speech interface based on audio and video information fusion for humanoid hrp-2,” in IROS2004. IEEE, 2004, pp. 2404–2410. [11] L. Parra and C. Alvino, “Geometric source separation: Merging convolutive source separation with geometric beamforming,” IEEE Trans. on Speech and Audio Processing, vol. 10, no. 6, pp. 352–362, 2002. [12] Y. Ephraim and D. Malah, “Speech enhancement using a minnnimum mean-square short-time spectral amplitude estimator,” IEEE Trans. on Acoustics, Speech, and Signal Processing, vol. ASSP-32, no. 6, pp. 1109–1121, 1984. [13] H. Nakajima, et. al., “Adaptive step-size parameter control for realworld blind source separation,” in ICASSP 2008. IEEE, 2008, pp. 149–152. [14] A. Lee, et. al., “Julius - an open source real-time large vocabulary recognition engine,” in 7th European Conf. on Speech Communication and Technology, 2001, vol. 3, pp. 1691–1694.
963