Hindawi Publishing Corporation International Journal of Distributed Sensor Networks Volume 2016, Article ID 4972785, 14 pages http://dx.doi.org/10.1155/2016/4972785
Research Article EBRP: An Energy-Efficient and Buffer-Aware Routing Protocol for Mobile Crowdsensing Network Huahong Ma,1 Guoqiang Zheng,1 Honghai Wu,1 Baofeng Ji,1,2 and Jishun Li3 1
College of Information Engineering, Henan University of Science and Technology, Luoyang 471023, China State Key Laboratory of Millimeter Waves, NanJing 210096, China 3 Henan Key Laboratory for Machinery Design and Transmission System, Henan University of Science and Technology, Luoyang 471023, China 2
Correspondence should be addressed to Guoqiang Zheng;
[email protected] Received 11 December 2015; Accepted 7 February 2016 Academic Editor: Pascal Lorenz Copyright © 2016 Huahong Ma et al. This is an open access article distributed under the Creative Commons Attribution License, which permits unrestricted use, distribution, and reproduction in any medium, provided the original work is properly cited. Data collection with high efficiency is a key problem for the completion of crowdsensing tasks in Mobile Crowdsensing Networks. Much work has been done on the opportunistic routing problem, but they usually just focused on the sociality of node, and the attributes of node itself have always been ignored, such as energy and buffer, which are particularly important for the persistent crowdsensing tasks. In this paper, we now modify the spectral clustering algorithm and propose a novel and more practical routing protocol for MCSN, named EBRP, in which the sociality of node and the dynamic changes of the attributes of node itself are all fully considered when the relay nodes are selected. To evaluate the performance of our routing protocol, we have done extensive simulations and much analysis based on three real-life mobility traces. The results show that our EBRP can greatly outperform the existing protocols in terms of delivery ratio, cost, and node survival ratio.
1. Introduction In recent years, mobile smart terminals have already penetrated into every corner of our daily lives [1]. Benefiting from the rapid developments of microelectronics technology and short range wireless communication technology, these terminals usually have rich sensors and the ability to directly communicate with others. Many large-scale sensing tasks, which can not be completed before, can be finished easily through the collaborations among mobile smart terminals. This means that the human beings have entered the era of crowdsensing [2, 3], and this kind of network is also called Mobile Crowdsensing Network (MCSN). For some tasks, the sensed data can be reported directly to the sensing platforms, while, for many other complicated ones, for some reasons, such as network situation and cost, the sensed data must be delivered through the wireless multihop way. However, due to the mobility of terminals, intermittent connection is the main characteristic of MCSN [4, 5]. To deal with this problem, the wireless multihop opportunistic data transmission mode
based on store-carry-forward [6, 7] is often utilized for sensed data collection in MCSN. There have already been many works to discuss the issue of data transmission in delay tolerant networks or opportunistic networks, and all kinds of routing algorithms have been proposed for different specific applications or scenarios also. However, due to the following reasons, almost none of them can work well when they are directly applied to our practical tasks for sensed data collection in MCSNs. For complicated crowdsensing tasks, in order to improve the operation quality, mobile terminals are required to collect data whenever and wherever; thus data sensing will continue for quite a long time, and a large amount of data need to be delivered. However, in our real lives, these mobile terminals are privately owned; not only is the energy of them not sufficient, but also the memory space their owners are willing to share is very limited. The algorithms proposed above focused too much on the “social nature” of mobile terminals, such as contact frequency, contact probability, and centrality, while the “source nature” is always neglected. As
2
International Journal of Distributed Sensor Networks
a result, during the data collection, expecting to achieve high delivery performance, too much data is forwarded to some “important” mobile terminals. Then, lots of packets are dropped due to the limited buffer space, and the few “important” terminals also die too early due to the exhaustion of their energies, which, on the contrary, will greatly decrease the performance of network and the quality of data delivery. To deal with the problems above, in this paper, we propose a novel and more practical routing protocol for MCSN, named EBRP (Energy-Efficient and Buffer-Aware Routing Protocol), in which the sociality of node and the dynamic changes of the attributes of node itself are all fully considered when the relay nodes are selected. More specifically, we firstly design an adaptive clustering algorithm based on Spectral Clustering Theory, which can compute the optimal value of modularity so as to achieve the best clustering of mobile nodes. Based on the accurate community division, sociality of nodes is combined with the attributes of node itself, such as energy and buffer, and a utility function is formulated to guide the data forwarding. Due to the fact that the factors of energy and buffer are fully considered when relay node is selected, our routing protocol is expected to achieve high packet delivery ratio, long survival time of network, and low packet dropping ratio. Extensive experiments are done to evaluate its performance based on three real-life mobility traces. In summary, the main contributions of this paper are outlined as follows: (i) We propose an adaptive clustering algorithm based on Spectral Clustering Theory, which can achieve the optimal community division and extract the community attributes of mobile nodes accurately. (ii) Based on the adaptive clustering algorithm above, we propose a practical routing protocol for MCSN, named EBRP, in which the sociality of nodes is not the unique factor considered any more when data is forwarded, and more importantly, the attributes of node itself, such as energy and buffer, are all fully considered. (iii) We do extensive experiments to evaluate the performance of routing protocol based on the three reallife mobility traces. Furthermore, we also show the different importance of nodal sociality, energy, and buffer on the performance of EBRP through analysis and a large number of experimental results. The rest of the paper is organized as follows: Section 2 surveys the related work. The network basis and assumptions utilized are described in Section 3. Section 4 introduces our adaptive clustering algorithm and presents our routing protocol, namely, EBRP, based on this. We show simulation and evaluation in Section 5 and results including discussions in Section 5.5, followed by the conclusion and future work in Section 6.
2. Related Works For the complicated crowdsensing tasks, as mentioned earlier, for the reasons of costs and networking environments, the participatory nodes will be unwilling or unable to report the sensed data to the sensing platforms directly; then, deviceto-device communication is an ideal way for nodes to deliver their sensed data. Due to the mobility of users, intermittent connection is the main characteristic of MCSNs, and there rarely exists an end-to-end path between each participatory user and sensing platform. Therefore, from the point of view of data transmission, MCSN is still a kind of delay tolerant networks (DTNs) or opportunistic networks. In traditional DTNs or opportunistic networks, to improve the successful delivery ratio, replication is the most common technique to maximize the number of successful messages delivered. A typical routing protocol is Epidemic [8], which uses flooding pattern to diffuse the copies of a message in networks. If the node buffer and bandwidth are sufficient, this mechanism will have minimal delay and maximal successful delivery ratio. But in case of limited resources in MCSNs which usually consist of mobile devices, this scheme will lead to the maximum network load and the worst scalability; then, its performance will decrease greatly. Taking into account the flaws of Epidemic, the following protocols such as Direct Delivery [9], First Delivery [10], Spray and Wait [11], Prophet [12], Spray and Focus [13], and Maxprop [14] have been proposed, which either limit the number of hops or replicas of a message or utilize the history information of contacts among nodes to do relay selection and have improvement more or less in performance. In addition, the authors of literature [15] proposed a social context-based routing scheme named CIPRO, in which a BP Neural Network model is used to predict the context of nodes, so that the source device knew when and where to start the routing process to maximize the transmission delay and minimize the network overhead. The authors of literature [16] designed a user context-based message replication technology that achieved efficient data delivery with deterministic cost, and the model used for message replication was an online knapsack problem. In recent years, some researchers found that the mobility of users tends to be influenced by their social relationships and/or their attraction to physical places that have special meaning with respect to their social behaviors, and the mobility pattern of nodes has great influence on the packet delivery quality [17]. Then, social relationship has begun to be taken into consideration when designing opportunistic routing strategy, such as friend relationship [18], centrality [19, 20], similarity [19, 21, 22], and community [23]. In literature [18], Bulut and Szymanski used node contact frequency, average contact duration, and contact regularity to identify social relations between nodes. The authors thought that there should be higher contact frequency, longer contact time-duration, and relatively fixed interaction among friends and designed a friend-oriented forwarding strategy. In literature [20], a protocol named PeopleRank was proposed using classical PageRank algorithm to calculate node centrality distributively, which reduced algorithm complexity of
International Journal of Distributed Sensor Networks the traditional social network analysis method. Moby Space [21] assumed that the nodes visit some landmark location with a certain probability. Because each node may not have the same visiting probabilities, the similarity between nodes can be estimated according to their respective visiting probability distribution. When the nodes encountered, the packets could be forwarded to the nodes more similar to destination node. The authors of literature [19] made full use of the contact information of neighbor nodes to estimate the centrality and similarity of each node and merge these two metrics into a SimBet metric. In literature [22], they further merged the tie strength relationship with the destination node into SimBet and named it SIMBetST, which can avoid high load of central node. The authors of literature [23] fully investigated heterogeneity in popularity, used betweenness centrality to define nodes Rank, used 𝐾-CLIQUE and WNA algorithms to extract nodes community property, and proposed a forwarding strategy named BubbleRap that considered global centrality, local centrality of a node, and node community label at the same time. When the packet did not enter the communities destination node belonged to, the packet would be forwarded to the nodes with higher global centrality; otherwise, it would be forwarded to the nodes with higher local centrality within destination community in order to reduce the routing overhead. Centrality and similarity of the nodes could be evaluated by using the information entropy theory in the literature [24]. By fusing centrality and similarity at relay node selection stage, the node selection problem was formulated as a multiobjective optimization problem and used the adaptive weighted method to select the relay nodes to improve the overall average performance of the network. However, due to limited node resource, nodes with higher centrality would soon exhaust energy and buffer for forwarding messages frequently, which can result in the failure of data forwarding and worse performance. The authors of the literature [25] proposed a social routing strategy named EABubble. The energy was described as a two-order differential equation, and the node’s centrality was recalculated by being added with this expression to balance the energy consumption between nodes in the network. In literature [26], both node contact probability and remaining buffer size of node were considered to choose the proper relay node. Node contact probability was calculated by adopting the similar idea to Prophet [12]. Node can adaptively adjust the transmission policy according to the amount of remaining buffer, which can reduce the data overflow of buffer and improve resource utilization. And, in literature [27], the authors concluded that mobile opportunistic communication between users may fail with the absence of fairness in participating high-ranked nodes, and an absolute fair treatment of all users yields inefficient communication performance; they then proposed a real-time distributed framework named FOG to ensure efficiency-fairness tradeoff using node load information. In the above literatures, the authors give due consideration with node local information such as energy and buffer when designing the routing strategy, and the results are more or less improved. Thus, we conclude that the remaining energy and buffer of the node will have a great impact on
3 the ability of the relay node. In MCSN, network of peoplecentered sociality of nodes should not be the unique factor when designing routing section. And, in the previous papers, the remaining buffer and the residual energy of nodes have not been considered at the same time, resulting in the lower overall performance of the network. In this paper, we proposed a novel opportunistic routing strategy aware of energy and buffer, and in the following section, we would prove the effectiveness of our method by the theoretical and experimental results.
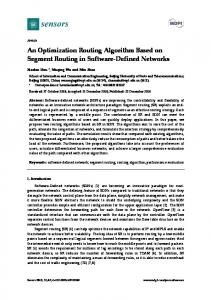
3. Network Basis and Assumptions In this section, we briefly give the network basis of MCSN, assumptions used, and our design overview. 3.1. Network Basis. The networking structure of Mobile Crowdsensing Networks is illustrated in Figure 1 which is mainly comprised by two parts. The first one is called sensing platform, which accepts the tasks from outside, schedules them, and assigns them to the participants. In addition, the sensing platform is also responsible for the data collection and processing. In many cases, to improve the performance of MCSNs, some incentive scheme is implemented; then, the sensing platform should have the ability to manage the participants and pay them for their contributions. The other part of the networking structure is the whole of participants, such as mobile users and vehicles, which are responsible for data sensing and delivery. Due to the simplicity of the most current tasks, crowdsourcing usually adopts the mode of 𝑢𝑠𝑒𝑟-𝑠𝑒𝑟V𝑒𝑟 to deliver data, which only asks the participatory users to report their sensing data to the sensing platform independently. However, in our application scenario, we mainly focus on the mode of 𝑢𝑠𝑒𝑟-𝑢𝑠𝑒𝑟, in which the sensing data can not be sent to sensing platform and must be delivered by the means of multihop and device-to-device (D2D) communication as Figure 1 shows. 3.2. Assumptions. In general, each user will be treated as a node in the network. Social nature of node is still an important factor considered for our routing protocol design. In this paper, we will extract such information from the mobility traces of users. We regard a MCSN as symmetric weighted graph 𝐺(𝑉, 𝐸), where 𝑉 is the set of mobile nodes and 𝐸 is the set of edges. Here, an edge means the physical encounter between two nodes, and the weight of the edge 𝑒𝑖𝑗 is defined as the closeness degree between nodes 𝑖 and 𝑗. According to the graph 𝐺(𝑉, 𝐸), we can compute the sociality of each node in the whole network or in a community. When we formulate our utility function, the energy is the most important factor, so it will be a key problem to quantify the energy consumption. We know that a mobile user will use his/her mobile device to do all kinds of things instead of just helping us to sense and forward data, and all the apps running on the mobile devices will consume energy. Therefore, in order to simplify this issue, we assume that energies all the mobile users are willing to spend on the crowdsensing task are equal. During the data delivery, the energy is mainly consumed on the packet receiving and transmitting; then,
4
International Journal of Distributed Sensor Networks
Data processing
Sensing platform
Task release
Data collection
Data collection
Figure 1: Illustration of networking structure of MCSNs.
in our assumption, we propose to use the total number of packets which are received and transmitted to quantify the energy consumption. In order to make our routing protocol more practical, the other factor that we should fully consider is the buffer of mobile device. It is a truth that most of the mobile devices produced nowadays have huge storages, but, for the mobile users, it is better that the buffering space occupied by the crowdsensing task is as small as possible. Therefore, we assume that buffering space that each mobile user is willing to share is equal, which is quantified by the number of packets that can be accommodated.
4. Energy-Efficient and Buffer-Aware Routing Protocol for MCSNs In this section, we introduce our Energy-Efficient and BufferAware Routing Protocol in detail. The most intrinsic issue of routing design for MCSNs is how to select the “best” node as relay. In a practical application scenario, which node is the “best” relay is determined by the following three factors: sociality, residual energy, and free buffering space. The social nature of node in network is relatively stable, which can be used as the basis for the design of routing decisions, while the attributes of node itself will change over time, which can be integrated into a utility function to guide the data forwarding. Therefore, in the first part of this section, we will show how to define and compute the social nature of nodes accurately, and in the second part, we introduce how to formulate the utility function which can fully integrate the above three factors and then describe our data forwarding strategy carefully.
4.1. Quantification of Sociality. Due to the fact that we regard a MCSN as time-variant graph, then we can employ the concepts of graph theory to define the social attributes of nodes. In graph theory, indicators of centrality identify the most important vertices within a graph. Centrality concepts were first developed in social network analysis, which are utilized to identify the most influential person(s) in a social network, and superspreaders of disease. In our application scenario, if a node has relative higher centrality, it means that this node will encounter more other nodes; then, it may be as a good information carrier and forwarder. Therefore, in our paper, we use the concept of centrality to define and quantify the social status of nodes in the MCSN. 4.1.1. Centrality of Nodes. In general, there are three ways to characterize the centrality of the node [19]. The first is degree centrality, which is the degree to which a node is associated with all other nodes in a network. For an undirected graph with 𝑔 nodes, the degree centrality of a node is the total number of neighbor nodes of direct contact. The second is closeness centrality, which reflects the proximity degree of a node to another node in a network, which measures the reciprocal of the mean geodesic distance between two nodes. The third is betweenness centrality, which is from graph theory and indicates the times that a node falls on the shortest paths linking any other two nodes in the network. It can be regarded as how well a node can facilitate communication to other nodes in the network. In this paper, we use the definition of betweenness centrality to characterize the importance of a node in the network. As mentioned
International Journal of Distributed Sensor Networks
5
above, a MCSN can be regarded as a symmetric weighted graph. According to the relevant knowledge of graph theory, the betweenness centrality of a node 𝑝𝑖 can be computed using 𝑁
𝐶𝐵 (𝑝𝑖 ) = ∑
𝑗−1
∑
𝑗=1,𝑗=𝑖̸ 𝑘=1,𝑘=𝑖̸
𝑔𝑗𝑘 (𝑝𝑖 ) 𝑔𝑗𝑘
.
(1)
Here, 𝑔𝑗𝑘 is the total number of the shortest paths linking nodes 𝑝𝑗 and 𝑝𝑘 and 𝑔𝑗𝑘 (𝑝𝑖 ) is the number of these shortest paths that include 𝑝𝑖 . In this paper, to estimate 𝑔𝑗𝑘 , we carried out a lot of flooding experiments on three datasets, respectively, trying to get all the shortest paths linking any two nodes firstly. On the basis of this, we can count the number of times 𝑔𝑗𝑘 (𝑝𝑖 ) that a node 𝑝𝑖 falls on the shortest path linking other two nodes. Then, the betweenness centrality of node 𝑝𝑖 can be obtained. 4.1.2. Adaptive Clustering Algorithm. Through social network analysis, it can be seen that most activities of people are limited to a certain area or community because of interest, profession, and other reasons. Community is a subset composed of some nodes, and the connection between the nodes within the same community is more closely compared with the nodes between communities. By analyzing the user’s mobile dataset and extracting the user’s community attributes, we can make wiser routing strategy. Community attribute is always extracted by using clustering algorithm. Spectral clustering algorithm [28] is based on the theory of the spectrum, and it has the advantage of clustering the sample space of any shape and convergence in the global optimal solution. In the spectral clustering algorithm, each object of the dataset is the vertex 𝑉 of the graph; the similarity between vertices is the weight 𝐸 of the corresponding edges. Thus, we have an undirected weighted graph 𝐺(𝑉, 𝐸) based on similarity, and the clustering problem can be transformed into a graph partitioning problem. The optimal partitioning criterion based on graph theory is to achieve the biggest similarity within subgraph and the smallest similarity between the subgraphs. Specifically, the first and the most important step of spectral clustering algorithm is to define the similarity matrix of the object set. And the calculation steps of the similarity matrix in our paper are as follows. Firstly, we extracted the contact times 𝑁(𝑖, 𝑗) and the average contact duration AD(𝑖, 𝑗) of nodes 𝑖 and 𝑗 from the real-life mobility dataset firstly. And then the closeness between nodes 𝑖 and 𝑗 can be expressed as the following equation: Clos (𝑖, 𝑗) = 𝛼 ⋅ 𝑁 (𝑖, 𝑗) + 𝛽 ⋅ AD (𝑖, 𝑗) ,
(2)
where 𝛼 and 𝛽 denote the weights of 𝑁(𝑖, 𝑗) and AD(𝑖, 𝑗), respectively. Further, we can obtain the closeness matrix CL of the whole dataset, which is illustrated using (3), in which the 𝑗th → line in the matrix forms a vector 𝐶(𝑗), and each element of this vector represents the closeness degree between the nodes
𝑗 and the other node in all dataset. It is obvious that the closeness matrix is a symmetric matrix: → 𝐶 (1) [ ] [ ] . [ .. ] .. ] ] ] . ] [ ] ] [ [→] ] [ ⋅ ⋅ ⋅ 𝑐𝑗𝑛 ] = [𝐶 (𝑗)] ]. ] [ ] [ .. ] .. ] ] ] . ] [ [ . ] [ ] → ⋅ ⋅ ⋅ 𝑐𝑛𝑛 ] 𝐶 (𝑛) [ ]
𝑐11 ⋅ ⋅ ⋅ 𝑐1𝑖 ⋅ ⋅ ⋅ 𝑐1𝑛
[ . [ . [ . [ [ CL = [𝑐𝑗1 ⋅ ⋅ ⋅ [ [ . [ . [ .
.. . 𝑐𝑗𝑖 .. .
[𝑐𝑛1 ⋅ ⋅ ⋅ 𝑐𝑛𝑖
(3)
Based on this closeness matrix, in the end, we can define the similarity between nodes 𝑖 and 𝑗 as Sim (𝑖, 𝑗) =
1 → → 2 √ (𝐶 (𝑖) − 𝐶 (𝑗))
,
(4)
→ → where 𝐶(𝑖) and 𝐶(𝑗) are the closeness vector of nodes 𝑖 and 𝑗, respectively. In fact, Sim(𝑖, 𝑗) is the reciprocal of the Euclidean distance of the closeness vectors between nodes 𝑖 and 𝑗. Based on this similarity, the similarity matrix 𝑊 of node set is obtained, and the spectral clustering algorithm is carried out. Considering that in traditional spectral clustering algorithm the number of clusters must be given in advance, we modify it and propose a novel and practical one, namely, adaptive and optimal spectral clustering algorithm, which introduces modularity value to determine community number 𝐾 before spectral clustering. Modularity is an indicator to measure the intensity of network community structure, which is proposed by Newman [29]. The value 𝑄 of the modularity is mainly determined by the community distribution of nodes in the network and can be used to measure the quality of the network community division. Nonzero 𝑄 values indicate deviations from randomness; values around 0.3 or more usually indicate good divisions. Specifically, modularity can be defined using the following equation: 𝑄 = ∑[ V𝑤
𝐴 V𝑤 𝑘V 𝑘𝑤 ] 𝛿 (𝑐V , 𝑐𝑤 ) , − 2𝑚 4𝑚2
(5)
1 𝑚 = ∑𝐴 V𝑤 , 2 V𝑤
(6)
𝑘V = ∑𝐴 V𝑤 ,
(7)
𝑤
where 𝐴 V𝑤 is the value of the weight of the edge between vertices V and 𝑤, if such an edge exists, and 0 otherwise; the 𝛿-function 𝛿(𝑖, 𝑗) is 1 if 𝑖 = 𝑗, and 0 otherwise; 𝑚 and 𝑘V are defined as (6) and (7), respectively, and 𝑐𝑖 denotes the community vertex 𝑖 belongs to. Our spectral clustering algorithm can specify a series of values for the number of communities, then carry out the community division based on each community number, and adaptively calculate modularity value separately. Then, it takes the value of community number corresponding to
6
International Journal of Distributed Sensor Networks
Input: similarity matrix 𝑆; Maximum community number 𝑀 Output: maximum modularity value 𝑄max ; community number 𝐾; community label 𝐶𝑖 for node 𝑖, 1 ≤ 𝑖 ≤ 𝑁, and 1 ≤ 𝐶𝑖 ≤ 𝐾 𝑄max = 0; 𝐾 = 0; for 𝑘 = 1; 𝑘 ≤ 𝑀; 𝑘 + + do carry out spectral clustering algorithm to get 𝐶𝑖 for node 𝑖: 1 ≤ 𝐶𝑖 ≤ 𝑘; computer modelarity value 𝑄 for 𝐶𝑖 ; if 𝑄 ≥ 𝑄max then 𝑄max = 𝑄; 𝐾 = 𝑘; end end return 𝐾, 𝑄max and 𝐶𝑖 , 1 ≤ 𝐶𝑖 ≤ 𝐾; Algorithm 1: Optimal adaptive spectral clustering algorithm.
the maximum modularity value as community value 𝐾. Once the value of 𝐾 is determined, we can use the spectral clustering algorithm to partition the node set and then extract the community attribute of each node. In order to describe the procedure more clearly, we give Algorithm 1. Compared with original spectral clustering algorithm, the advantage of adaptive spectral clustering algorithm is that it needs not to know the exact cluster number in advance, which make our method more reasonable and practical. After the community division, for each node, we can compute two centralities: global centrality and local centrality. The first one is used to quantify its social status in the whole network, and the other one indicates its social status in the community of its own. 4.2. Formulation of Utility Function 4.2.1. Energy. In a practical scenario, on the one hand, the energy of any device in the network is limited especially for the mobile devices, while, on the other hand, the behaviors of nodes, such as neighbor discovery, data forwarding, and data receiving, all will consume energy. Once a node’s energy is exhausted, it will have no ability to forward the packets in its buffer, and those data have no chance to be delivered to the sensing platform. More importantly, if lots of nodes in network are power off, the performance of the MCSN will decrease greatly, and the MCSN can not support any service effectively any more. Then, we regard that the network is “dead” already. Thus, from the view of practicability, energy is a very important factor that should be fully considered when designing routing strategy. As mentioned earlier, in order to simplify the issue, we assume that the energy of node is mainly consumed on the data forwarding and receiving, and the energy consumed on the data saving is ignored. Then, more specifically, assume that the initial energy of the node for data delivery is 𝐸init , and energy consumption is divided into two parts, in which the first one is energy for data forwarding, and the other one is for data receiving. In addition, we also assume that the energy consumed by forwarding or receiving for each packet is the same. Then, we can update the residual energy of each
node according to the total packets that it has forwarded and received. Therefore, we have the following equation: 𝐸new = 𝐸init − 𝐸𝑝 ⋅ 𝑃𝑡 ,
(8)
where 𝐸𝑝 denotes the energy consumed on forwarding or receiving for each packet and 𝑃𝑡 is the total number of packets which have been forwarded or received. 4.2.2. Buffer. In the DTNs or opportunistic networks, multicopy routing strategies are often used to improve the delivery quality, and there will exist many replicas of the same packet in the same time in the network during the sensed data delivery. If the buffers of nodes are all sufficient, this will achieve good performance of network, such as high delivery rate and short delivery delay. However, in a practical scenario, although the memory space of mobile devices nowadays is huge, the buffering space that the users are willing to share with crowdsensing tasks is very limited. If the buffering space for crowdsensing tasks is full, the node will either not receive packets any more or discard the packets in this buffer to make room for the coming ones. If the node does not receive any packets due to full buffer space, lots of data forwarding opportunities will be wasted, which obviously will decrease the performance of network. On the other hand, if the node chooses to receive new ones, it must drop the packets in this buffer, which will also decrease the delivery quality. Therefore, from the view of practicability, the buffer space of node is also an important factor that should be fully considered when doing the relay node selection. In our work, we assume that the buffer spaces that each node is willing to share for crowdsensing tasks are limited and equal, which is denoted by 𝐵init . When the node receives a packet 𝑚, whose size is 𝐵𝑚 , the remaining buffer capacity will be reduced. And when the nodes drop a packet 𝑛 whose size is 𝐵𝑛 , the remaining buffer will be increased. Then, residual buffer is computed using the following equation: 𝐵new = 𝐵init − 𝐵𝑚 + 𝐵𝑛 .
(9)
Using this equation, the residual buffer space of each node can be updated after each encounter with others in real time according to its data exchange.
International Journal of Distributed Sensor Networks
7
node 𝑖 carried packet 𝑚 (whose destination is node 𝐷) meet with node 𝑗; if 𝑗 = 𝐷 then forwarding packet 𝑚 to node 𝑗; update buffer, energy and 𝑀𝑒𝑡 for node 𝑖 and 𝑗; end else if Community(𝑖) != Community(𝐷) then if Community(𝑗) = Community(𝐷) or 𝐺𝑙𝑜𝑏𝑎𝑙 𝑀𝑒𝑡(𝑖) ≤ 𝐺𝑙𝑜𝑏𝑎𝑙 𝑀𝑒𝑡(𝑗) then forwarding packet 𝑚 to node 𝑗; update buffer, energy and 𝑀𝑒𝑡 for node 𝑖 and 𝑗; end end else if Community(𝑗) = Community(D) and 𝐿𝑜𝑐𝑎𝑙 𝑀𝑒𝑡(𝑖) ≤ 𝐿𝑜𝑐𝑎𝑙 𝑀𝑒𝑡(𝑗) then forwarding packet 𝑚 to node 𝑗; update buffer, energy and 𝑀𝑒𝑡 for node 𝑖 and 𝑗; end end Algorithm 2: EBRP strategy.
4.2.3. Utility Function. When data is delivered, in order to improve the delivery quality, the node carrying sensed data must choose a “best” node as relay. The performance of relay node is closely related to social status, residual energy, and buffering space. Specifically, a node with a relatively higher centrality will be more likely to meet with other nodes, and the carried packets will be forwarded more quickly. If the node has enough residual energy, it can complete many data transmission and reception, which is particularly important for the improvement of the performance of the network. On the other hand, if the residual energy of the node is close to zero, the node loses the ability of the relay, and its contribution to the network performance is close to zero. As for buffering space, it mainly reflects the storage capacity of a node. If there is enough remaining cache, a node can carry more data package. And if it happens that the node has enough residual energy, it will be able to complete more packet transmissions, which is bound to greatly improve the performance of the network delivery. Then, in our routing strategy, we can use the three factors to evaluate each candidate. Specifically, we have quantified the three attributes of each node; then, we integrate them into the following function as 𝑀𝑒𝑡 = lg (𝛼𝐶 + 1) ∗ lg (𝛽𝐵 + 1) ∗ lg (𝛾𝐸 + 1) ,
(10)
where 𝐶 is betweenness centrality of node, 𝐵 is residual buffer, 𝐸 is residual energy, and 𝛼, 𝛽, and 𝛾 are their parameters, respectively. It can be easily derived from (10) that if any value of 𝐶, 𝐵, or 𝐸 is zero, the function is always zero. According to our EBRP, when two nodes meet, the node with higher utility function is always chosen as relay to complete packet forwarding. The node with zero utility function has poor relay ability, which has almost no contribution to network delivery performance. Maybe the social status, residual energy, and buffering space of node have different importance on the delivery quality; then, we can use the parameters of 𝛼, 𝛽, and 𝛾 to adjust their voices on the relay selection, respectively.
4.3. Forwarding Strategy. The packet forwarding process can be divided into two stages according to whether the data packets enter the target community, and the stage before entering the target community is defined as the first stage. Once the packet enters its target community, forwarding process enters the second stage. More specifically, in the first stage, when the two nodes encounter, if the encountered node and destination node belong to the same community, then data forwarding is carried out directly. Otherwise, the node carrying packets will firstly use the global centrality to compute Met values (denoted as Global Met in Algorithm 2) of itself and encountered node according to (10). Then, the node carrying packets will do comparison. If the value of its Global Met is smaller than that of the encountered node, it will select the latter as relay and forward packets; otherwise, nothing will be done. When the packet enters the community of target node, the second stage begins. The node carrying packets will utilize local centrality to compute the value of Met (denoted as Local Met in Algorithm 2) according to (10) for the node encountered and then decide whether to do data forwarding. Algorithm 2 illustrates our forwarding strategy in detail.
5. Simulation and Evaluation In this section, we will briefly introduce our simulation environment, real-life mobility traces utilized, and the forwarding strategies to be compared with at first. Then, we will give extensive comparisons and analysis based on the simulation results. 5.1. Simulation Environment Setup. In order to evaluate the performance of our newly proposed routing strategy, we have developed a framework for MCSN using the tool of Microsoft Visual 2008 VC++. In the framework, time is discrete, and simulator can read the mobility traces line by line. If a node encounters others, we ignore the duration time and assume
8
International Journal of Distributed Sensor Networks Table 1: Characteristics of the three experimental datasets.
Experimental dataset Devices Network type Duration (days) Granularity (seconds) Number of experimental devices Number of internal contacts/pairs/days Average contact number Movement range of experimental devices
Infocom06 iMote Bluetooth 3 120 98 170,601 5.98 Venue (Hotel)
that they all can finish their data exchange. All the nodes have the same initial energy which will decrease as they receive or send packets. Similarly, all the nodes have the same size of initial buffering space. During each time of simulation, the simulator will generate one packet after reading one line of mobility traces, and the total number of packets generated is 1000. For each packet, its source and destination nodes are all selected randomly, and its birth time is the real time when the line of mobility trace is generated. In addition, each packet has the same value of Time-To-Live (TTL). If all the packets in the network expire, the simulation is finished. Here, we use the DF(DropFront) strategy, in which the first packet reaching the buffer will be dropped when the buffer of node is full. 5.2. Dataset Introduction. In our simulations, we use three real-life mobility traces gathered by the Haggle Project [30] over two years, referred to as Cambridge, Infocom06, and MIT Reality [31]. The characteristics of these datasets, such as intercontact and contact distribution, have been explored in several studies [17, 19, 22, 23] previously, to which we refer the reader for further background information. These three datasets cover a rich diversity of experimental period from several days (Infocom06) to more than one-half year (Reality). (i) Infocom06. In the mobility dataset of Infocom06, the devices were distributed to approximately 80 participants attending the Infocom student workshop. Participants belong to different social communities (depending on their country of origin, research topic, etc.). In particular, 80 participants were selected so that 34 out of 80 form 4 subgroups by academic affiliations. (ii) Cambridge. In the dataset of Cambridge, the iMotes were distributed mainly to two groups of students from the University of Cambridge Computer Laboratory, specifically undergraduate year 1 and year 2 students, and also some Ph.D. and masters’ students. This dataset covers 11 days, and its granularity is about 10 minutes. (iii) Reality. In the dataset of Reality, 100 smart phones were deployed to students and staff at MIT over a period of nine months. These phones were running software that logged contacts with other Bluetooth-enabled devices by doing Bluetooth device discovery every five minutes.
Cambridge iMote Bluetooth 11 600 36 10,641 0.77 Campus
MIT Reality Phone Bluetooth 196 300 97 102,593 0.056 Campus
The three experimental datasets are summarized in Table 1. A remark about the datasets is that the experiments do not have the same granularity and the finest granularity is limited to 120 seconds. This is because of the tradeoff between the duration of the experiments and the accuracy of the samplings. 5.3. Strategies to Be Compared with. In this paper, in order to evaluate the performance of our proposed strategy, we compare it with the following three protocols. During the performance comparison, all the nodes have the same constraints on the energy and buffering space: (i) Epidemic routing [8] is a flooding multicopy algorithm often used as a baseline for comparison. If the energy and buffer are sufficient, this strategy can achieve the optimal delivery delay, while achieving the highest cost. During our comparison, we consider the situation that all the nodes have the same limited energy and buffer. (ii) BubbleRap routing [23] is a sociality-based opportunistic routing protocol. In this protocol, the social nature is the unique factor considered when the relay node is selected, and the energy and buffer space are all ignored. During the performance comparison, we make the simulation environment more practical, and each node has limited energy and buffering space. (iii) EABubble [25] is an improved version of BubbleRap which also considers the influence of energy on the performance. This is the closest work to ours. 5.4. Performance Metric. In our simulation, we will compare our routing strategy with the others using the following metrics. (i) Delivery Success Ratio. This metric indicates the successful arrival rate of data packets, which can be computed as the following equation illustrates: 𝐷rate =
𝑁arrive , 𝑁total
(11)
where 𝑁arrive represents the number of packets that are successfully delivered to the destination node and 𝑁total is the total number of packets generated during the simulation.
180 d
150 d
120 d
90 d
60 d
30 d
14 d
The TTL of packet (s)
The TTL of packet (s) Epidemic BubbleRap
EBRP EABubble
2d
1d
12 h
6h
3h
2h
1h
30 min
2 min
1 0.9 0.8 0.7 0.6 0.5 0.4 0.3 0.2 0.1 0
10 min
(b)
Delivery success ratio
(a)
EBRP EABubble
3d
Epidemic BubbleRap
7d
4d
2d
1d
1 0.9 0.8 0.7 0.6 0.5 0.4 0.3 0.2 0.1 0
12 h
11 d
7d
Delivery success ratio
9
4d
2d
1d
12 h
6h
3h
2h
1h
0.5 h
1 0.9 0.8 0.7 0.6 0.5 0.4 0.3 0.2 0.1 0
10 min
Delivery success ratio
International Journal of Distributed Sensor Networks
The TTL of packet (s) Epidemic BubbleRap
EBRP EABubble (c)
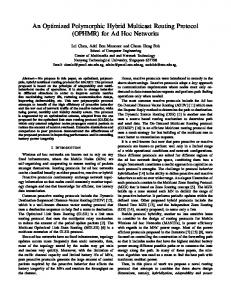
Figure 2: Comparisons of delivery success ratio on several datasets: (a) Cambridge, (b) Reality, and (c) Infocom06.
(ii) Delivery Cost. This metric indicates the average duplicates of a packet, which can be computed using the following equation: 𝐷cost =
𝑁total duplicate 𝑁total
,
(12)
where 𝑁total duplicate denotes the total duplicates of all the packets and the meaning of 𝑁total is described above. (iii) Transmission Hop Number. This metric indicates the average number of hops of the successfully delivered packet, which can be computed using the following equation: 𝐷hop =
𝑁total hop 𝑁total
,
(v) Average Number of Receiving and Sending Packets. This metric gives the average number of packets which are received and transmitted by each node, which indicates the cost of algorithm on each node.
(13)
where 𝑁total hop denotes the total number of hops of all the delivered packets. (iv) Node Survival Rate. This metric indicates the ratio of nodes alive to the total number of nodes in the network at a certain time point.
5.5. Performance Comparison and Analysis. In order to do extensive performance comparisons, we have run our routing strategy and the above three ones based on the datasets of Infocom06, Cambridge, and Reality, respectively. In the following paragraphs, we will give the detailed simulation results and analysis. 5.5.1. Delivery Success Rate. The comparisons of delivery success rates among the four strategies based on the three real-life mobility traces are illustrated in Figure 2. From these figures, we can see the following phenomena. The first one is that Epidemic with limited energy can not achieve the same performance as the traditional Epidemic with unlimited energy, and it has the worst performance. The reason is that when the strategy is implemented, any packet is forwarded to each node encountered. Thus, the total number of packets
International Journal of Distributed Sensor Networks
0.8 0.6 0.4
The TTL of packet (s) Epidemic BubbleRap
180 d
150 d
120 d
90 d
60 d
30 d
14 d
7d
4d
2d
12 h
1d
0.2 0
11 d
7d
4d
2d
1d
12 h
6h
3h
2h
1h
Nodes survival ratio
1
0.5 h
1 0.9 0.8 0.7 0.6 0.5 0.4 0.3 0.2 0.1 0
10 min
Nodes survival ratio
10
The TTL of packet (s) Epidemic BubbleRap
EBRP EABubble (a)
EBRP EABubble (b)
0.8 0.6 0.4
3d
2d
1d
12 h
6h
3h
2h
1h
2 min
0
30 min
0.2
10 min
Nodes survival ratio
1
The TTL of packet (s) Epidemic BubbleRap
EBRP EABubble (c)
Figure 3: Comparisons of node survival ratio on several datasets: (a) Cambridge, (b) Reality, and (c) Infocom06.
which are received and transmitted for each node is large, and the energy and buffer of nodes will exhaust quickly. Therefore, the performance of Epidemic under resource constraints is much worse than that under no resource constraint. The second one is that the performances of BubbleRap and EABubble are all better than that of Epidemic. The reason is obvious. When the two strategies are implemented, a packet will not be forwarded to each encountered node; thus, the average load of each node is much lighter than that of Epidemic, and the average survival time of node will be longer. Therefore, the delivery rates of the two strategies are also better than that of Epidemic. The last one is that, for any dataset, our EBRP has achieved the relatively best performance in terms of successful delivery rate. The main reason is that node’s residual energy and buffer are considered when designing node’s forwarding utility function; thus, the nodes with high social status will not be exhausted too early. Due to the fact that the nodes with relative low social status share a certain percentage of traffic, the energy consumptions of each node are balanced, and the average survival time of important node is extended. In addition, when relay node
is selected, EBRP will fully consider the factor of buffering space; thus, the situation in which lots of packets are dropped for the newly coming ones will not happen. Therefore, it is not surprising for EBRP to achieve the best delivery rate. 5.5.2. Node Survival Rate. The node survival rates of the four strategies based on the three mobility datasets are given in Figure 3. From these three figures, we can see that, for each time point, the node survival rate of Epidemic is the lowest, and that of our EBRP is the highest, which means that EBRP has more nodes that are still alive at the end of the simulation. In other words, the average number of forwarding and receiving times for each node in EBRP is less than that of the other protocols. The main reason is that the residual energy and the remaining buffering space are considered when establishing the node metric function, which can avoid nodes forwarding excessive packets and premature death. This can lead to a relatively larger survival rate of nodes and, to some extent, a longer lifetime of network also. Please note that, under the same settings of parameters, although the strategy of EABubble also considers the energy, from all the
International Journal of Distributed Sensor Networks
11
12
12 10
8
Average cost
6 4 2
6 4
The TTL of packet (s) Epidemic BubbleRap
180 d
150 d
120 d
90 d
60 d
30 d
14 d
7d
4d
12 h
2d
0
11 d
7d
4d
2d
1d
12 h
6h
3h
2h
1h
2 0.5 h
10 min
0
8
1d
Average cost
10
The TTL of packet (s) Epidemic BubbleRap
EBRP EABubble
EBRP EABubble
(a)
(b)
12
Average cost
10 8 6 4
3d
2d
1d
12 h
6h
3h
2h
1h
30 min
2 min
0
10 min
2
The TTL of packet (s) Epidemic BubbleRap
EBRP EABubble (c)
Figure 4: Comparisons of cost on several datasets: (a) Cambridge, (b) Reality, and (c) Infocom06.
three figures we can find that its node survival rate is not much better than that of BubbleRap, and in some place, the former is even worse. 5.5.3. Delivery Cost. Figure 4 gives the delivery costs of the four strategies based on the three mobility datasets, respectively. In order to make the metric of average delivery cost more meaningful, we have excluded data packets that have not reached the destination node and only calculate the average copy number of the packets that are delivered successfully. From these three figures, it can be seen that the strategy of Epidemic almost has the highest average cost, while the average cost of EBRP is the lowest. The reason is that when the factors of social status, energy, and buffering space are all fully considered, the selection of relay node will be more accurate and efficient. Therefore, from the perspective of the whole network, its load is relatively small. 5.5.4. Transmission Hop Number. In order to highlight the efficiency of our routing strategy, we also give the comparison of average transmission hop number among the four strategies based on the three real-life mobility datasets as Figure 5
illustrates. To make the comparison more meaningful, we just compute the metric according to the hop numbers of packets which are delivered successfully. From these figures, we can see that, for each dataset, all the four strategies almost have the same tendencies. More specifically, the strategy of Epidemic has the biggest average hop number, and our strategy EBRP has the smallest metric. This result is very interesting. It is known that traditional Epidemic with no resource constraint has the optimal average delivery delay and the smallest average hops for each packet delivered successfully. However, in the situation where the energy and buffer are limited, its average transmission hop number is the biggest. The reason is that the strategy of Epidemic exhausts too much buffering space; thus, lots of packets, which could be delivered successfully, are discarded to make room for the newly coming ones during their delivery. Thus, we have the opposite result. In contrast, our strategy of EBRP has taken the factor of buffering space into account from the beginning of its design, which can avoid this problem as much as possible. The strategies of BubbleRap and EABubble did not consider the buffering space also when they do relay node selection, but comparing with Epidemic, the average number
12
International Journal of Distributed Sensor Networks 5 Average hop number
4 3 2
4 3 2 1
The TTL of packet (s) Epidemic BubbleRap
180 d
150 d
120 d
90 d
60 d
30 d
14 d
7d
4d
2d
12 h
1d
0
11 d
7d
4d
2d
1d
12 h
6h
3h
2h
10 min
0
1h
1 0.5 h
Average hop number
5
The TTL of packet (s) Epidemic BubbleRap
EBRP EABubble
EBRP EABubble
(a)
(b)
Average hop number
5 4 3 2 1
3d
2d
1d
12 h
6h
3h
2h
1h
30 min
10 min
2 min
0
The TTL of packet (s) Epidemic BubbleRap
EBRP EABubble (c)
Figure 5: Comparisons of average hop number on several datasets: (a) Cambridge, (b) Reality, and (c) Infocom06.
of replicas for a packet is much smaller in the network, and the number of packets which are discarded due to full storage will be relatively small. Thus, we can find from the figures that these metrics of them are all better than that of Epidemic but worse than EBRP. 5.5.5. Average Number of Sending and Receiving Packets. In order to show the efficiency of our strategy further, we also compute the average number of sending and receiving packets for each node which indicates the load from the perspective of single node. The performance comparison among the four strategies based on the three datasets is illustrated in Figure 6. From these figures, we can clearly see that the metric for any strategy will increase as the TTL increases, regardless of the dataset utilized. We can also find that EBRP has always maintained the smallest metric in these four protocols. This also explains why the EBRP has the largest node survival rate and the lowest cost at the end of the simulation.
6. Conclusion and Future Work In this paper, we introduce an adaptive clustering method based on the optimal modularity to extract community attributes of the nodes and propose a novel and practical routing protocol for MCSN, named EBRP, in which the sociality of node and the dynamic changes of the attributes of node itself, such as energy and buffering space, are all fully considered when the relay nodes are selected. To evaluate the performance of our routing protocol, we have done extensive simulations and much analysis based on three real-life mobility traces. The results showed that our EBRP protocol can greatly outperform the existing protocols in terms of delivery ratio, cost, and node survival ratio and extend the life of the network. This paper is based on the assumption that the social attributes of the user are relatively stable. But in actual situation, the user’s social attributes may change a little with time. In future work, we intend to analyze the relationship between the user social attributes and the time and explore the routing based on time-varying user’s social attributes.
International Journal of Distributed Sensor Networks
13 30 Average number of packets
Average number of packets
30 25 20 15 10 5 0
30 min
4d 1d Simulations in different TTL 3h
Epidemic BubbleRap
25 20 15 10 5 0
7d
1d
60 d 120 d 14 d Simulations in different TTL
Epidemic BubbleRap
EBRP EABubble (a)
180 d
EBRP EABubble (b)
Average number of packets
30 25 20 15 10 5 0
10 min
3h 12 h 1d Simulations in different TTL
Epidemic BubbleRap
3d
EBRP EABubble (c)
Figure 6: Comparisons of average number of sending and receiving data packets on several datasets: (a) Cambridge, (b) Reality, and (c) Infocom06.
Conflict of Interests The authors declare that there is no conflict of interests regarding the publication of this paper.
Acknowledgments This work is supported by the National Key Technology R&D Program of China (2015BAF32B04-3), the Joint Funds of the National Natural Science Foundation of China (Grant no. U1404615), the Key Science and Research Program in University of Henan Province (16A460018), the Project of Basic and Advanced Technology Research of Henan Province of China (152300410081), the Program for Innovative Research Team (in Science and Technology) in University of Henan Province (15IRTSTHN008), Open Funds of State Key Laboratory of Millimeter Waves (Grant no. K201504), and China Postdoctoral Science Foundation (Grant no. 2015M571637).
References [1] Y. liu, “Crowd sensing computing,” China Communication of the ACM, vol. 8, no. 10, pp. 38–41, 2012.
[2] M. Ra, B. Liu, and T. L. Porta, “Medusa: a programming framework for crowd-sensing applications,” in Proceedings of the ACM 10th International Conference on Mobile Systems, Applications, and Services (MobiSys ’12), Ambleside, UK, June 2012. [3] H. Ma, D. Zhao, and P. Yuan, “Opportunities in mobile crowd sensing,” IEEE Communications Magazine, vol. 52, no. 8, pp. 29– 35, 2014. [4] B. Guo, Z. Wang, Z. Yu et al., “Mobile crowd sensing and computing: the review of an emerging human-powered sensing paradigm,” ACM Computing Surveys, vol. 48, no. 1, article 7, 2015. [5] M. Marjanovi´c, L. Skorin-Kapov, K. Pripuˇzi´c, A. Antoni´c, and ˇ I. P. Zarko, “Energy-aware and quality-driven sensor management for green mobile crowd sensing,” Journal of Network and Computer Applications, vol. 59, pp. 95–108, 2016. [6] K. Fall, “A delay-tolerant network architecture for challenged internets,” in Proceedings of the Conference on Computer Communications (ACM SIGCOMM ’03), pp. 27–34, August 2003. [7] Y.-P. Xiong, L.-M. Sun, J.-W. Niu, and Y. Liu, “Opportunistic networks,” Journal of Software, vol. 20, no. 1, pp. 124–137, 2009. [8] A. Vahdat and D. Becker, “Epidemic routing for partiallyconnected ad hoc networks,” Tech. Rep. CS-200006, Department of Computer Science. Duke University, 2000.
14 [9] R. C. Shah, S. Roy, S. Jain, and W. Brunette, “Data MULEs: modeling and analysis of a three-tier architecture for sparse sensor networks,” Ad Hoc Networks, vol. 1, no. 2-3, pp. 215–233, 2003. [10] T. Spyropoulos, K. Psounis, and C. S. Raghavendra, “Efficient routing in intermittently connected mobile networks: the single-copy case,” IEEE/ACM Transactions on Networking, vol. 16, no. 1, pp. 63–76, 2008. [11] T. Spyropoulos, K. Psounis, and C. S. Raghavendra, “Spray and wait: an efficient routing scheme for intermittently connected mobile networks,” in Proceedings of the ACM SIGCOMM Workshop on Delay-Tolerant Networking (WDTN ’05), pp. 252– 259, Philadelphia, Pa, USA, August 2005. [12] A. Lindgren, A. Doria, and O. Schelen, “Probabilistic routing in intermittently connected networks,” in Proceedings of the Fourth ACM International Symposium on Mobile Ad Hoc Networking and Computing (MobiHoc ’03), June 2003. [13] T. Spyropoulos, K. Psounis, and C. S. Raghavendra, “Efficient routing in intermittently connected mobile networks: the multiple-copy case,” IEEE/ACM Transactions on Networking, vol. 16, no. 1, pp. 77–90, 2008. [14] J. Burgess, B. Gallagher, D. Jensen, and B. N. Levine, “MaxProp: routing for vehicle-based disruption-tolerant networks,” in Proceedings of the 25th IEEE International Conference on Computer Communications (INFOCOM ’06), pp. 1–11, IEEE, Barcelona, Spain, April 2006. [15] H. A. Nguyen and S. Giordano, “Context information prediction for social-based routing in opportunistic networks,” Ad Hoc Networks, vol. 10, no. 8, pp. 1557–1569, 2012. [16] E. Talipov, Y. Chon, and H. Cha, “User context-based data delivery in opportunistic smartphone networks,” Pervasive and Mobile Computing, vol. 17, no. 1, pp. 122–138, 2015. [17] A. Chaintreau, P. Hui, J. Crowcroft, C. Diot, R. Gass, and J. Scott, “Impact of human mobility on opportunistic forwarding algorithms,” IEEE Transactions on Mobile Computing, vol. 6, no. 6, pp. 606–620, 2007. [18] E. Bulut and B. K. Szymanski, “Exploiting friendship relations for efficient routing in mobile social networks,” IEEE Transactions on Parallel and Distributed Systems, vol. 23, no. 12, pp. 2254–2265, 2012. [19] E. M. Daly and M. Haahr, “Social network analysis for routing in disconnected delay-tolerant MANETs,” in Proceedings of the 8th ACM International Symposium on Mobile Ad Hoc Networking and Computing (MobiHoc ’07), pp. 32–40, Montreal, Canada, September 2007. [20] A. Mtibaa, M. May, C. Diot, and M. Ammar, “PeopleRank: social opportunistic forwarding,” in Proceedings of the 30th IEEE International Conference on Computer Communications (INFOCOM ’10), pp. 1–5, IEEE, San Diego, Calif, USA, March 2010. [21] J. Leguay, T. Friedman, and V. Conan, “Evaluating mobility pattern space routing for DTNs,” in Proceedings of the 25th IEEE International Conference on Computer Communications (INFOCOM ’06), Barcelona, Spain, April 2006. [22] E. M. Daly and M. Haahr, “Social network analysis for information flow in disconnected delay-tolerant MANETs,” IEEE Transactions on Mobile Computing, vol. 8, no. 5, pp. 606–621, 2009. [23] P. Hui, J. Crowcroft, and E. Yoneki, “BUBBLE Rap: social-based forwarding in delay-tolerant networks,” IEEE Transactions on Mobile Computing, vol. 10, no. 11, pp. 1576–1589, 2011.
International Journal of Distributed Sensor Networks [24] P. Yuan, H. Ma, and H. Fu, “Hotspot-entropy based data forwarding in opportunistic social networks,” Pervasive and Mobile Computing, vol. 16, pp. 136–154, 2015. [25] C. Chilipirea, A.-C. Petre, and C. Dobre, “Energy-aware socialbased routing in opportunistic networks,” in Proceedings of the 27th International Conference on Advanced Information Networking and Applications Workshops (WAINA ’13), pp. 791– 796, Barcelona, Spain, March 2013. [26] D. Feng, G. Feng, and Q. Shuang, “Buffer aware routing for resource-constrained DTNs,” in Proceedings of the IEEE International Conference on Communications, Circuits and Systems (ICC-CAS ’13), Chengdu, China, November 2013. [27] A. Mtibaa and K. A. Harras, “Fairness-related challenges in mobile opportunistic networking,” Computer Networks, vol. 57, no. 1, pp. 228–242, 2013. [28] A. Y. Ng, M. I. Jordan, and Y. Weiss, “On spectral clustering: analysis and an algorithm,” in Advances in Neural Information Processing Systems 14, T. Dietterich, S. Becker, and Z. Ghahramani, Eds., pp. 849–856, MIT Press, Cambridge, Mass, USA, 2002. [29] M. E. J. Newman, “Fast algorithm for detecting community structure in networks,” Physical Review E, vol. 69, no. 6, Article ID 066133, 5 pages, 2004. [30] http://www.haggleproject.org. [31] N. Eagle and A. Pentland, “Reality mining: sensing complex social systems,” Personal and Ubiquitous Computing, vol. 10, no. 4, pp. 255–268, 2006.
International Journal of
Rotating Machinery
Engineering Journal of
Hindawi Publishing Corporation http://www.hindawi.com
Volume 2014
The Scientific World Journal Hindawi Publishing Corporation http://www.hindawi.com
Volume 2014
International Journal of
Distributed Sensor Networks
Journal of
Sensors Hindawi Publishing Corporation http://www.hindawi.com
Volume 2014
Hindawi Publishing Corporation http://www.hindawi.com
Volume 2014
Hindawi Publishing Corporation http://www.hindawi.com
Volume 2014
Journal of
Control Science and Engineering
Advances in
Civil Engineering Hindawi Publishing Corporation http://www.hindawi.com
Hindawi Publishing Corporation http://www.hindawi.com
Volume 2014
Volume 2014
Submit your manuscripts at http://www.hindawi.com Journal of
Journal of
Electrical and Computer Engineering
Robotics Hindawi Publishing Corporation http://www.hindawi.com
Hindawi Publishing Corporation http://www.hindawi.com
Volume 2014
Volume 2014
VLSI Design Advances in OptoElectronics
International Journal of
Navigation and Observation Hindawi Publishing Corporation http://www.hindawi.com
Volume 2014
Hindawi Publishing Corporation http://www.hindawi.com
Hindawi Publishing Corporation http://www.hindawi.com
Chemical Engineering Hindawi Publishing Corporation http://www.hindawi.com
Volume 2014
Volume 2014
Active and Passive Electronic Components
Antennas and Propagation Hindawi Publishing Corporation http://www.hindawi.com
Aerospace Engineering
Hindawi Publishing Corporation http://www.hindawi.com
Volume 2014
Hindawi Publishing Corporation http://www.hindawi.com
Volume 2014
Volume 2014
International Journal of
International Journal of
International Journal of
Modelling & Simulation in Engineering
Volume 2014
Hindawi Publishing Corporation http://www.hindawi.com
Volume 2014
Shock and Vibration Hindawi Publishing Corporation http://www.hindawi.com
Volume 2014
Advances in
Acoustics and Vibration Hindawi Publishing Corporation http://www.hindawi.com
Volume 2014